
Key risk events today:
BoJ Governor Kuroda Speaks.
EUR/USD:
Weekly gain/loss: -1.26%
Weekly close: 1.1224
Weekly perspective:
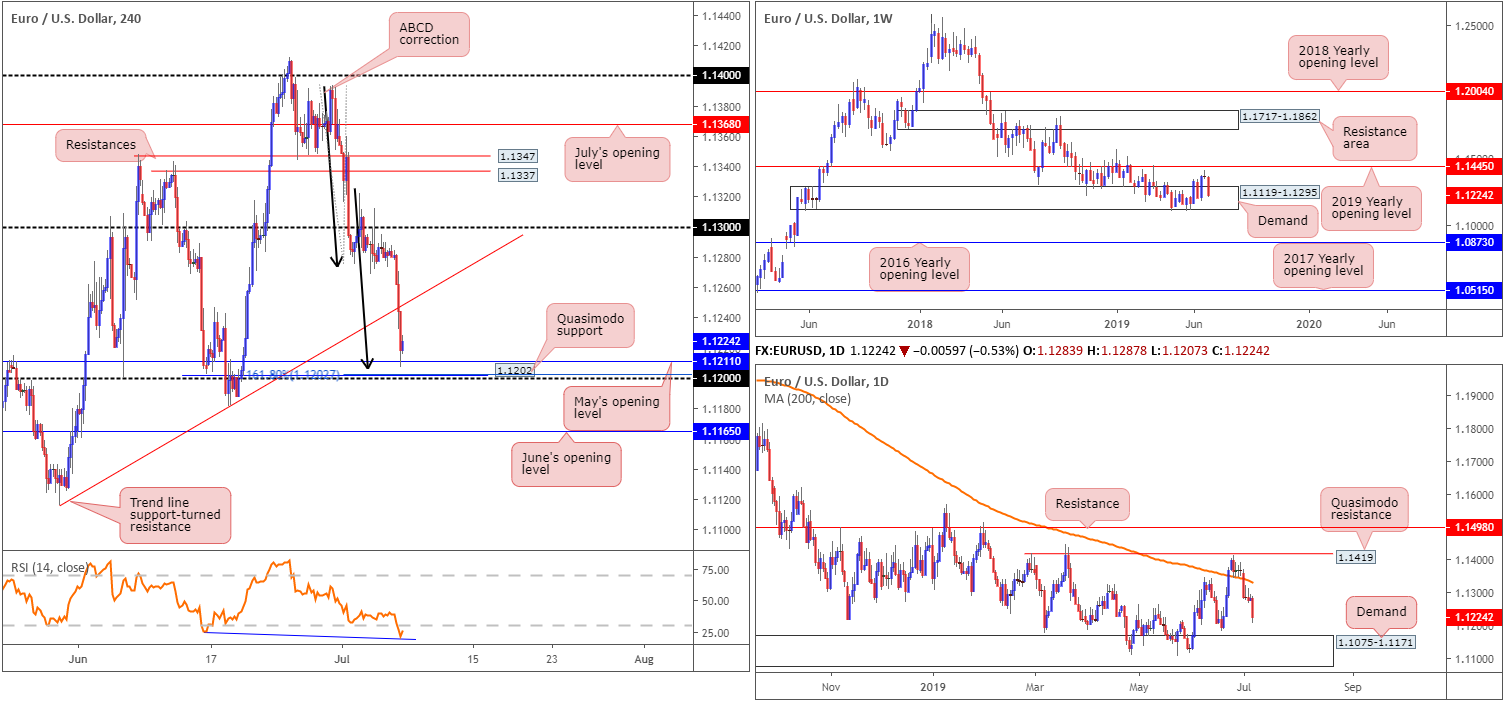
Since early November 2018, a long-standing demand area at 1.1119-1.1295 has capped downside. As impressive as this is, impetus is lacking as price is unable to overthrow the 2019 yearly opening level (resistance) at 1.1445. Areas outside of the said zones to be aware of fall in around the 2016 yearly opening level at 1.0873 (support) and a resistance area drawn from 1.1717-1.1862.
In terms of recent movement, the unit failed to test the underside of 1.1445 and produced a near-full-bodied bearish candle, losing more than 140 points last week.
Daily perspective:
Thanks to price action dethroning the 200-day SMA (orange) in early trade last week, the pair, after a couple of days treading water, decisively headed south. Notable demand at 1.1075-1.1171, formed on May 17, 2017, is now-within striking distance this week.
H4 perspective:
Total US non-farm payroll employment increased by 224,000 in June, beating expectations of 162,000. The unemployment rate ticked higher at 3.7% vs. market consensus of 3.6% and average hourly earnings also came in lower-than-expected at 0.2% vs. 0.3%.
The employment release immediately cast a bearish cloud over the EUR/USD, erasing more than 27 points in the space of ten minutes. Follow-through selling ensued, consequently engulfing a trend line support (which was shortly retested as resistance – check the M5 chart for a clearer view) and shaking hands with a particularly interesting support zone between 1.12/1.1211 into the close.
What’s striking about 1.12/1.1211 is its surrounding confluence. Comprised of a round number at 1.12, a Quasimodo support at 1.1202, a 161.8% ABCD (black arrows) correction at 1.1202, May’s opening level at 1.1211 and the H4 RSI indicator currently chalking up hidden divergence out of oversold territory, this zone holds sufficient local confluence to potentially bolster price today/early week and prompt a retest of the recently broken trend line support-turned resistance highlighted above.
The only caveat is daily price eyeing a run to demand at 1.1075-1.1171. Note the top edge of this base merges closely with June’s opening level at 1.1165.
Areas of consideration:
Additional buying out of the H4 support zone at 1.12/1.1211 is a strong possibility, not only because of the mentioned confluence, but also due to traders likely looking to cover shorts, targeting H4 trend line support-turned resistance. Entering long at current price somewhat skews risk/reward, though still offers more than a 1:1 ratio to target – that is assuming stop-loss orders are sited beneath 1.12.
Later in the week, traders are also urged to keep June’s opening level in mind at 1.1162 for a possible bounce, given its association with the top edge of daily demand at 1.1171.
GBP/USD:
Weekly gain/loss: -1.35%
Weekly close: 1.2523
Weekly perspective:
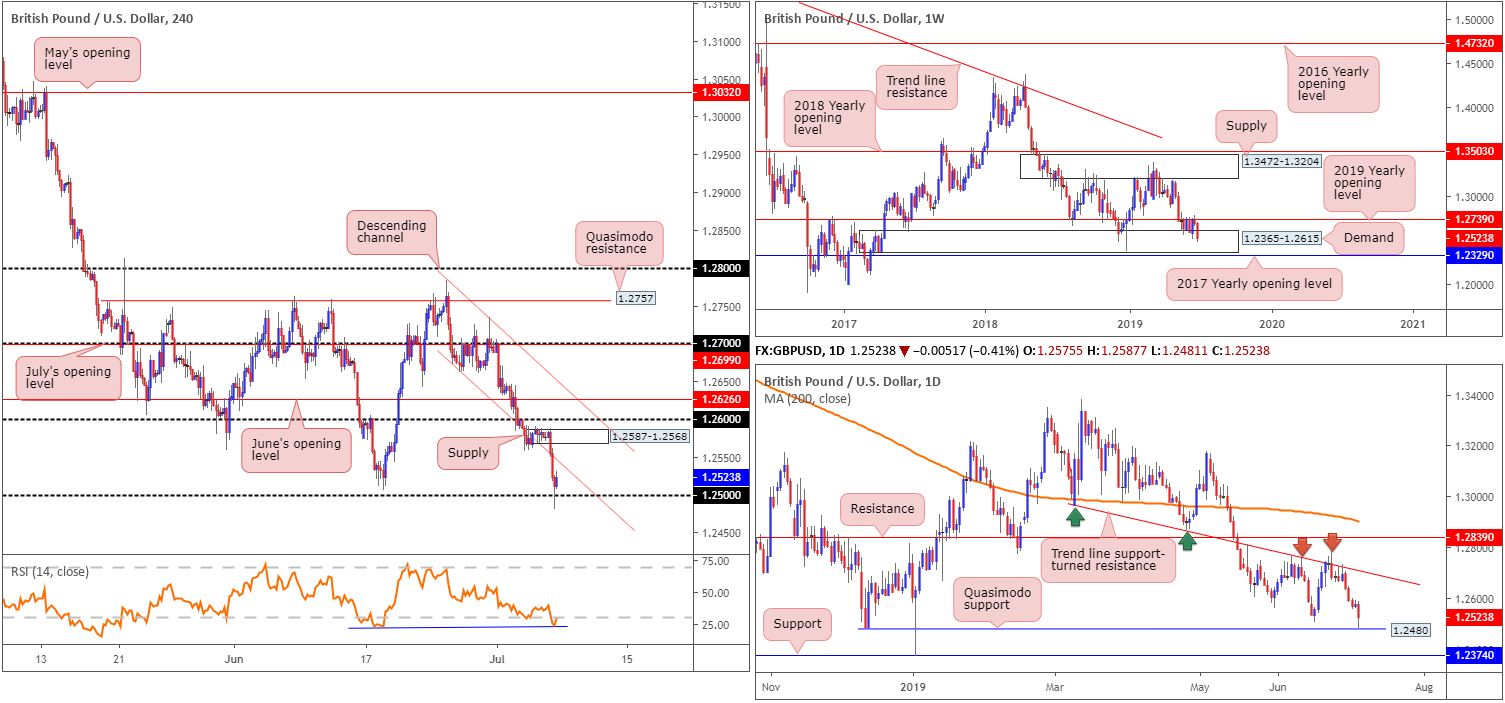
Since May 20, buyers and sellers have been warring for position between long-standing demand at 1.2365-1.2615 and the 2019 yearly opening level at 1.2739 (resistance). In light of recent movement erasing more than 170 points, though, price action is exploring fresh ground within the said demand zone that could eventually lead to a break south.
Areas outside of the current range to be conscious of fall in around the 2017 yearly opening level at 1.2329 (support) and supply coming in at 1.3472-1.3204.
Daily perspective:
Since retesting trend-line support-turned resistance (extended from the low 1.2960), the GBP/USD has emphasised a bearish tone with focus now shifting to possible support emerging from a Quasimodo formation at 1.2480. Note Friday’s action came within a point of testing the said Quasimodo support before mildly paring losses into the close.
H4 perspective:
Friday, as mentioned above, witnessed the British pound maintain its offered tone vs. the US dollar, refreshing near-three-week lows in response to upbeat non-farm payrolls data. Total US non-farm payroll employment increased by 224,000 in June, beating expectations by a wide margin of 162,000.
Leaving 1.26 unchallenged as resistance, the H4 candles turned lower, attacking local channel support taken from the low 1.2662 and crossing swords with 1.25 into the week’s end. Traders who attempted to fade 1.25 were likely caught on the fakeout to the daily Quasimodo support underlined above at 1.2480. This is why it always pays to include the bigger picture in your analysis.
Indicator-based traders may also wish to acknowledge the RSI is in the process of chalking up a double-bottom pattern within oversold terrain.
Areas of consideration:
With the stop run beneath 1.25 likely tripping sell stops – therefore providing liquidity to continue pushing higher from the noted daily Quasimodo support – a run north is perhaps valid. The caveat, however, is the H4 channel support-turned resistance (1.2662) potentially offering resistance. To help overcome this, consider waiting for H4 price to close back within the channel formation and retest 1.25. That way, traders have opened a reasonably clear run towards newly-formed H4 supply at 1.2587-1.2568, closely followed by 1.26.
AUD/USD:
Weekly gain/loss: -0.63%
Weekly close: 0.6977
Weekly perspective:
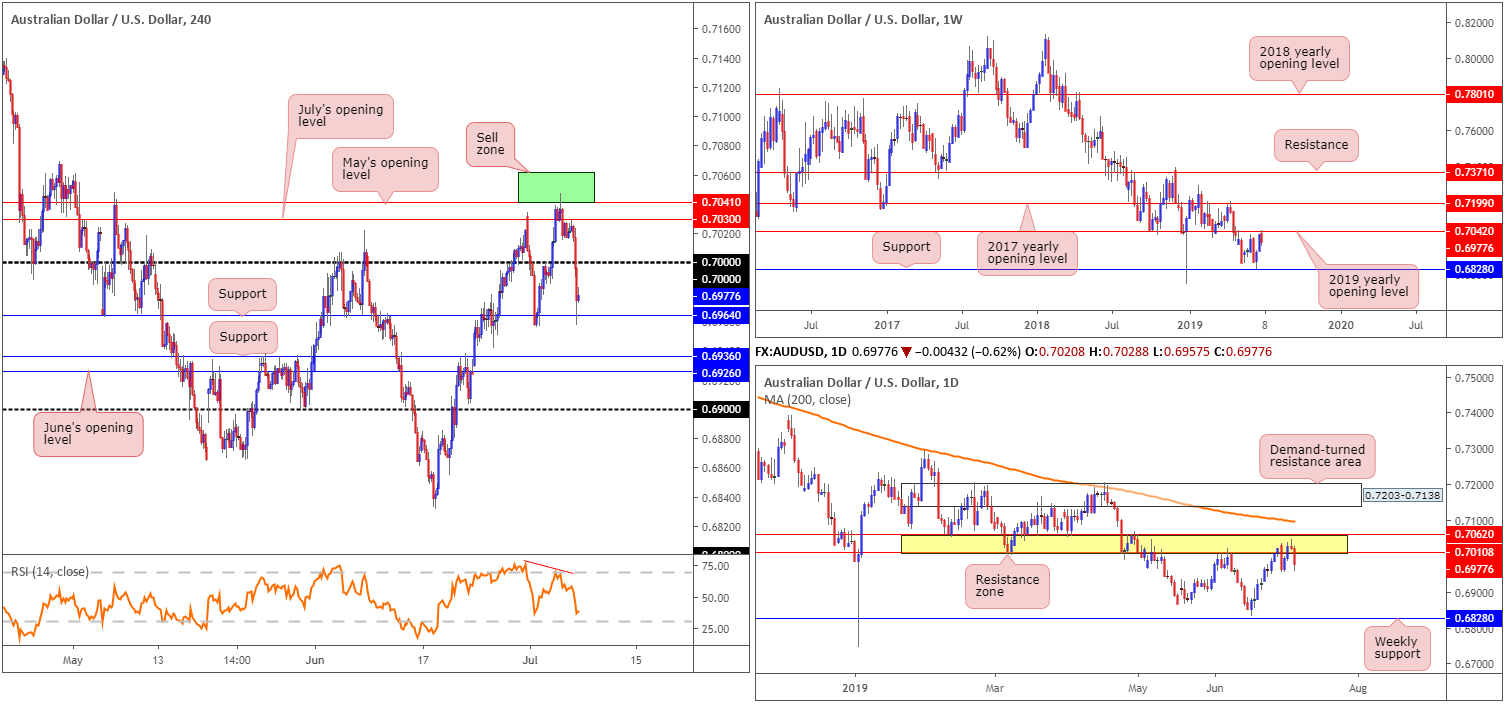
Breaking a two-week bullish phase, of which involved a strong full-bodied bullish candle, price action tested the 2019 yearly opening level at 0.7042 (resistance) and rotated lower last week. Technically speaking, a response from 0.7042 is not surprising, having seen it serve well as support on a number of occasions in the past. Continued selling from this point has support coming in at 0.6828 in sight.
Daily perspective:
A closer reading of price action on the daily timeframe reveals two layers of resistance reside nearby at 0.7062/0.7010, collectively forming a robust resistance zone (yellow). Overhead, traders may also find use in noting the 200-day SMA lurking nearby at around 0.7097 (orange).
Note Thursday’s action chalked up a shooting star bearish candlestick pattern within the said resistance zone, which generated strong selling Friday. Assuming sellers remain in the driving seat, the next downside target on the daily timeframe can be seen around the weekly support mentioned above at 0.6828.
H4 perspective:
For traders who read previous reports you may recall the research team highlighted a sell zone (green) at 0.7062/0.7041, favoured due to the following points:
· Buy stops above Monday’s high 0.7034 were triggered, therefore providing liquidity to sell into.
· May’s opening level applied to the H4 timeframe at 0.7041.
· Weekly resistance at 0.7042: the 2019 yearly opening level.
· Resistance area at 0.7062/0.7010 on the daily timeframe.
· The H4 RSI producing negative divergence (red line).
Thursday observed the said sell zone enter the fray, though it was not until Friday’s non-farm payrolls release did the market witness further selling. Well done to any of our readers who managed to take advantage of this high-probability move. Price easily cleared 0.70 and tested support coming in at 0.6964 into the closing bell.
Areas of consideration:
In light of where the market is trading from on the higher timeframes, further downside is possible this week. A retest at the underside of 0.70, therefore, may be of interest to some traders. Coupled with a H4 or H1 bearish candlestick formation, this is a high-probability setup, with the first take-profit target set at 0.6964, followed closely by another two layers of support at 0.6936 and June’s opening level at 0.6926.
USD/JPY:
Weekly gain/loss: +0.51%
Weekly close: 108.45
Weekly perspective:
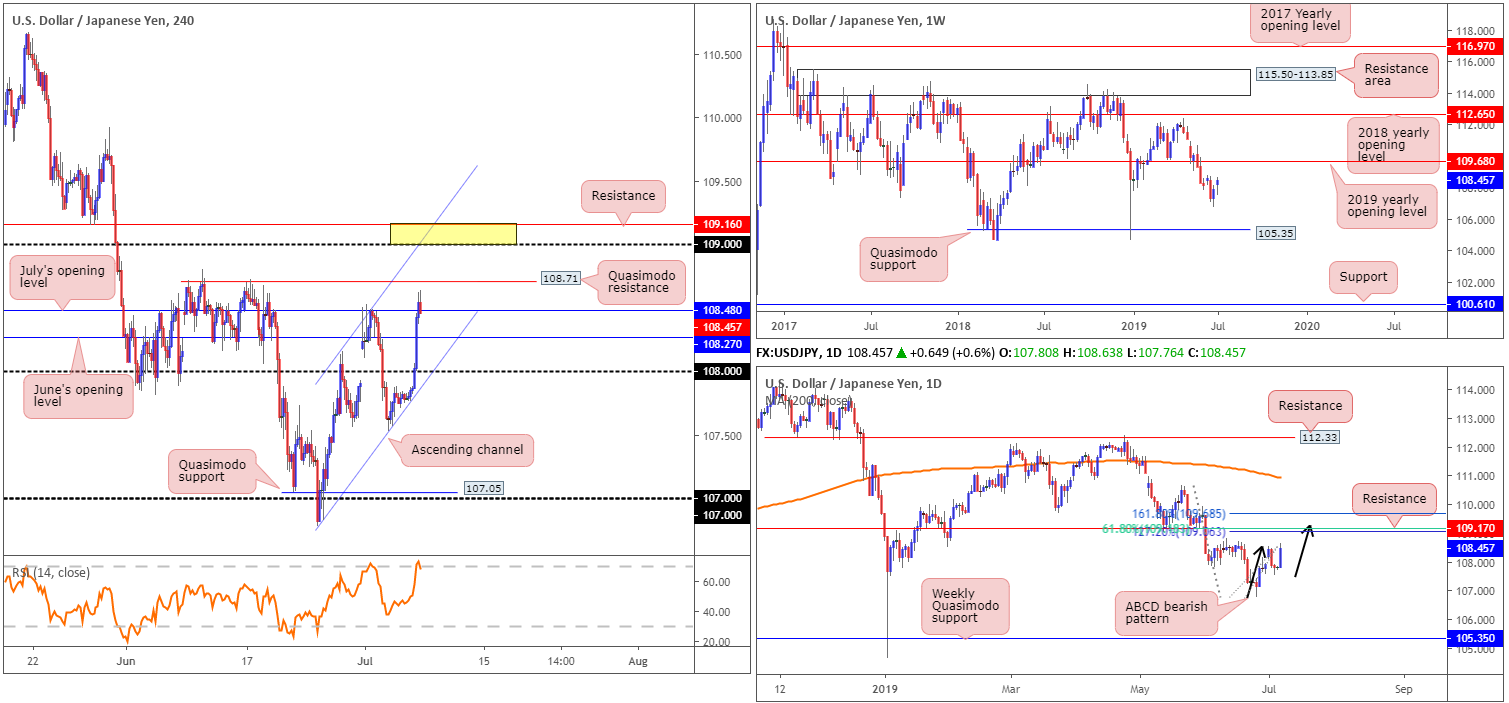
Adding more than 50 points, the US dollar finished the week higher against the Japanese yen. According to technical structure on the weekly timeframe, room to climb higher towards the 2019 yearly opening level at 109.68 (resistance) is possible. To the downside, nonetheless, limited support is visible until reaching Quasimodo support at 105.35.
Daily perspective:
Before reaching 109.68, technical studies on the daily timeframe shows potential resistance around 109.17. What gives this level extra credibility is the merging ABCD bearish pattern (black arrows) at 109.30, the 127.2% Fibonacci ext. at 109.06 and a 61.8% Fibonacci retracement value at 109.18. For traders searching for a medium-term move short this week, this level may be an option with protective stop-loss orders positioned above the 161.8% Fibonacci ext. point at 109.68.
H4 perspective:
Friday witnessed the US dollar index push north from 97.00 and the US 10-year Treasury yield rebound sharply, in response to upbeat non-farm payrolls data.
Early European trade saw buyers dethrone 108 to the upside, which by and of itself likely attracted breakout buyers into the market. This, followed by strong NFP-induced buying, brought the H4 candles north of July’s opening level at 108.48 and missed Quasimodo resistance by a hair at 108.71.
Areas of consideration:
While the H4 Quasimodo resistance at 108.71 is likely of interest for shorts, owing to it serving as a strong ceiling in the past, the research team notes potential resistance also emerging from the 109 handle this week. This level, alongside H4 channel resistance taken from the high 108.13, H4 resistance at 109.16 (yellow) and daily resistance at 109.17 as well as its associated Fibonacci resistances, offers a reasonably well-defined base for selling opportunities.
H4 traders looking to sell 109.16/109 may want to consider placing stop-loss orders above the H4 channel resistance, whereas daily sellers, as already underlined above, might opt for larger stop-loss placement above 109.68.
USD/CAD:
Weekly gain/loss: -0.07%
Weekly close: 1.3078
Weekly perspective:
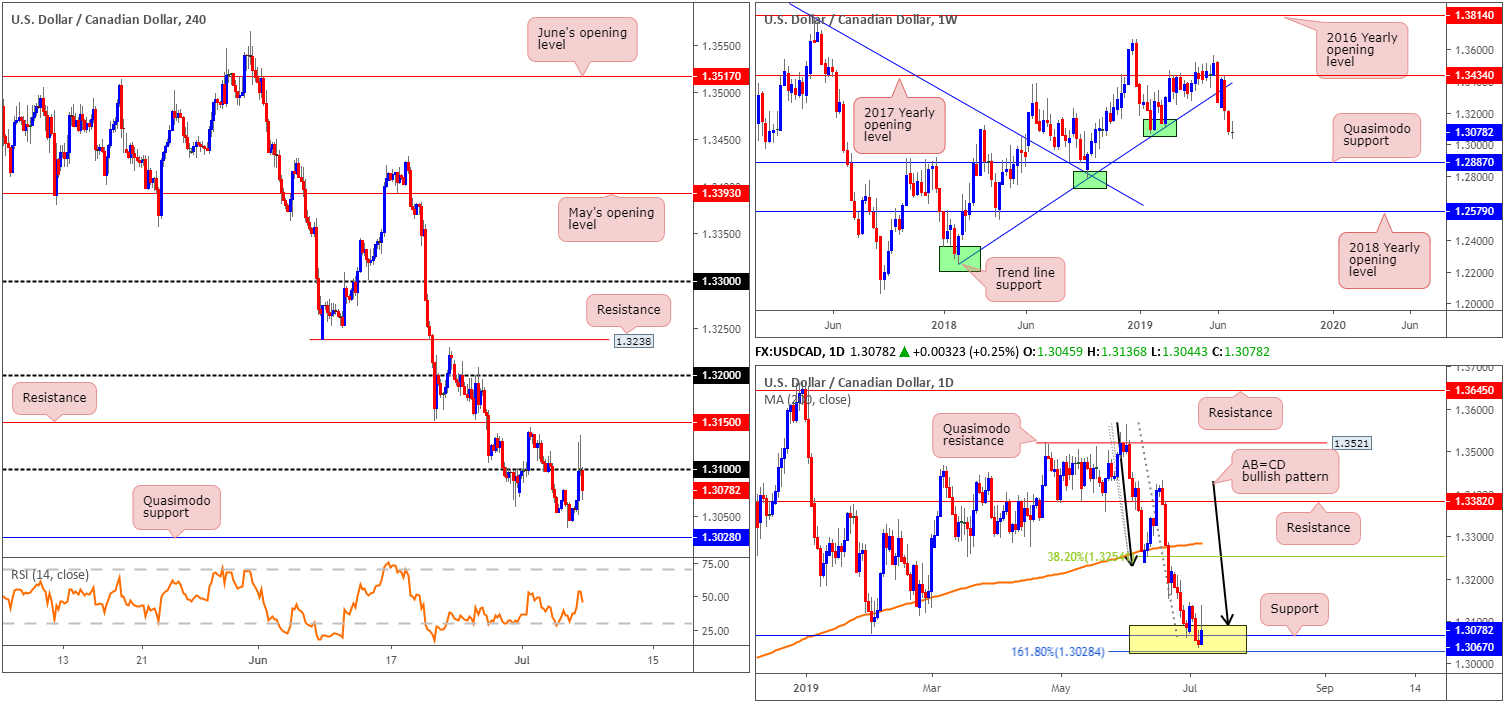
Following two consecutive weeks of selling, shaped by near-full-bodied bearish candles, price action paused last week by way of an indecision candle. Despite the interruption, limited support is evident on the weekly timeframe until reaching as far south as a Quasimodo formation at 1.2887.
Daily perspective:
In recent weeks, the daily candles entered a particularly interesting area of support between 1.3028/1.3089 (yellow). Comprised of an AB=CD (black arrows) formation at 1.3089, a support at 1.3067 and a 161.8% Fibonacci extension at 1.3028 (forms part of the AB=CD structure), the zone remains defensive. A rotation north from here has the 38.2% Fibonacci retracement value of the A-D legs at 1.3254 to target, which happens to closely unite with the 200-day SMA (orange).
H4 perspective:
After descending lower for three consecutive days, the USD/CAD staged a reasonably impressive rebound Friday on the back of employment data releases out of the US and Canada. Total US non-farm payroll employment increased by 224,000 in June, beating expectations of 162,000. The unemployment rate ticked higher at 3.7% vs. market consensus of 3.6% and average hourly earnings also came in lower-than-expected at 0.2% vs. 0.3%. Canadian employment fell by 2.2k vs. consensus expectations for a rise of 10k, while the unemployment rate rose by one-tenth to 5.5%, although y/y wage growth jumped to 3.8% from 2.8%.
Although the unit reached highs of 1.3136, the market pared a large portion of the day’s gains into the close, consequently reclaiming 1.31 to the downside.
Areas of consideration:
Underlined in Thursday’s outlook, H4 Quasimodo support at 1.3028, owing to its connection with the lower edge of a daily buy zone at 1.3028/1.3089, remains an area of interest for possible buying. However, with weekly flows portending further downside, waiting for a H4 bullish candlestick signal to develop is worth considering (entry and risk levels can be determined according to the selected candlestick pattern). A response from 1.3028 could reach as far north as 1.31 for partial profit taking.
Another alternative to buying from the daily support area this week is to wait and see if the H4 candles close above 1.31 and retest the level as support, preferably in the form of a bullish candlestick configuration. This would likely unlock the door towards H4 resistance at 1.3150 as an initial take-profit zone.
USD/CHF:
Weekly gain/loss: +1.56%
Weekly close: 0.9911
Weekly perspective:
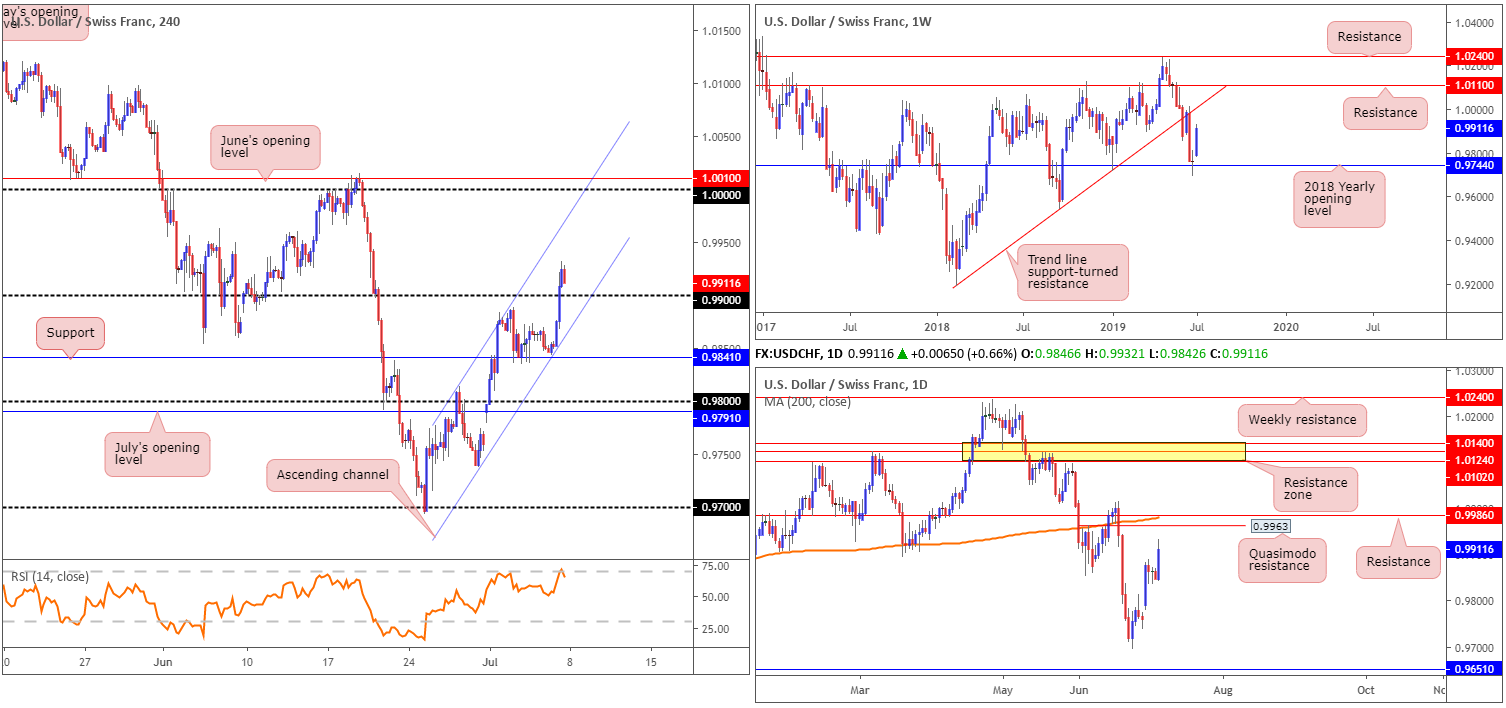
Following a period of indecision off the 2018 yearly opening level at 0.9744, the US dollar turned higher against the safe-haven Swiss franc last week. Further upside, according to technical studies on the weekly timeframe, is a possibility this week, targeting trend line support-turned resistance extended from the low 0.9187.
Daily perspective:
In terms of where the market stands on the daily timeframe in regard to upside targets, Quasimodo resistance at 0.9963 is in the firing range, closely shadowed by the 200-day SMA and another layer of resistance at 0.9986. It might also be worth noting this area of daily resistance is situated south of the weekly trend line resistance by about 30 points.
H4 perspective:
Broad-based USD bidding Friday, bolstered on the back of upbeat non-farm payrolls data, witnessed the H4 candles claim 0.99+ status by the week’s close. Cleared sellers from this psychological mark, and filled breakout buyers’ orders, will likely fuel further buying today/early week. Upside momentum, however, is expected to diminish once H4 channel resistance (extended from the high 0.9814) enters the mix, or the key figure 1.0000 (parity).
As already established on the daily timeframe, though, sellers might attempt to make an appearance before 1.0000 between 0.9986/0.9963.
Areas of consideration:
Room seen to move higher on all three timeframes this week opens up a potential buying opportunity should H4 candles retest 0.99 as support. A retest of this psychological barrier, preferably in the shape of a H4 bullish candlestick signal (helps site entry and risk levels), has 0.9963 to target as the initial take-profit zone (daily resistance). This leaves ample room to secure satisfactory risk/reward.
In the event the analysis is correct and price extends higher, selling opportunities also exist between 1.0010/0.9963. Although a reasonably wide zone, it contains a number of notable resistance structures:
· Daily Quasimodo resistance at 0.9963.
· The 200-day SMA around 0.9986.
· Daily resistance at 0.9986.
· 1.0000 (parity) sited on the H4 timeframe.
· June’s opening level at 1.0010 also on the H4 timeframe.
· H4 channel resistance etched from the high 0.9814.
Dow Jones Industrial Average:
Weekly gain/loss: +0.94%
Weekly close: 26892
Weekly perspective:
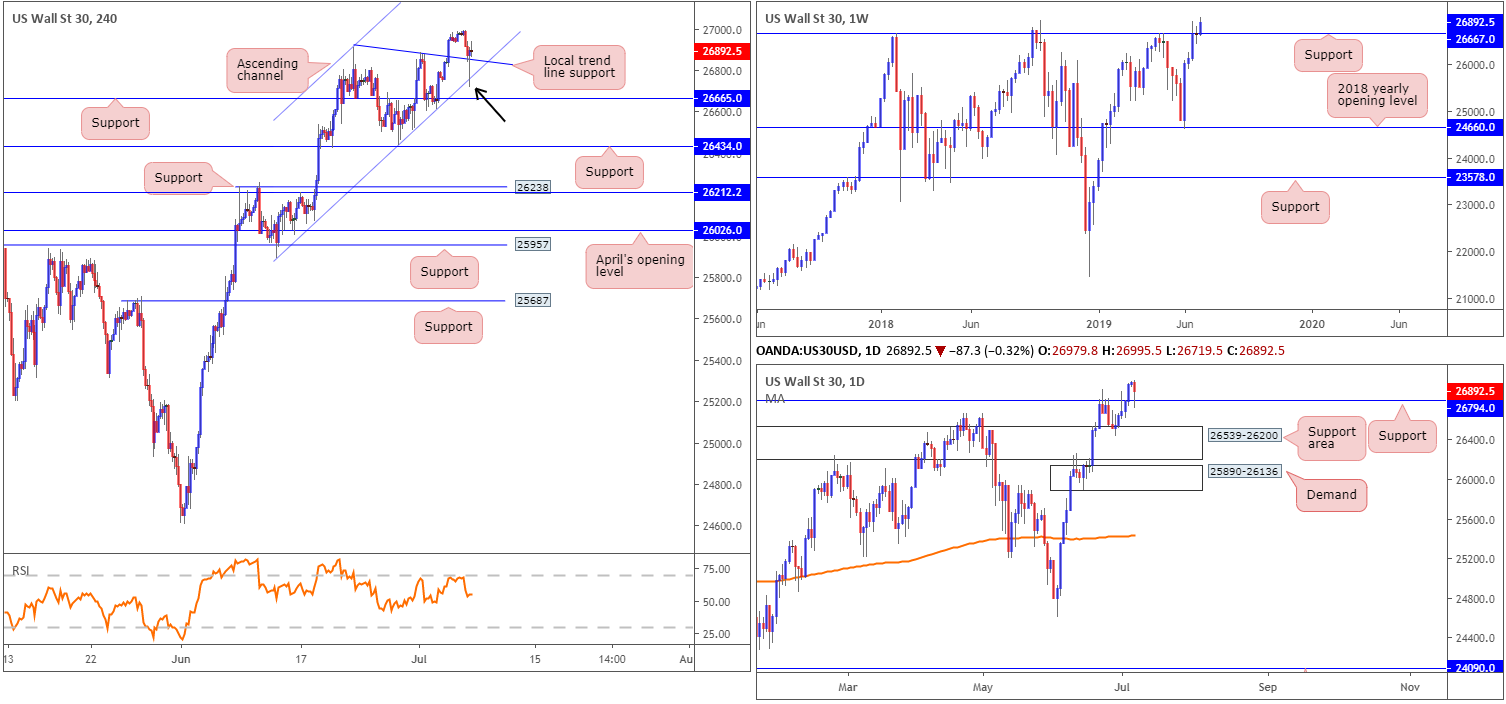
Following a period of indecision around resistance at 26667, buyers regained consciousness and explored higher ground last week, consequently reaching a record high of 26995. With 26667 now potentially offering the market support, this is worth keeping in mind in the event we pullback this week.
Daily perspective:
Closer analysis of price action on the daily timeframe reveals the unit retested support at 26794 Friday and produced a strong buying tail. With limited resistance overhead, this will likely entice further buying this week.
H4 perspective:
Friday’s US employment data triggered a decline in stocks, which, technically, surpassed a local trend line support taken from the high 26912 and tested channel support extended from the low 25890. What’s also interesting is the H4 hammer candlestick pattern (black arrow) formed hours before the close.
Areas of consideration:
In essence, we have weekly price showing room to probe higher this week, daily price also suggesting higher prices after retesting support in the shape of a buying tail as well as H4 price testing supportive structure and producing a hammer candlestick pattern.
Entry long based off the H4 hammer configuration is certainly an option today – entry at the open with a protective stop-loss order positioned beneath the hammer’s lower shadow (26719). As for upside targets, it’s a challenge seeing as we’re at record highs. For that reason, employing some form of trailing stop is recommended here.
XAU/USD (GOLD):
Weekly gain/loss: -0.68%
Weekly close: 1399.5
Weekly perspective:
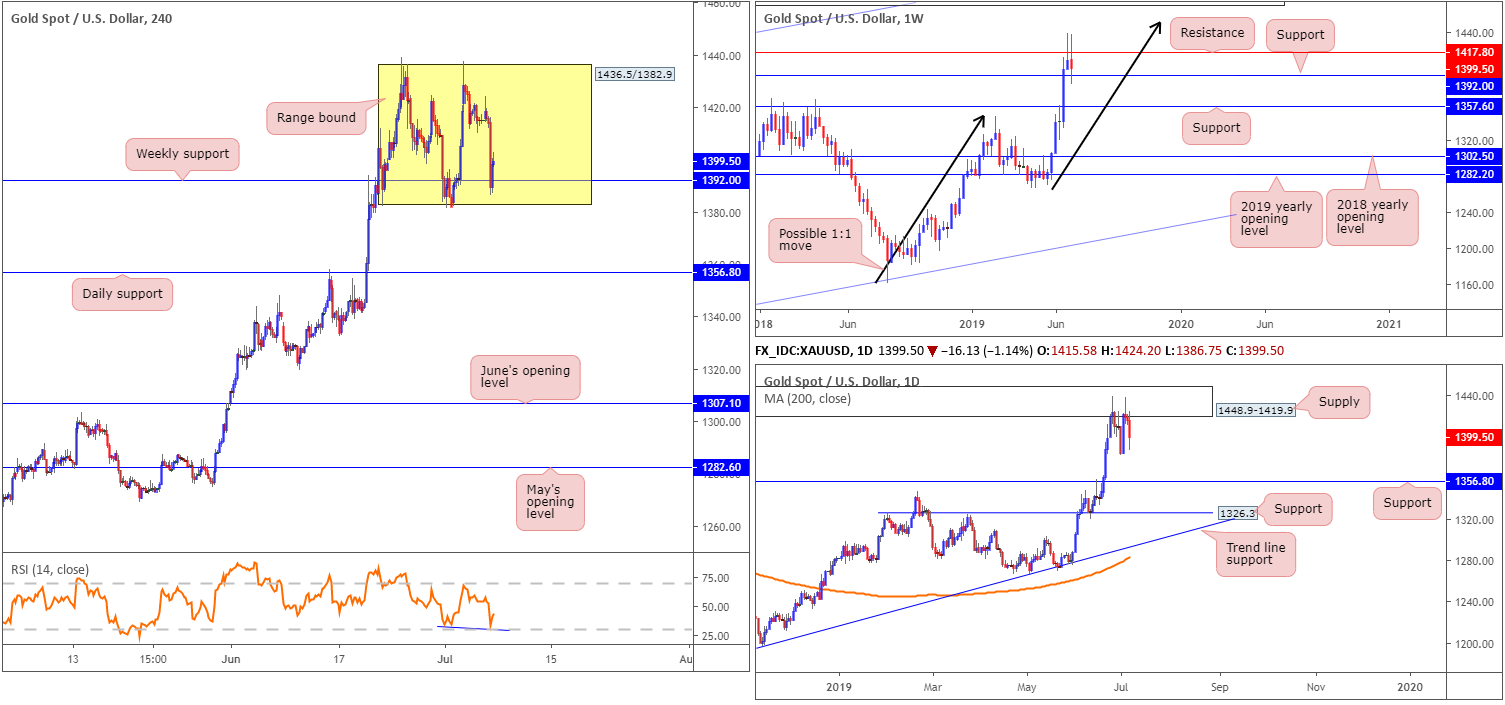
Resistance at 1417.8 held ground again last week, though failed to dethrone nearby support at 1392.0. Further upside from this point could eventually cross paths with a 1:1 correction (black arrows) around 1453.2 shaped from the 1160.3 August 13 low, whereas a move sub 1392.0 has another layer of support in view at 1357.6.
Daily perspective:
The story on the daily timeframe has the candles testing the lower edge of a supply zone at 1448.9-1419.9. Note the weekly resistance level at 1417.8 resides just beneath the said supply zone. And as we already know from the weekly timeframe, support at 1392.0 is proving a troublesome barrier to overcome, but in the event we do push lower daily support is seen around 1356.8.
H4 perspective:
Since June 24, the H4 candles have been busy carving out a consolidation zone between 1436.5/1382.9, with weekly support highlighted above at 1392.0 bolstering the lower edge of the region. It might also be of interest to some traders to note the RSI indicator is seen testing the oversold value and is producing hidden divergence (blue line). Thanks to a dollar bid Friday, consequently weighing on the metal, the H4 candles are seen lurking around the lower edge of the said range as we head into a new week.
Areas of consideration:
Technically, the yellow metal remains entrenched within a strong uptrend at the moment. Structurally, though, weekly price is sandwiched between resistance at 1417.8 and support at 1392.0. Daily price, however, shows room to move lower from supply at 1448.9-1419.9 until reaching support at 1356.8, and the H4 candles are currently ranging.
Today/early week may witness a short-term run higher within the H4 range, though weekly resistance at 1417.8 and also the underside of daily supply at 1419.9 could hamper a test of its upside limit.
In the absence of clearer price action, opting to remain on the sidelines may be the better path to take right now, according to the technical studies presented here.
The accuracy, completeness and timeliness of the information contained on this site cannot be guaranteed. IC Markets does not warranty, guarantee or make any representations, or assume any liability with regard to financial results based on the use of the information in the site.
News, views, opinions, recommendations and other information obtained from sources outside of www.icmarkets.com.au, used in this site are believed to be reliable, but we cannot guarantee their accuracy or completeness. All such information is subject to change at any time without notice. IC Markets assumes no responsibility for the content of any linked site.
The fact that such links may exist does not indicate approval or endorsement of any material contained on any linked site. IC Markets is not liable for any harm caused by the transmission, through accessing the services or information on this site, of a computer virus, or other computer code or programming device that might be used to access, delete, damage, disable, disrupt or otherwise impede in any manner, the operation of the site or of any user’s software, hardware, data or property.


