
Key risk events today:
Limited.
(Previous analysis as well as outside sources – italics).
EUR/USD:
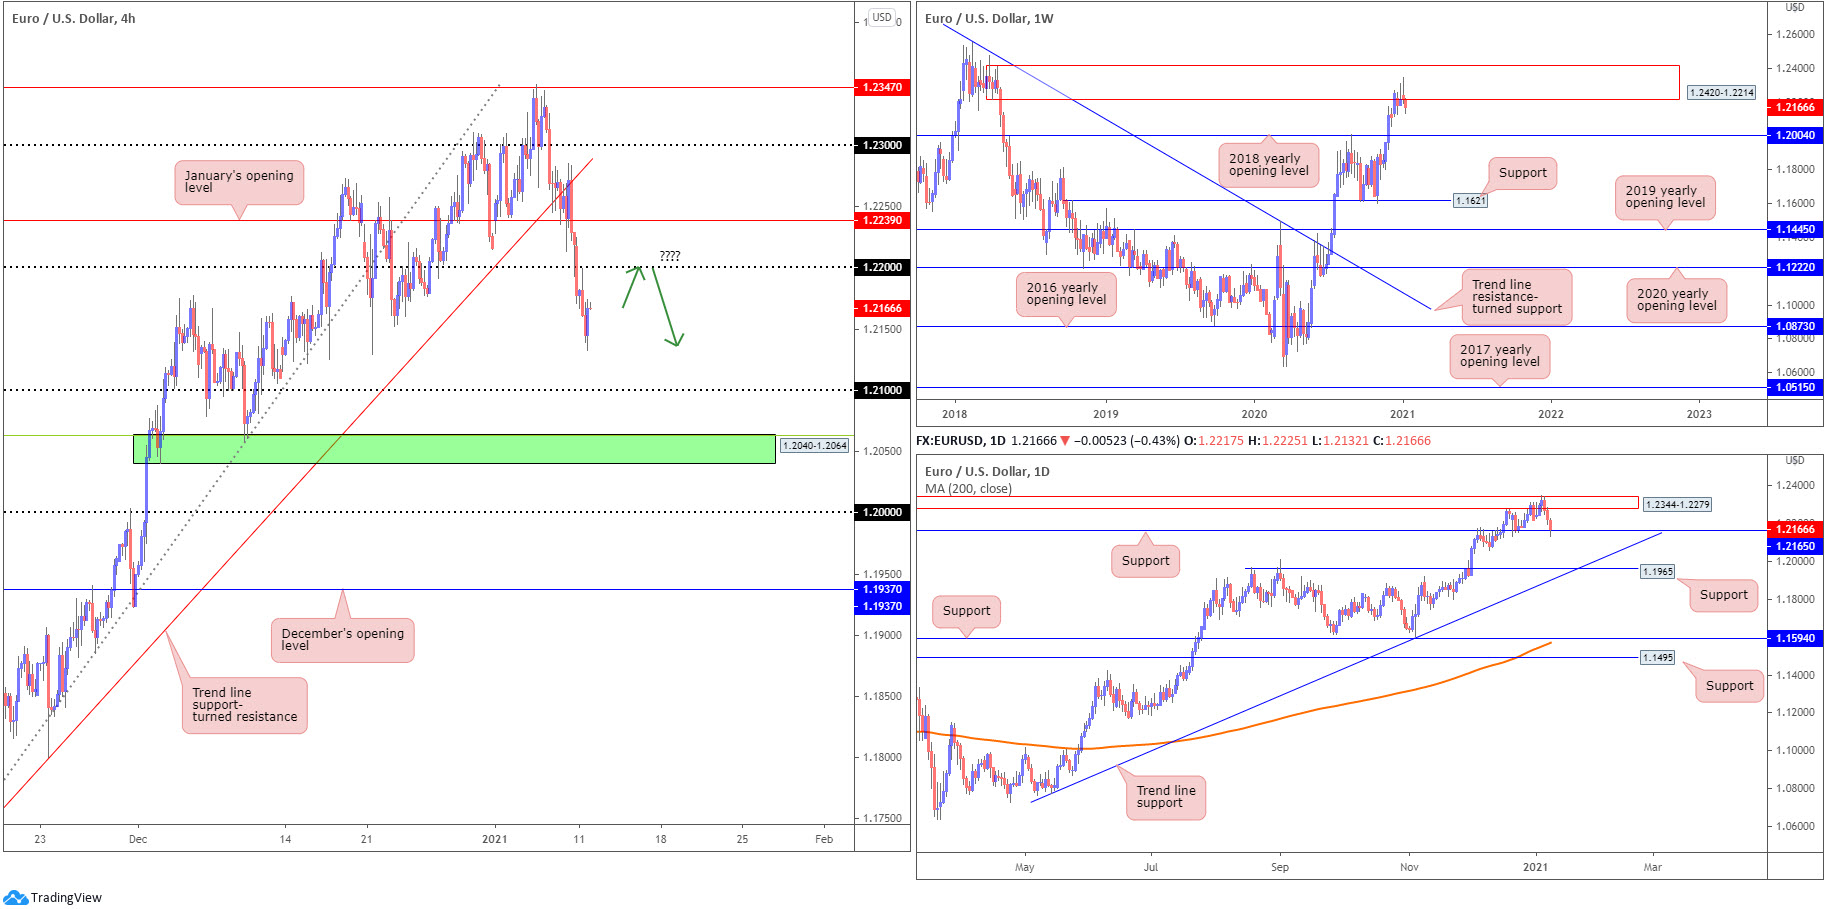
Aided by higher US Treasury yields, the US dollar index extended its bullish position on Monday and touched a high of 90.72. EUR/USD dropped through the 1.22 figure on the H4 scale and rapidly retested the latter as resistance.
Modestly chalking up a recovery from 1.2131 and establishing an outside reversal candle, helped by daily support making an appearance at 1.2165, an additional retest at 1.22 could come about today. To the downside, the 1.21 figure is in view, with a break exposing demand plotted at 1.2040-1.2064 (converges with a 38.2% Fibonacci retracement ratio at 1.2062).
Further out, weekly supply at 1.2420-1.2214 remains central focus, with last week establishing a shooting star pattern off multi-month peaks at 1.2349. Should sellers take the reins, the 2018 yearly opening value at 1.2004 is likely a level downside movement may target. In terms of trend, however, upside remains favoured – more so if price overthrows the 1.2555 February 12 high (2018). The above implies buyers could take the wheel and eventually attempt to overthrow the aforementioned supply zone.
Nestled within the walls of weekly supply mentioned above at 1.2420-1.2214 is a daily supply base coming in at 1.2344-1.2279, which capped upside and guided the pair to daily support mentioned above at 1.2165. A break of this boundary not only lays the basis for further selling to another support at 1.1965 (and trend line support, taken from the low 1.0774), a bearish move would also add conviction to the weekly timeframe’s recent shooting star to weekly support at 1.2004 (sited just above 1.1965 daily support).
Areas of consideration:
- Longer term, although the trend has faced an upward trajectory since early 2020, weekly price displays signs of weakness within supply at 1.2420-1.2214, in the shape of a shooting star.
- With the above point taken on board, the break beneath 1.22 (H4) helps confirm the weekly timeframe’s position and implies the unit could be headed for at least 1.21. Therefore, a retest at 1.22 could prove interesting for sellers today.
GBP/USD:
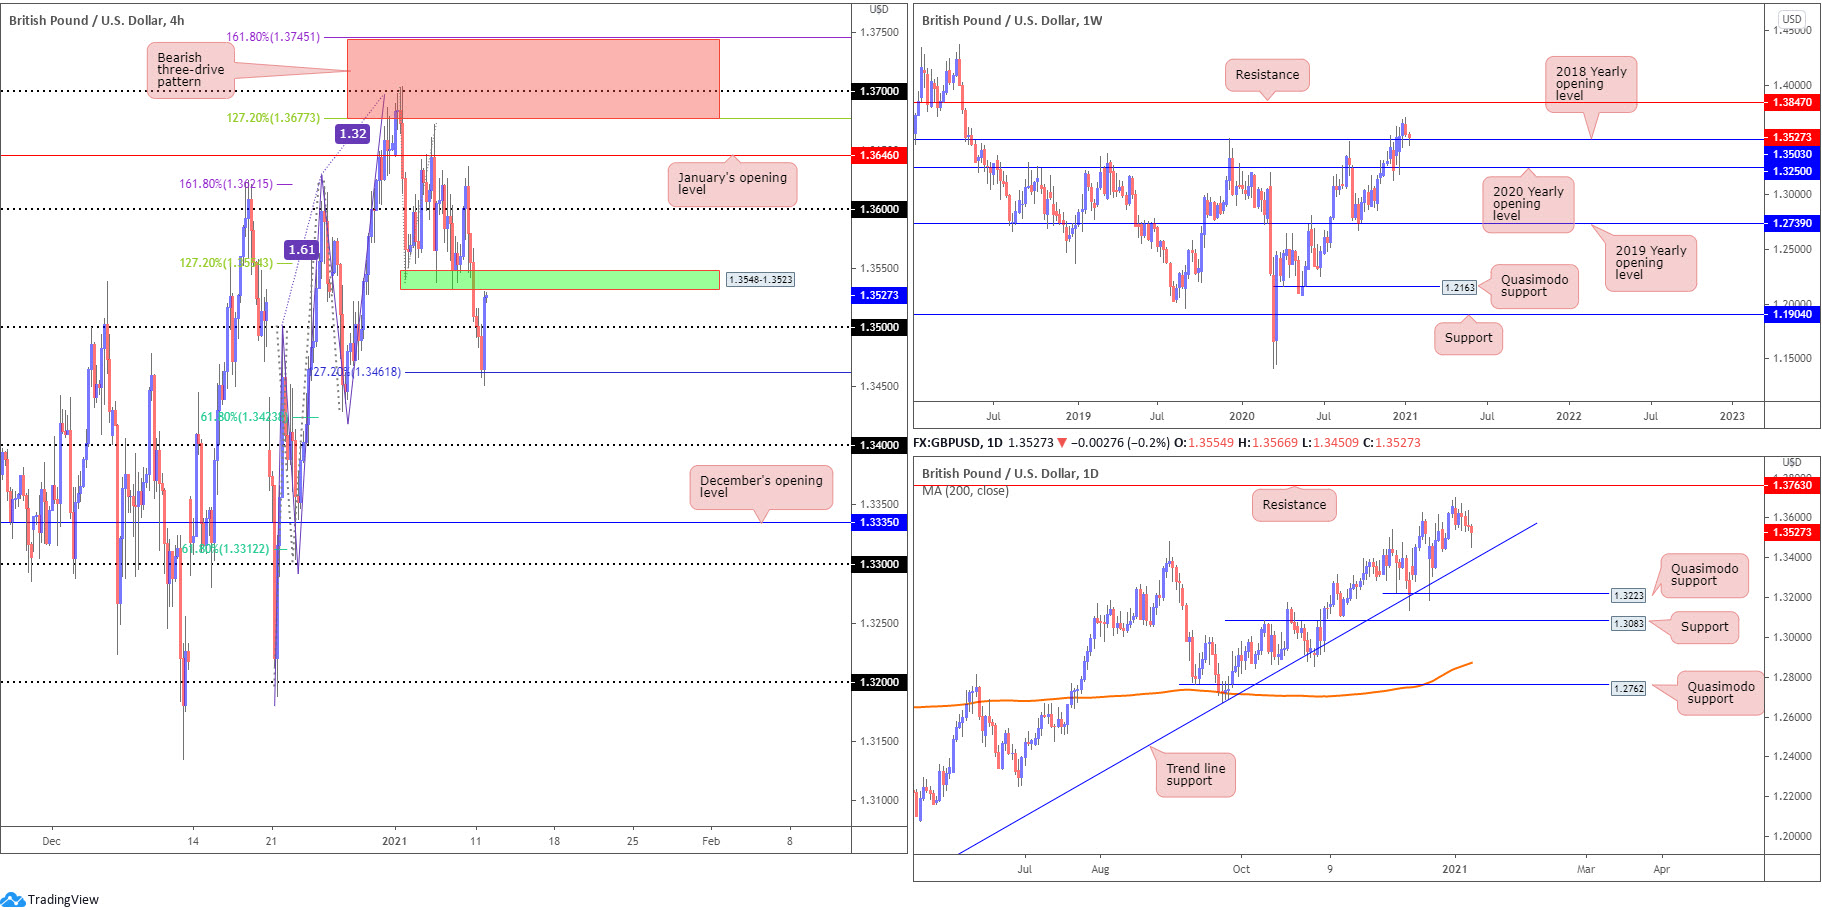
From the weekly timeframe, traders will see GBP/USD shook hands with the 2018 yearly opening value at 1.3503 on Monday, a level that potentially highlights support. To the upside, resistance at 1.3847 is on the radar. Also of technical interest is a recent engulf of 1.3514 (December 9 [2019] high), helping to confirm the current uptrend in play since early 2020.
The technical landscape from the daily timeframe saw lows printed within striking distance of trend line support, etched from the low 1.1409, on Monday. The only other nearby barrier of note on this scale resides at 1.3763 resistance, a previous Quasimodo support level.
Across the page on the H4 scale, Monday rebounded from a 127.2% Fibonacci extension point at 1.3461 and reclaimed 1.35+ status. Possible resistance can be seen around 1.3548-1.3523 (green), with a break exposing the 1.36 figure.
Areas of consideration:
- Weekly support at 1.3503 making an appearance Monday could fuel H4 buyers to maintain position north of 1.35 and possibly attack H4 resistance around 1.3548-1.3523 to approach 1.36. This is also in line with the current uptrend.
AUD/USD:
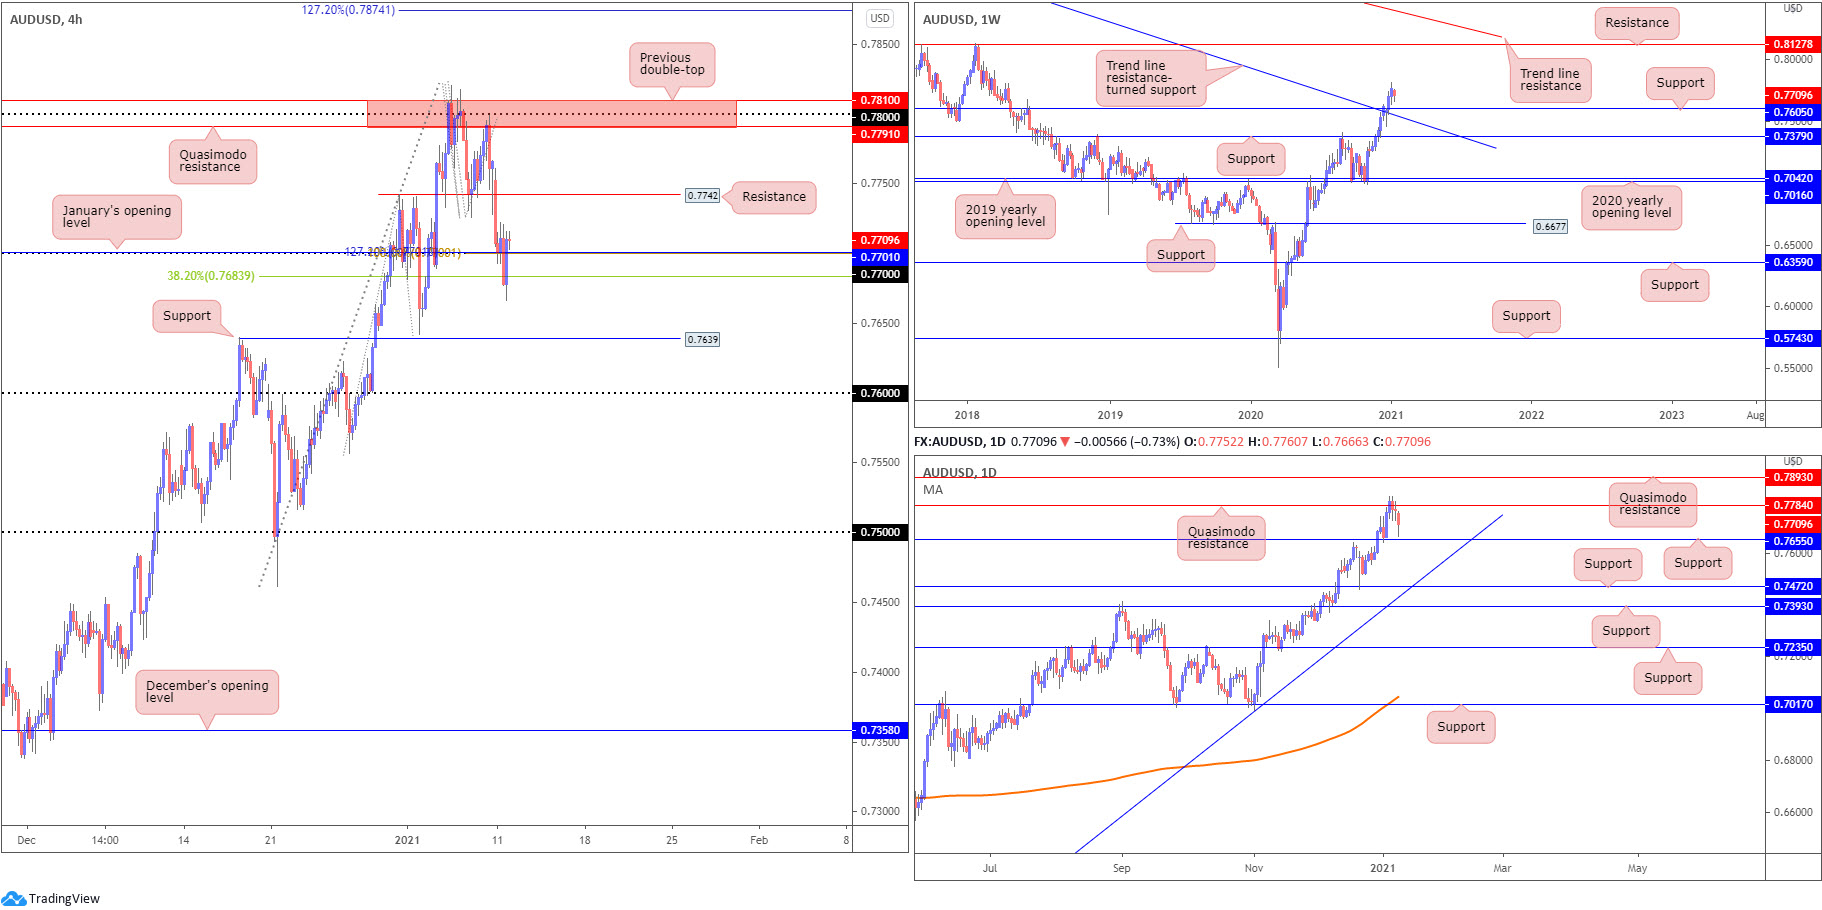
AUD/USD opened strongly to the downside on Monday, engulfing H4 support priced in at 0.7742 and ultimately crossing swords with the 0.77 figure. Aided by additional Fibonacci support between 0.7683 and 0.7700, the pair received some mild respite, with H4 currently loitering a touch above 0.77. 0.7742 represents possible resistance while beneath 0.77 we can see support residing around 0.7639.
Out of the weekly chart, AUD/USD is seen mildly fading 30-month highs at 0.7820, a few inches north of 0.7605, a previous Quasimodo resistance that merges closely with trend line resistance-turned support, taken from the high 1.1065. This places buyers in a strong position with room to possibly reach as far north as resistance coming in at 0.8127.
From the daily chart, the pair is visibly extending its corrective slide from Quasimodo resistance at 0.7784. Should sellers intensify their position, chart studies indicate support at 0.7655 could make an appearance. Be that as it may, an advance beyond 0.7784 also shines the technical spotlight on a Quasimodo resistance at 0.7893.
Areas of consideration:
- 0.77 and associated H4 Fibonacci studies between 0.7683 and 0.7700. Though do be aware, aside from the current uptrend there is limited higher timeframe support seen around 0.77.
- H4 support at 0.7639 merges closely with daily support at 0.7655.
- The 0.76 figure closely coincides with weekly support at 0.7605.
USD/JPY:
For those who read Monday’s technical briefing you may recall the following (italics):
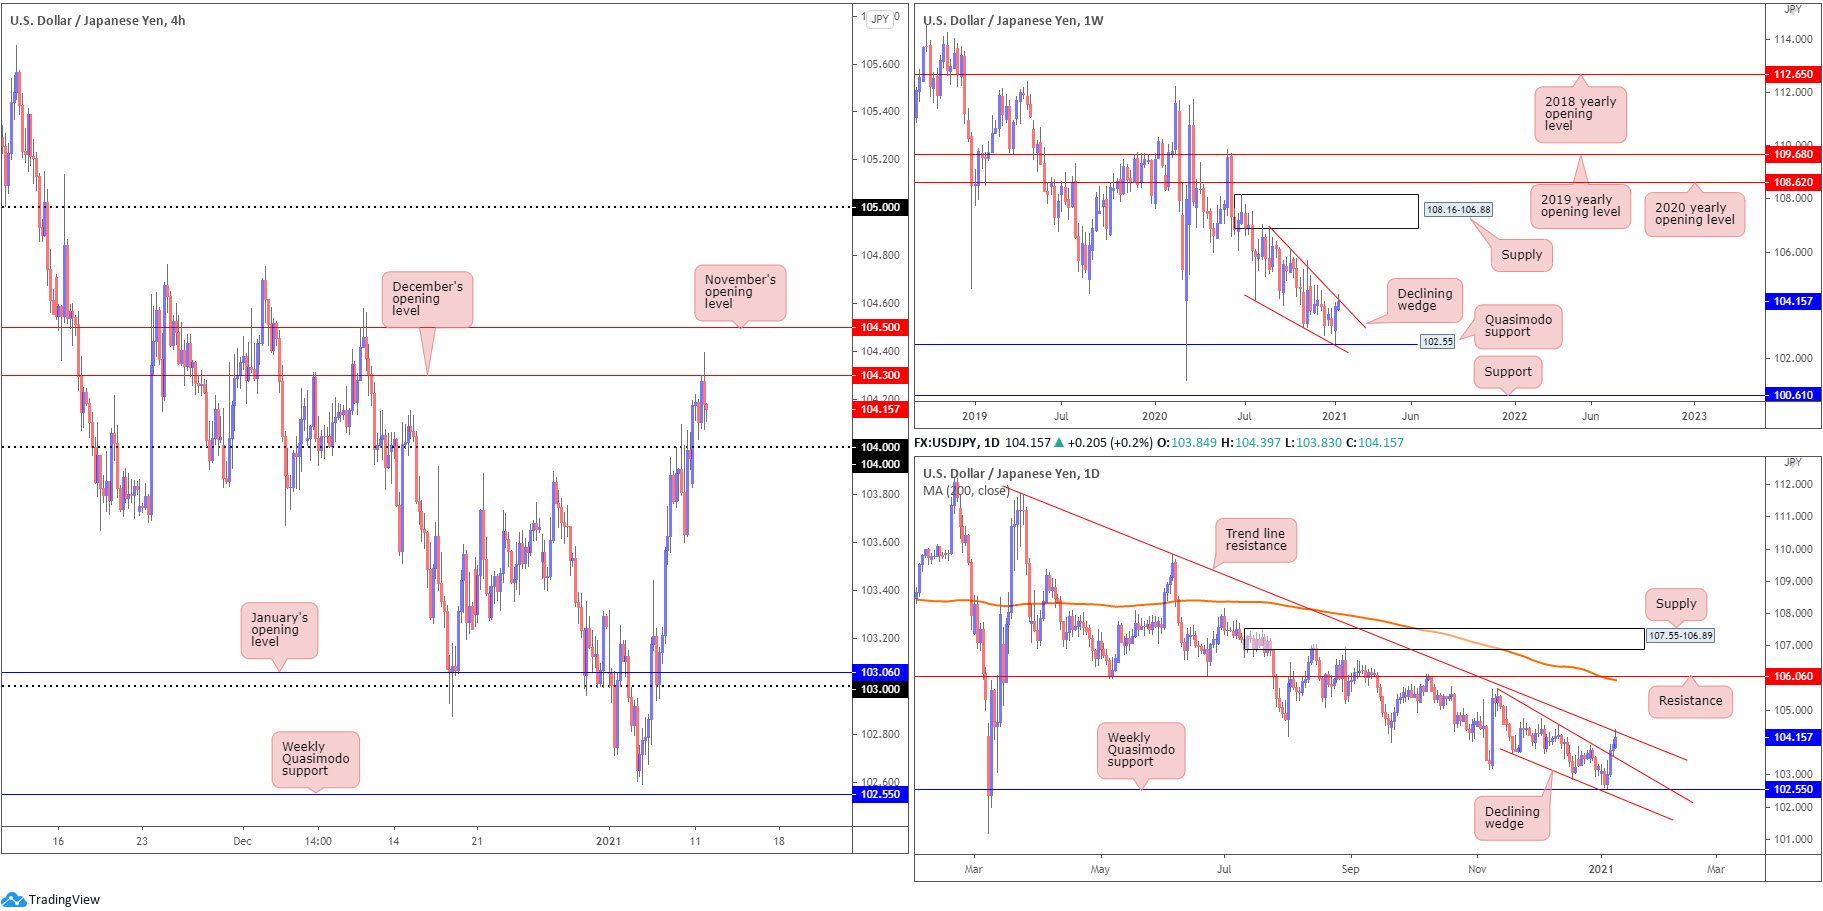
The break of the daily declining wedge could spark follow-through buying to daily trend line resistance this week, a descending level aligning closely with not only December’s opening value at 104.30 on the H4, but also the upper edge of the weekly declining wedge pattern.
As evident from the charts, amidst broad-based USD strength, H4 overthrew 104 and punched into December’s opening value at 104.30 on Monday. This, as briefly touched on above, converges with daily trend line resistance, extended from the high 111.71, and also the upper edge of a weekly declining wedge pattern, taken from the high 106.94.
The joining of three resistance points from the H4, daily and weekly timeframes, along with a market that’s been trending lower since March 2020, is likely to catch the attention of sellers.
Areas of consideration:
- Bolstered by higher timeframe resistances, a bearish scenario could emerge off November’s opening value at 104.30 on the H4 today, and further selling may develop should a H4 close sub 104 take shape.
XAU/USD (GOLD):
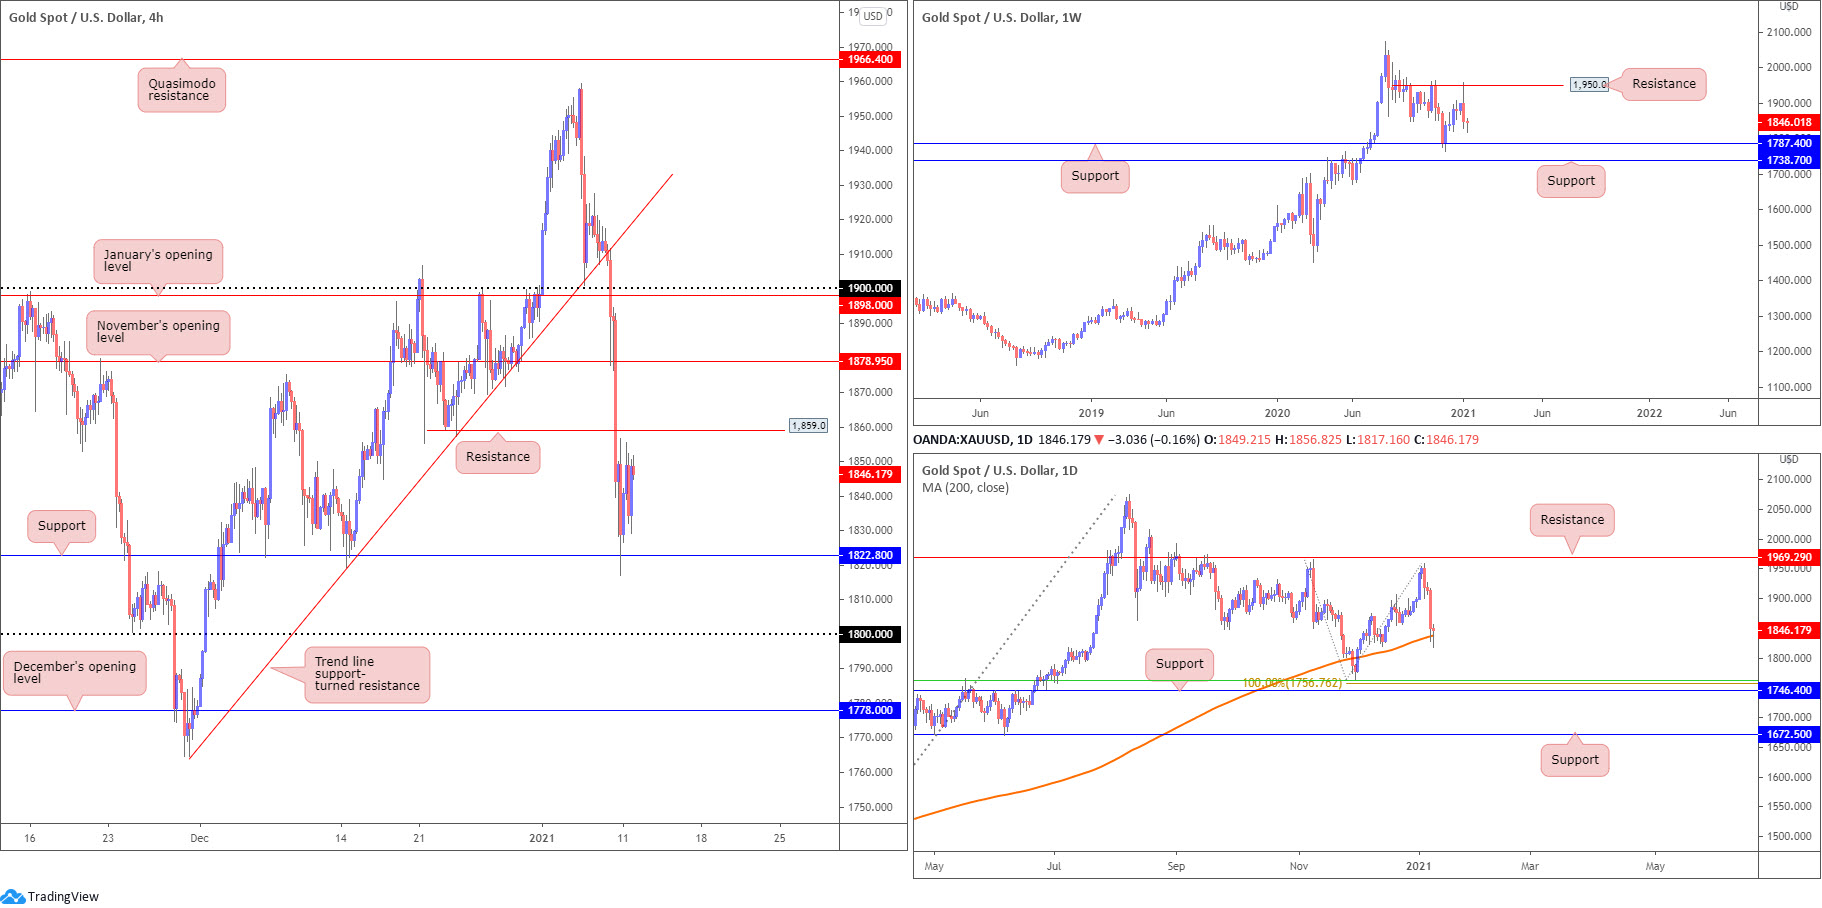
The price of gold plunged into H4 support at $1,822 on Monday and firmly rebounded. H4 resistance at $1,859 stands nearby, and a break above the base could have the metal approach November’s opening value from $1,878.
The above, of course, is bolstered by the 200-day SMA (orange – $1,837). The other side of the field, however, reveals weekly price recently rebounded from the underside of resistance at $1,950. Should sellers strengthen their grip, support at $1,787 could play a leading role, a level plotted just north of another layer of support at $1,738. Also clear on the weekly timeframe is that although the recent sell-off may have triggered short-term interest to the downside, it is worth noting that in terms of trend we’ve been higher since early 2016.
Areas of consideration:
- Weekly resistance at $1,950 suggests sellers want to keep things lower, potentially at least until weekly support enters the fight at $1,787. The concern for sellers, nevertheless, is the test of the 200-day SMA and, of course, the prevailing uptrend.
- A H4 close above H4 resistance from $1,859 could tempt a bullish theme towards November’s opening value at $1,878.
- December’s opening value at $1,778 on the H4 (although unlikely to be tested today) is also interesting as it forms a connection with weekly support at $1,787.
The accuracy, completeness and timeliness of the information contained on this site cannot be guaranteed. IC Markets does not warranty, guarantee or make any representations, or assume any liability regarding financial results based on the use of the information in the site.
News, views, opinions, recommendations and other information obtained from sources outside of www.icmarkets.com.au, used in this site are believed to be reliable, but we cannot guarantee their accuracy or completeness. All such information is subject to change at any time without notice. IC Markets assumes no responsibility for the content of any linked site.
The fact that such links may exist does not indicate approval or endorsement of any material contained on any linked site. IC Markets is not liable for any harm caused by the transmission, through accessing the services or information on this site, of a computer virus, or other computer code or programming device that might be used to access, delete, damage, disable, disrupt or otherwise impede in any manner, the operation of the site or of any user’s software, hardware, data or property.