Key risk events today:
UK Retail Sales m/m; BoE Credit Conditions Survey; G7 Meetings; Philly Fed Manufacturing Index; FOMC Member Williams Speaks.
EUR/USD:
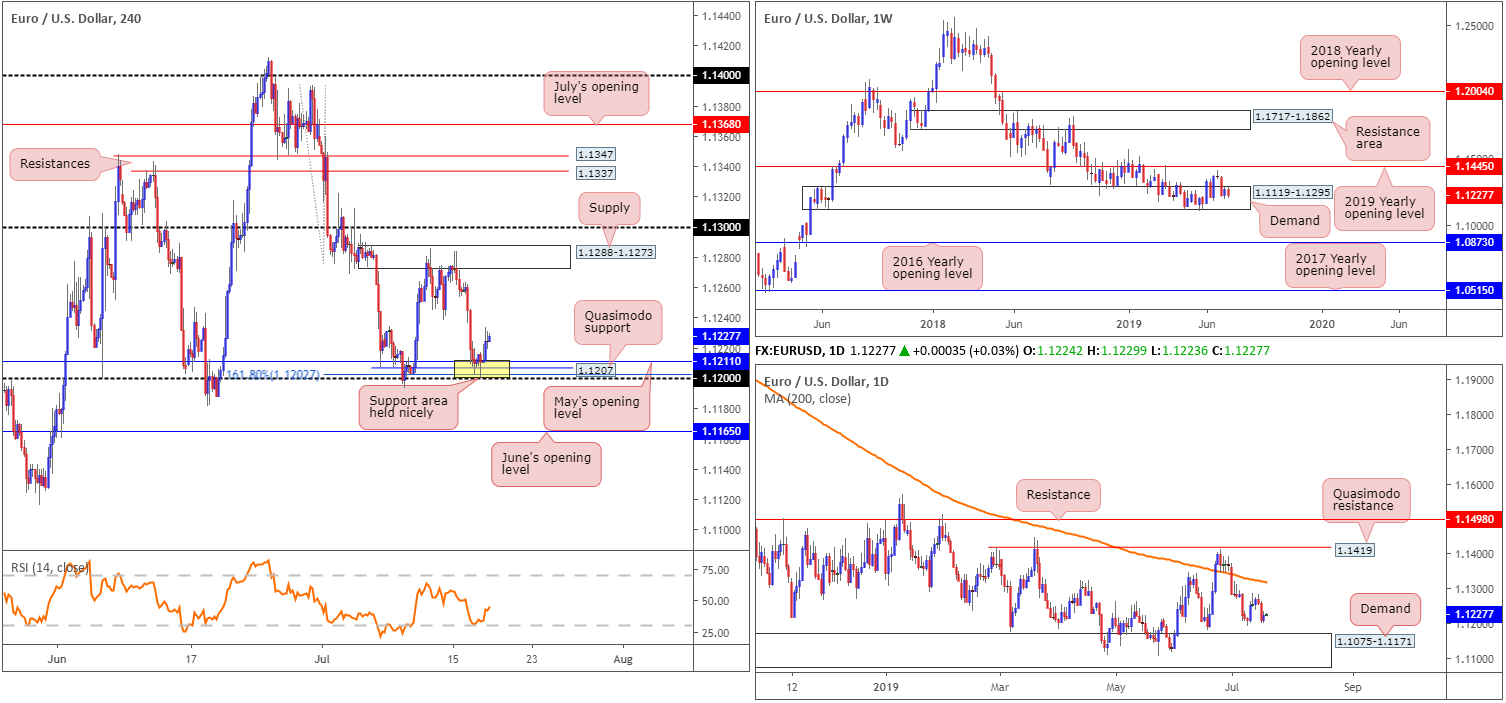
The dollar recoiled Wednesday after achieving strong gains on Tuesday following better-than-expected monthly retail sales data. Europe’s single currency, on the other hand, challenged H4 support between 1.12/1.1211 (comprised of the 1.12 handle, the 161.8% Fibonacci ext. point at 1.1202, a Quasimodo support at 1.1207 and May’s opening level at 1.1211) in recent sessions and posted a modest recovery.
Though technically sound in terms of H4 confluence, 1.12/1.1211 also witnessed H4 price chalk up a hammer Japanese candlestick formation that clipped 1.12. Considered a bullish signal amongst the technical community, this likely encouraged buyers yesterday.
The landscape on the higher timeframes shows weekly price trading within the parapets of a long-standing demand area at 1.1119-1.1295 since November 2018. Upside momentum remains brittle, however, with the unit unable to dethrone resistance by way of the 2019 yearly opening level at 1.1445, and in some cases even lacking the ‘oomph’ to reach the said resistance.
A closer reading of price action on the daily timeframe shows the unit hovering just north of demand seen at 1.1075-1.1171 (glued to the lower edge of the current weekly demand). Interestingly, the top edge of the daily demand (1.1171) aligns with June’s opening level on the H4 timeframe at 1.1165 (the next downside target beyond the current H4 support area at 1.12/1.1211).
Areas of consideration:
The possibility of further upside developing is certainly there today, targeting H4 supply at 1.1288-1.1273, closely shadowed by the 1.13 handle. Well done to any of our readers who managed to jump aboard the H4 support area at 1.12/1.1211.
In the event the EUR/USD turns lower, nonetheless, June’s opening level at 1.1165 is considered the next area of interest for long opportunities on the H4 scale. As underlined above, the barrier merges with the top edge of daily demand at 1.1171. To help avoid falling victim to fakeouts (or sometimes referred to as stop runs), traders are urged to consider waiting for additional candlestick confirmation before pulling the trigger. This helps identify buyer intent and provides entry and risk levels to work with.
GBP/USD:
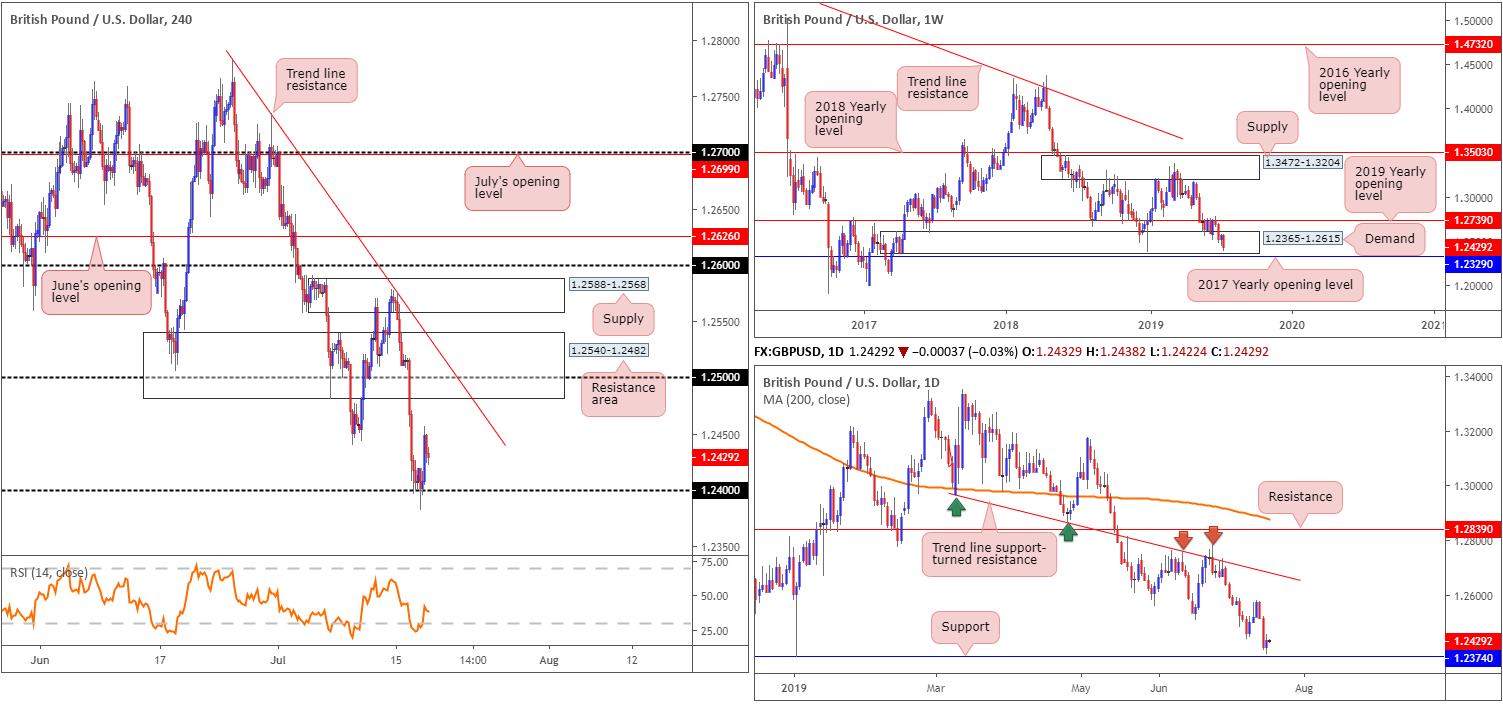
The British pound, having tested a session low of 1.2382, reclaimed 1.24+ status in the wake of a subdued dollar Wednesday. Many desks, however, have been highlighting continued downside risk for sterling as a no-deal Brexit re-enters the limelight, and maintain a view this is a sellers’ market.
In terms of Wednesday’s data out of the UK, the CPI 12-month rate was 2.0% in June 2019, unchanged from May 2019, while PPI registered -1.4% vs. expected -1.0%.
With respect to the technical picture on the H4 timeframe, scope for further buying is visible until reaching a resistance area at 1.2540-1.2482, which happens to encapsulate the 1.25 handle and intersect with a trend line resistance extended from the high 1.2783.
The story on the bigger picture positions the daily candles within striking distance of support at 1.2374, though price found a floor of support just ahead of the base yesterday. Note the long-term level helped cap downside at the beginning of the year in the shape of a large hammer candlestick formation. Weekly movement, nonetheless, remains treading water within the lower limits of demand at 1.2365-1.2615. A break of this area will, almost immediately, shake hands with support placed at 1.2329: the 2017 yearly opening level.
Areas of consideration:
Continued buying will likely bring in the H4 resistance area mentioned above at 1.2540-1.2482. This area – coupled with trend line resistance and round number 1.25 – is likely enough to tempt selling. Given the overall size of the range, though, traders may want to consider waiting and seeing if H4 price forms a Japanese bearish candlestick signal and enter based off this structure. Pay particular attention to the round number 1.25 as psychological figures regularly harbour orders. As for downside targets, 1.24 appears a logical approach, followed by daily support at 1.2374.
AUD/USD:
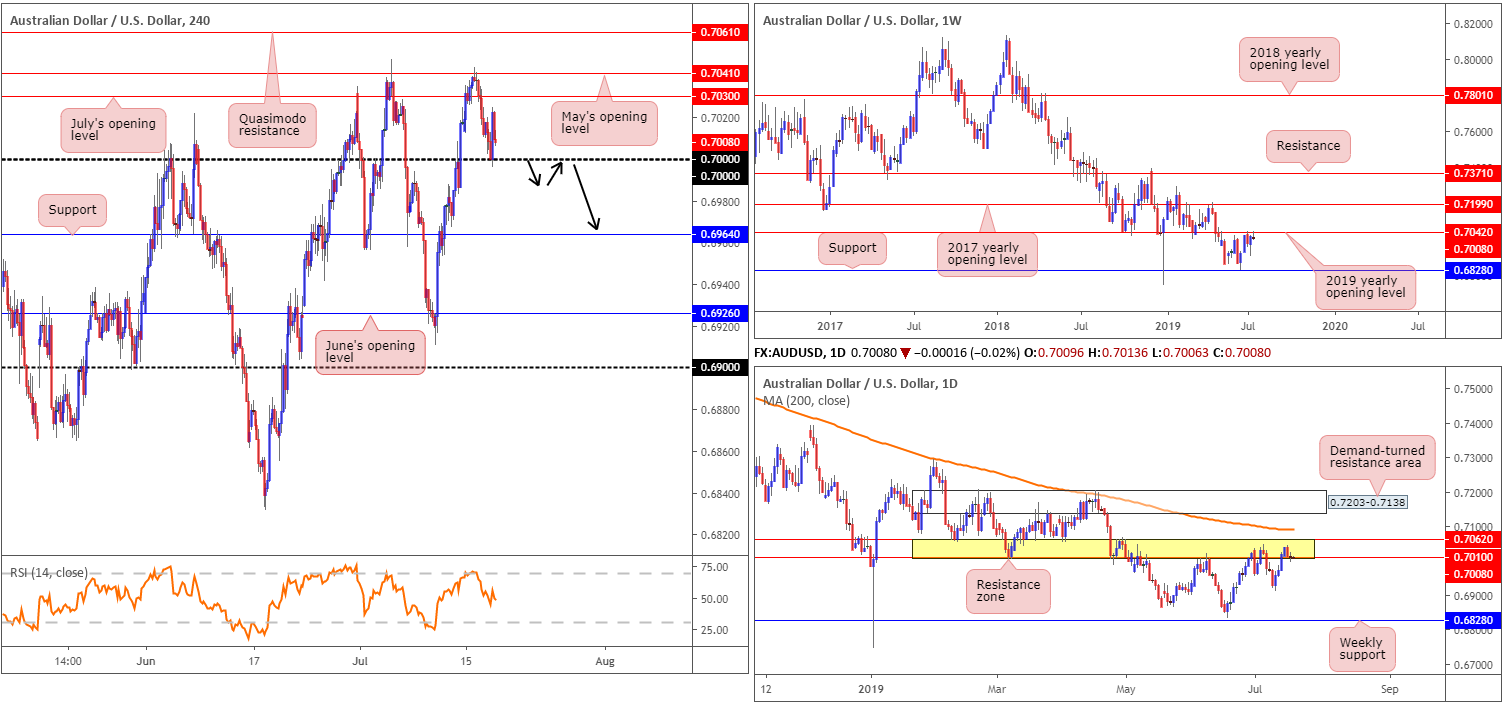
Strengthened on the back of a declining dollar, the Australian dollar found support off the key figure 0.70 on the H4 timeframe amid US opening hours Wednesday, though failed to shake hands with July’s opening level at 0.7030. Beyond 0.70, traders may wish to acknowledge support coming in at 0.6964, which boasts reasonably strong historical significance.
Against the backdrop of medium-term flows, similar to previous reports, higher-timeframe structure reveals weekly price shook hands with resistance at 0.7042 and is holding ground: the 2019 yearly opening level. In conjunction with weekly movement, daily activity produced a bearish engulfing candlestick pattern Tuesday within the confines of a resistance area at 0.7062/0.7010, though failed to produce much follow-through selling yesterday.
Areas of consideration:
Outlook unchanged.
Having noted weekly resistance at 0.7042 enter the fold and daily price engaging with a resistance area at 0.7062/0.7010, additional selling could still be in store. The only downside to selling at current price is H4 action respecting 0.70, a key support by and of itself. To help overcome this, traders may want to consider waiting and seeing if the unit engulfs 0.70 today, as this not only confirms seller intent on the higher timeframes it also likely clears the path south to at least H4 support at 0.6964.
An ideal scenario would be for H4 price to retest 0.70 as resistance following the break lower (entry and risk levels can be determined according to the rejection candlestick’s structure).
USD/JPY:
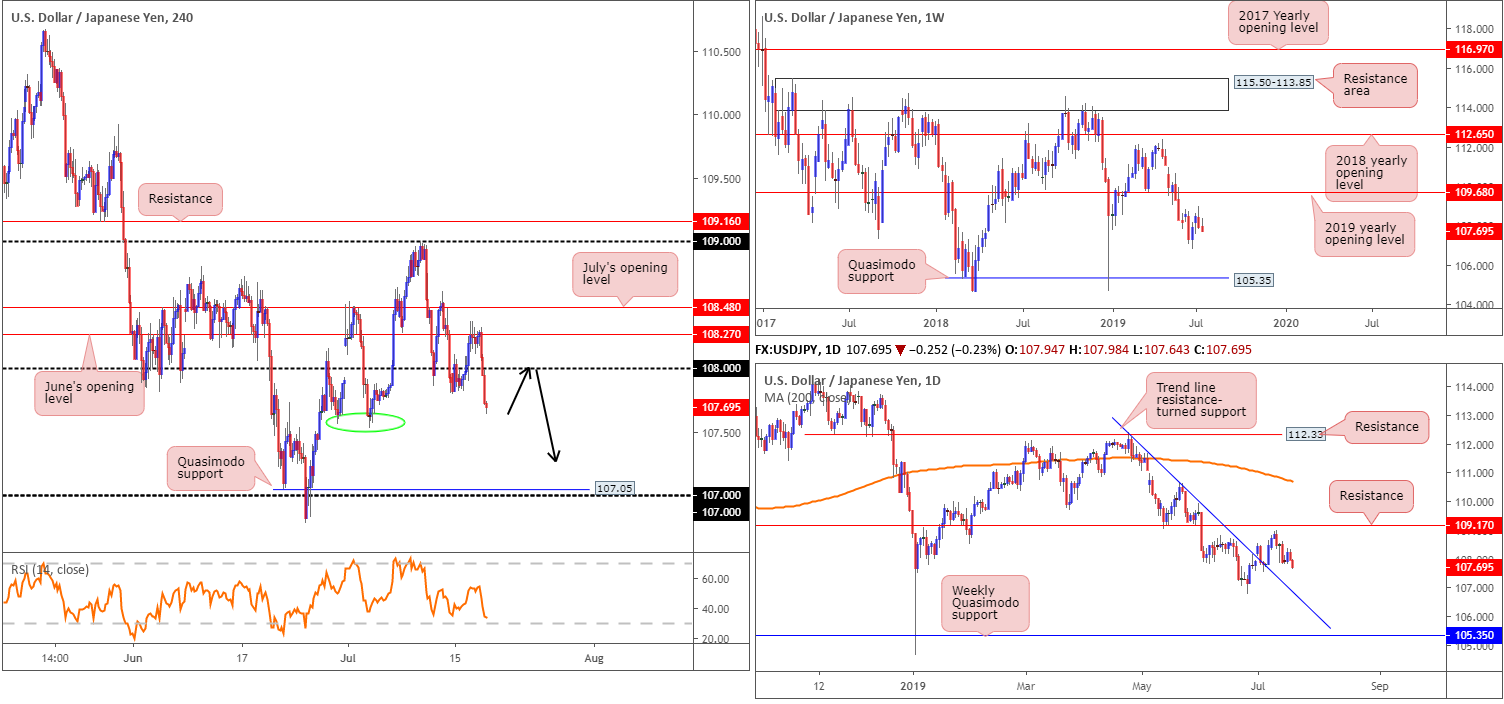
A risk-off ‘feel’ to markets Wednesday kept havens bid, with the Japanese yen advancing 0.27% vs. the dollar. The USD/JPY found a ‘ceiling’ off June’s opening level at 108.27 on the H4 timeframe and in recent hours overthrew 108 to the downside. Aside from possible support emerging from 107.58 (green circle), the unit exhibits scope to press as far south as Quasimodo support located just north of 107 at 107.05. Indicator-based traders may also find use in noting the RSI is heading for oversold waters as of current price.
With the above taken into account, our technical studies show the following on the higher timeframes:
From the weekly timeframe:
Breaking a two-week bullish phase, the US dollar rotated lower against the Japanese yen last week, engulfing the preceding candlestick’s body and erasing more than 55 points. According to technical structure on the weekly timeframe, resistance is set by way of the 2019 yearly opening level at 109.68 and support is not expected to emerge until reaching a Quasimodo formation at 105.35.
Daily timeframe:
Mid-week trading observed the USD/JPY decline in value, leaving resistance at 109.17 unchallenged. The next port of call, in terms of support, can be seen in the form of a trend line resistance-turned support (extended from the high 112.40). Beyond here, the 106.78 June 25 low is seen, followed then by the weekly Quasimodo support mentioned above 105.35.
Areas of consideration:
Downside, according to the technical studies presented above, may be on the menu. Selling at current price on the H4 timeframe, considering we’re within close proximity of potential support at 107.58 (green circle), is a chancy move however.
In the event we retest 108 as resistance, this could be a platform worth considering for shorts, though waiting for additional candlestick confirmation is advised given stop runs are common viewing around said psychological numbers. Should the market continue to selloff, nonetheless, traders could look to short on the breakout of 107.58, or conservatively wait and see if a retest occurs and trade based on the rejecting candle’s structure.
USD/CAD:
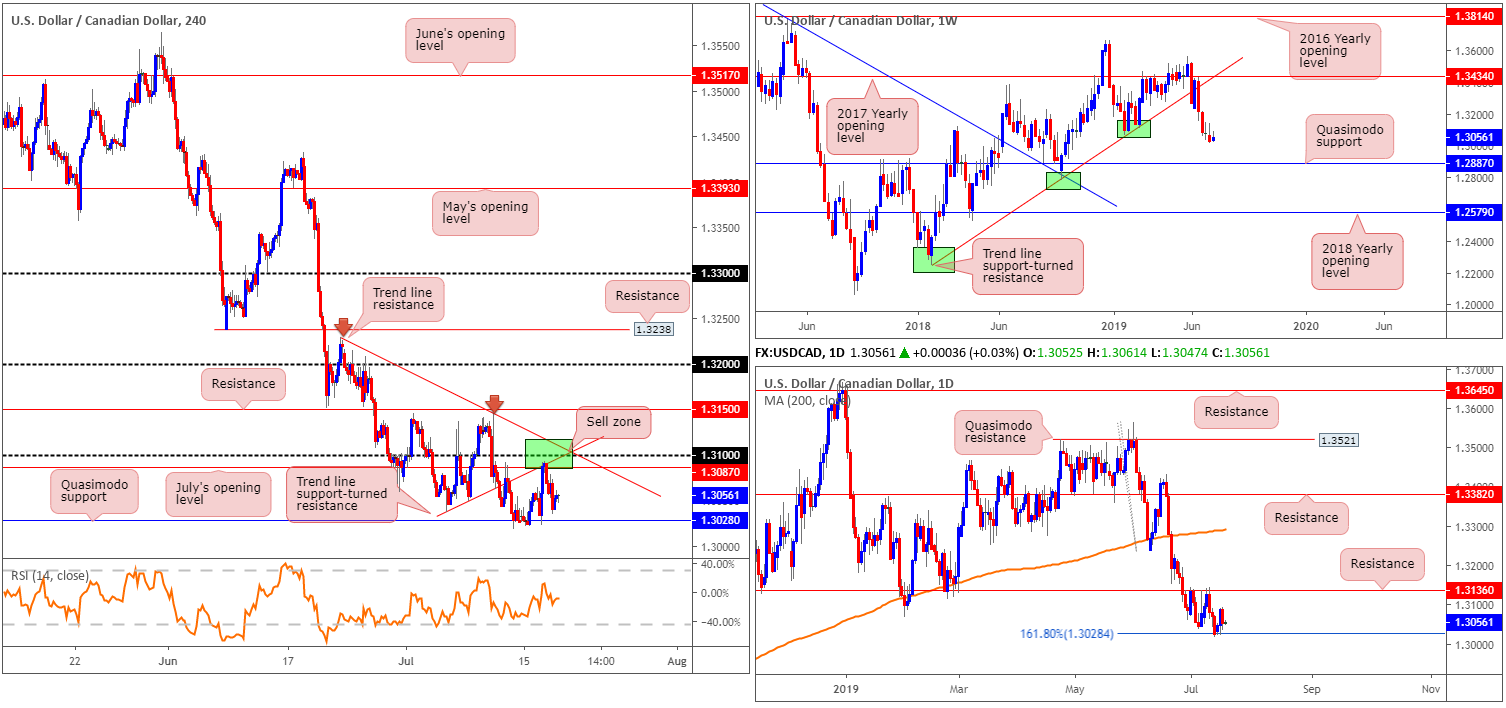
For those who read Wednesday’s briefing you may recall the piece highlighted the range between trend line resistance (1.3229) and July’s opening level at 1.3087 on the H4 timeframe (green) as a potential sell zone. Included within this area is the round number 1.31 and a trend line support-turned resistance taken from the low 1.3037. Well done to any of our readers who managed to jump aboard this move! The next downside target in view is Quasimodo support at 1.3028, which happens to align with a 161.8% Fibonacci ext. point on the daily timeframe.
What is also notable from a technical perspective is weekly price suggesting further selling could be on the cards, given limited support is visible until connecting with Quasimodo support at 1.2887.
Areas of consideration:
Ultimately, the research team have eyes on a move beneath the H4 Quasimodo support underlined above at 1.3028, with a final downside target set at the weekly Quasimodo support drawn from 1.2887. So, aside from the shorts currently in play from the H4 sell zone discussed above in green, a decisive H4 close beneath 1.3028 is eyed. A H4 close beneath here that’s followed up with a successful retest will likely be enough to encourage further downside. As for entry, traders can base entry and risk levels on the rejecting candle’s structure – of course this would be ideal if the rejecting candle formed by way of a Japanese candlestick formation.
USD/CHF:
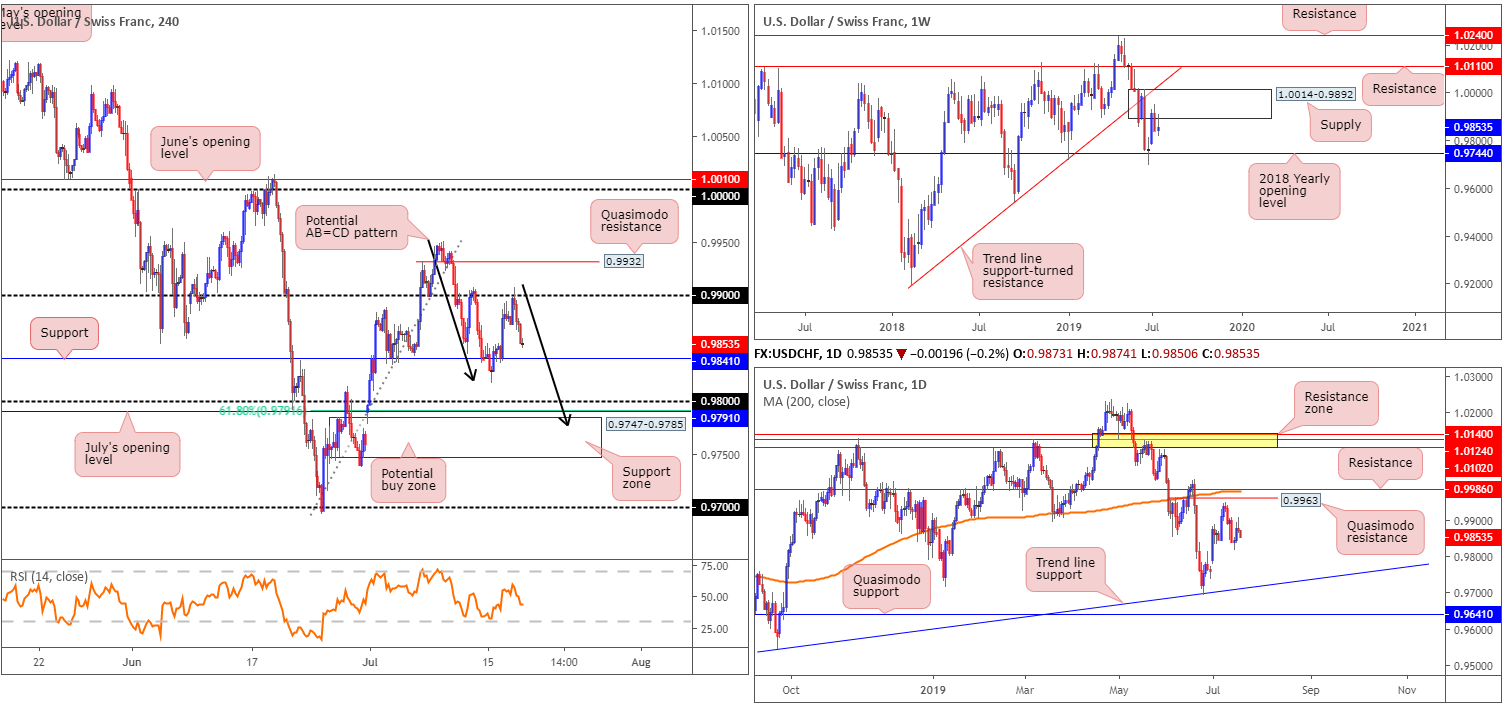
Broad-based dollar selling emerged Wednesday, consequently towing the USD/CHF lower from its 0.99 handle on the H4 timeframe. The pair concluded just north of support at 0.9841. While this level could hold price action higher, the more appealing zone resides around the 0.98 handle. Closely trailed by July’s opening level at 0.9791, a 61.8% Fibonacci retracement value a support zone at 0.9747-0.9785 and a possible AB=CD correction point (black arrows) at 0.9777, this area offers strong local confluence for a move higher.
Higher up on the curve, we have weekly flow selling off from supply at 1.0014-0.9892 after shaking hands with the base two weeks ago. While this could lead to a revisit of 0.9744: the next downside target, traders may also find use in noting the trend line support-turned resistance (extended from the low 0.9187), closely followed by resistance at 1.0110, should we turn higher.
Closer examination of price action on the daily timeframe shows the unit hovering south of Quasimodo resistance at 0.9963, followed closely by resistance at 0.9986 and the 200-day SMA (orange). To the downside, however, limited support is in view until reaching trend line support taken from the low 0.9542.
Areas of consideration:
Longer-term flow remains unchanged and suggests selling could still be in store from weekly supply at 1.0014-0.9892.
Medium-term flow, also unchanged in terms of tradable zones, has eyes on the 0.98 region (given its surrounding confluence highlighted above) for potential longs. However, traders interested in buying 0.98 are also urged to take into account we could witness a fakeout into 0.9747-0.9785 before rotating higher. Stop-loss placement, therefore, is best positioned beneath this zone at 0.9747.
The accuracy, completeness and timeliness of the information contained on this site cannot be guaranteed. IC Markets does not warranty, guarantee or make any representations, or assume any liability with regard to financial results based on the use of the information in the site.
News, views, opinions, recommendations and other information obtained from sources outside of www.icmarkets.com.au, used in this site are believed to be reliable, but we cannot guarantee their accuracy or completeness. All such information is subject to change at any time without notice. IC Markets assumes no responsibility for the content of any linked site.
The fact that such links may exist does not indicate approval or endorsement of any material contained on any linked site. IC Markets is not liable for any harm caused by the transmission, through accessing the services or information on this site, of a computer virus, or other computer code or programming device that might be used to access, delete, damage, disable, disrupt or otherwise impede in any manner, the operation of the site or of any user’s software, hardware, data or property.