
Key risk events today:
Eurogroup Meetings; Crude Oil Inventories; US JOLTS Job Openings; Fed Chair Powell Speaks; FOMC Member George Speaks; FOMC Meeting Minutes.
EUR/USD:
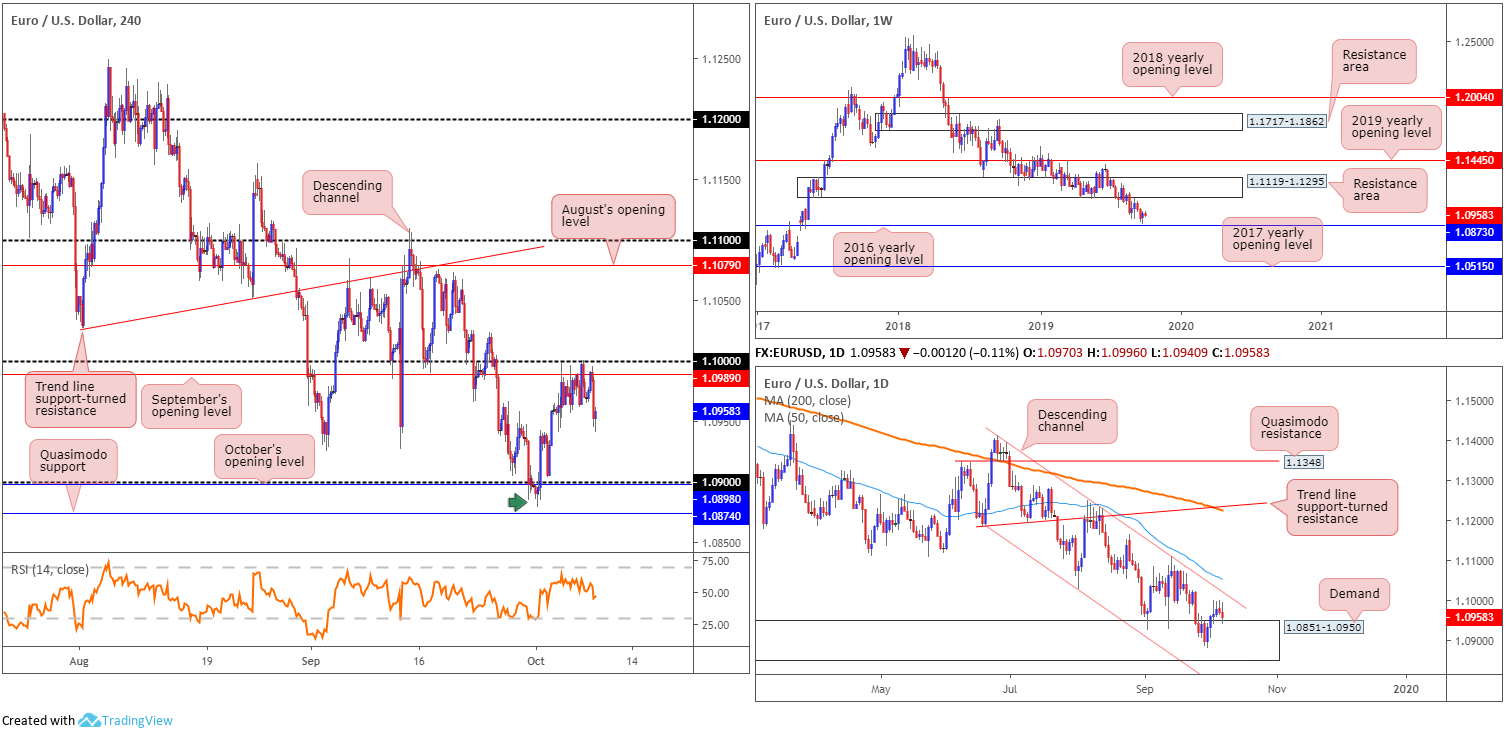
Tuesday had the single currency lower against the US dollar amid broad risk aversion. The US dollar index, or ‘DXY’, toppled its 99.00 threshold despite noticeably weaker-than-consensus US PPI data. Leaving 1.10 unchallenged, the H4 candles found resistance off September’s opening level at 1.0989, guiding the EUR/USD to a session low of 1.0940 on the day. Support targets to be aware of are the 1.09 handle and October’s opening level at 1.0898, closely shadowed by a Quasimodo formation at 1.0874.
On a wider perspective, daily movement appears to be struggling to preserve an upside bias out of demand at 1.0851-1.0950 – formed April 2017 – so far unable to test channel resistance (extended from the high 1.1412). What’s interesting from a technical perspective is the 2016 yearly opening level at 1.0873 – a notable weekly support/resistance line – is housed within the lower bounds of the said daily zone.
Areas of consideration:
In the event the market continues to explore lower ground today, a retest of 1.09 may be in store. The H4 Quasimodo support at 1.0874, nonetheless, is the interesting level, due to its connection with weekly support at 1.0873: the 2016 yearly opening level. With that being the case, a whipsaw through 1.09 – a move that would trip stops not only beneath the psychological number, but also the 1.0879 October 1 low (green arrow) – to 1.0874 is considered a high-probability trade. A test of 1.0874, coupled with a H4 close back above 1.09 to confirm buyer intent, would likely entice buyers into the market (protective stop-loss orders can be placed either beyond the breakout candle’s lower shadow or beneath 1.0874).
Should a move above 1.10 materialise, however, a run to August’s opening level at 1.1079 may be on the cards. Before reaching this far north, though, do remain cognisant of the said daily channel resistance possibly holding price action lower. Upon witnessing a H4 close above 1.10, possible entry points can be found either on the close of the breakout candle or a retest at the top edge of the figure (entry and risk can be determined according to the rejection candle’s structure).
GBP/USD:
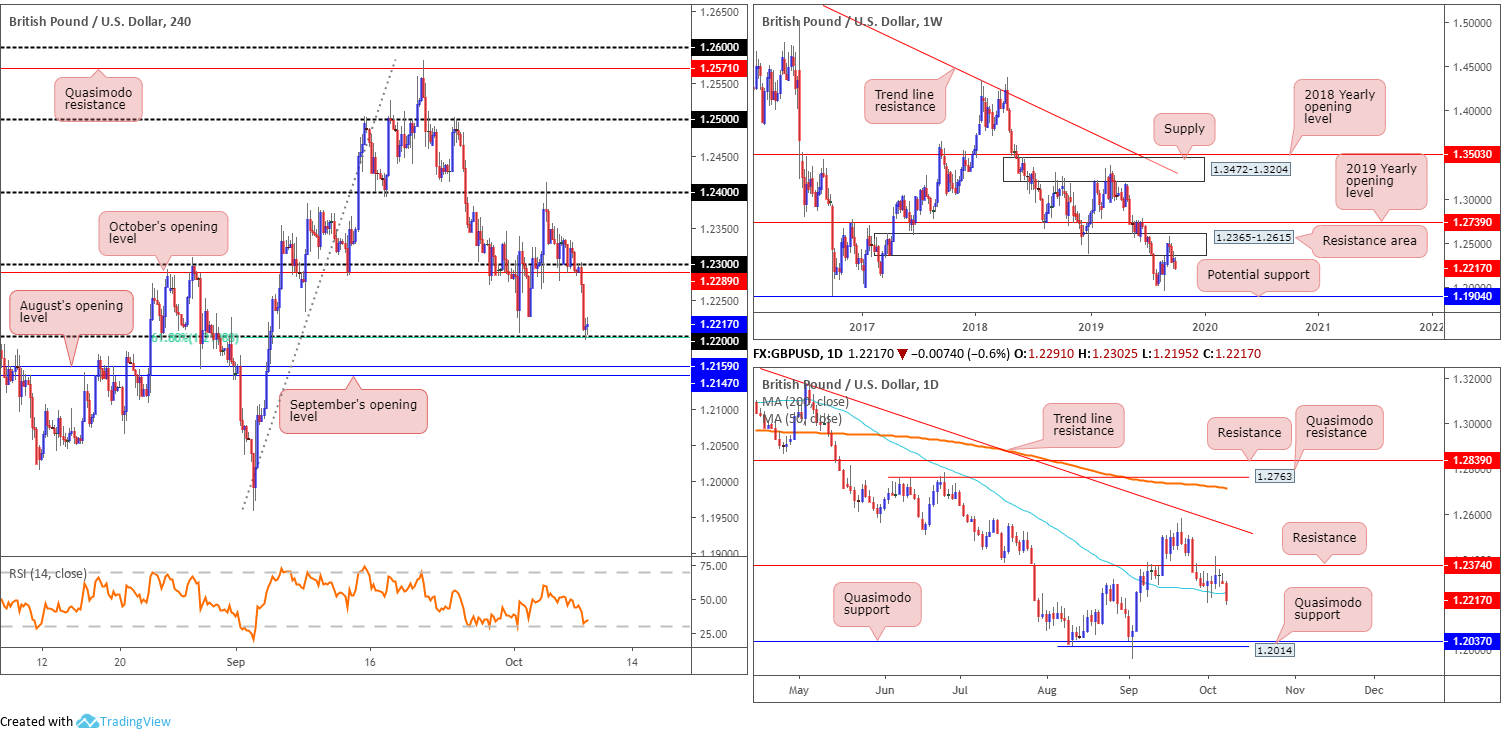
The British pound sunk vs. the buck Tuesday, on the heels of a controversial phone call between UK Prime Minister Boris Johnson and German Chancellor Angela Merkel. Sky News reported that during the conversation, Chancellor Merkel told the Prime Minister a deal is ‘overwhelmingly unlikely’.
GBP/USD movement retested the underside of 1.23 and rotated south, challenging lows at 1.2195 and mildly paring losses off 1.22, which happens to align with a 61.8% Fibonacci ratio. Also note the relative strength index (RSI) is now seen treading water just ahead of its oversold value. Beneath 1.22, traders’ crosshairs are likely fixed on September and August’s opening levels at 1.2147 and 1.2159, respectively.
Technical research on the weekly timeframe has long-term resistance area at 1.2365-1.2615 posted as a dominant structure, currently plugging upside. Assuming further downside is seen, the 1.1958 September 2 low and 1.1904 – held price action strongly higher in October 2016 – are the next supports in the firing range. The immediate trend on this timeframe (1.4376) has faced a southerly trajectory since April 2018, with a break of 1.1904 confirming the larger downward trend that began mid-2014. A closer reading on the daily timeframe shows the 50-day SMA (blue – 1.2251) gave way yesterday, portending a possible shift towards two layers of Quasimodo support at 1.2014 and 1.2037.
Areas of consideration:
The reaction observed off 1.22 is unlikely to deliver much more than the underside of the said 50-day SMA (1.2251), according to higher-timeframe structure. A similar scenario exists for the two monthly levels seen at 1.2147/1.2159, though action will likely be capped by 1.22.
On account of the above, a H4 close beneath 1.2147/1.2159 is eyed, followed by a possible move to the daily Quasimodo supports at 1.2014 and 1.2037. Following a close lower, entry at the close of the breakout candle is an option, though others may prefer to wait and see if a retest of the violated supports occur before pulling the trigger. This adds confirmation to the mix and provides entry and risk levels to trade based off the rejection candle’s structure.
AUD/USD:
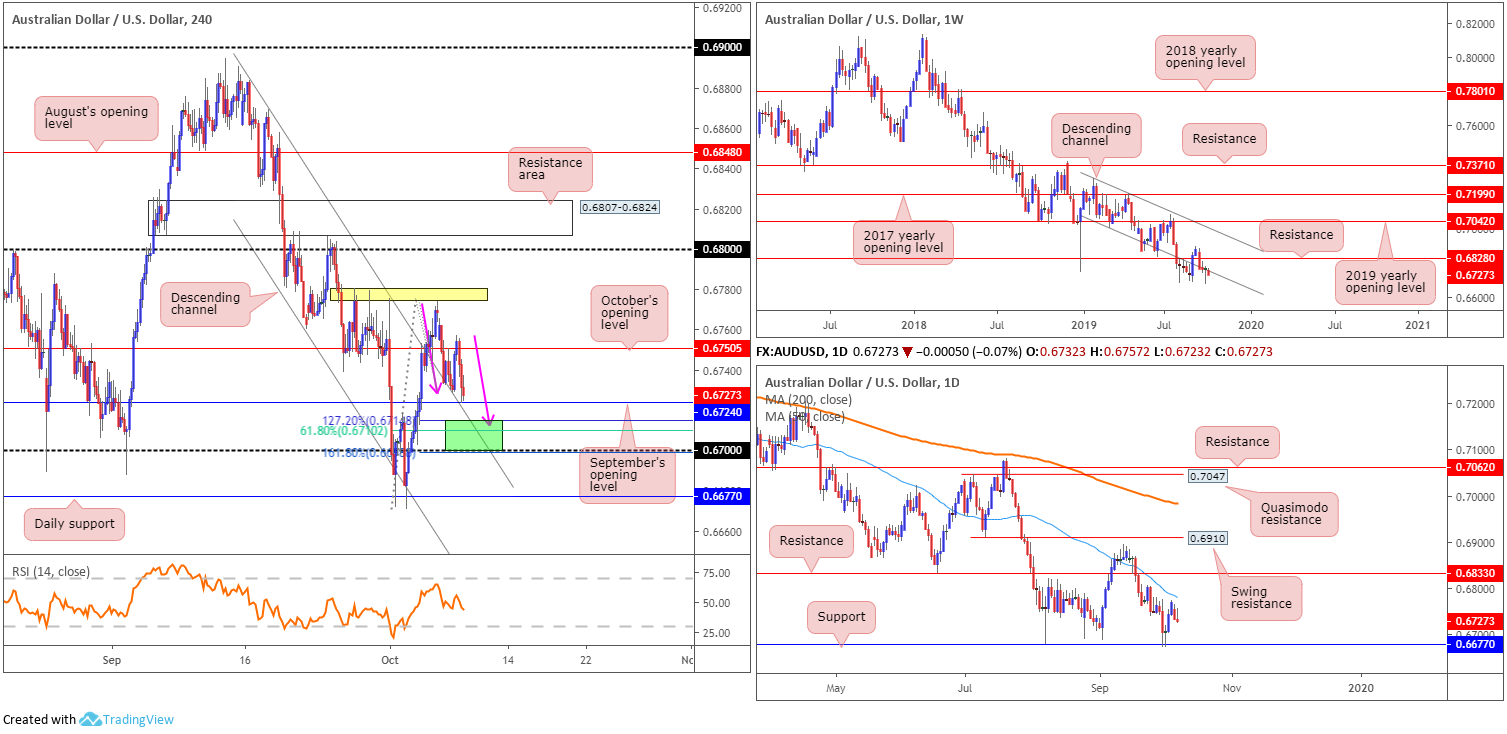
AUD/USD action finished mostly unmoved Tuesday, though marginally penetrated the lower edge of Monday’s range. This resulted in a test of September’s opening level at 0.6724 on the H4 timeframe after failing to overthrow October’s opening level at 0.6750.
An appealing area of support resides a touch beneath 0.6724 between 0.6699/0.6714 (green). Comprised of an AB=CD correction (pink arrows), formed by the 127.2%/161.8% area at 0.6714/0.6699, a channel resistance-turned support (extended from the high 0.6883), the round number 0.67 and a 61.8% Fibonacci ratio at 0.6710, this area boasts sufficient confluence to hold price, at least for a bounce.
Against the backdrop of H4 flow, however, daily price reflects a bearish vibe. Rotating lower just south of its 50-day SMA (blue – 0.6780), this portends a possible shift back to familiar support at 0.6677.
Technical action on the weekly timeframe had price attempt to take hold of its channel support (taken from the low 0.7003) last week, concluding in the shape of a hammer candlestick pattern (considered a bullish signal). Buyers, as of current price though, appear unenthusiastic. Driving lower from here and dethroning daily support highlighted above at 0.6677 could have dire consequence for the pair, with limited support not seen on the weekly timeframe until reaching 0.6359 (level not visible on the screen).
Areas of consideration:
Although the noted H4 support zone at 0.6699/0.6714 holds limited higher-timeframe convergence, local confluence on the H4 timeframe is likely enough to hold price action higher, with the possibility of a run back up to October’s opening level at 0.6750 (this also marks the 61.8% Fibonacci retracement of legs A-D – a common take-profit target for AB=CD patterns). Traders concerned by the threat of further selling on the higher timeframes may elect to wait and see if the H4 candles chalk up a bullish candlestick signal before committing funds. Entry and risk levels can then be determined according to the candle’s framework, with the added confidence buyers are likely present.
USD/JPY:
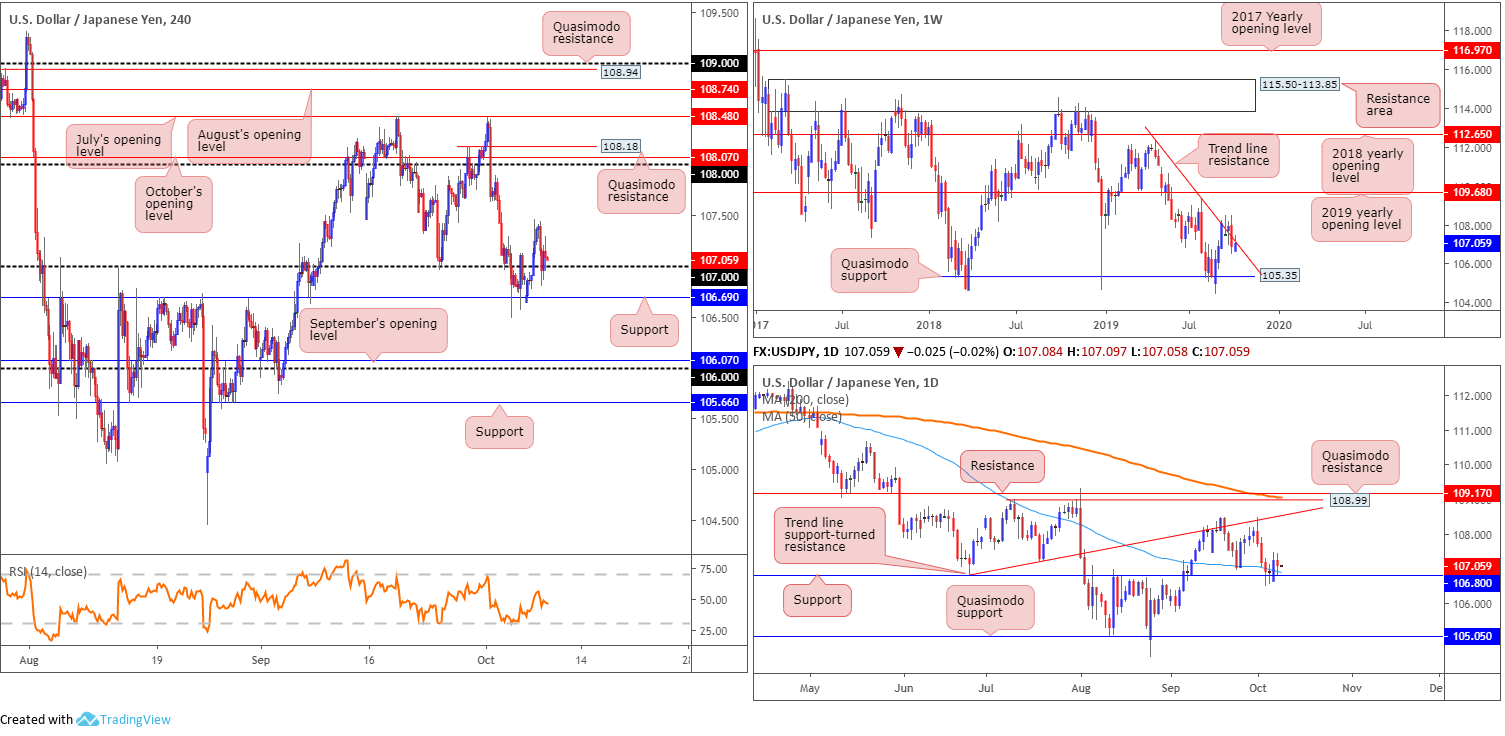
The Japanese yen eked out marginal gains against the US dollar Tuesday, with USD/JPY activity retesting 107 amid broad risk aversion. The holding at 107 into yesterday’s close is likely interpreted as daily buyers strengthening their grip on support at 106.80/the 50-day SMA (blue – 106.88), which could encourage a run to 108 on the H4. As underscored in Tuesday’s technical briefing, the round number merges closely with October’s opening level at 108.07 and a Quasimodo resistance at 108.18. With respect to the next upside target on the daily timeframe, the trend line support-turned resistance (taken from the low 106.78) is in the firing range, shouldered closely together with Quasimodo resistance at 108.99, the 200-day SMA (orange – 109.06) and resistance coming in at 109.17.
Longer term, weekly action remains stationed around a familiar trend line resistance etched from the high 112.40. As the low of last week’s bearish outside pattern (106.48) has yet to be tested, a short based on this formation has not been triggered. Quasimodo support at 105.35 is eyed as the next downside target on this scale, while to the upside, the 2019 yearly opening level falls in as the next resistance point at 109.68.
Areas of consideration:
Follow-through buying off 107 is certainly a possibility today, targeting 108. Knowing daily support at 106.80 also recently entered the mix adds weight to an upside move. The only grumble, of course, is weekly price toying with trend line resistance. For buyers still interested in 107 as a possible support today, however, may want to consider waiting for additional H4 candlestick confirmation to form before pulling the trigger. This will help identify if buyers are committed and offer an entry and stop-loss point to trade.
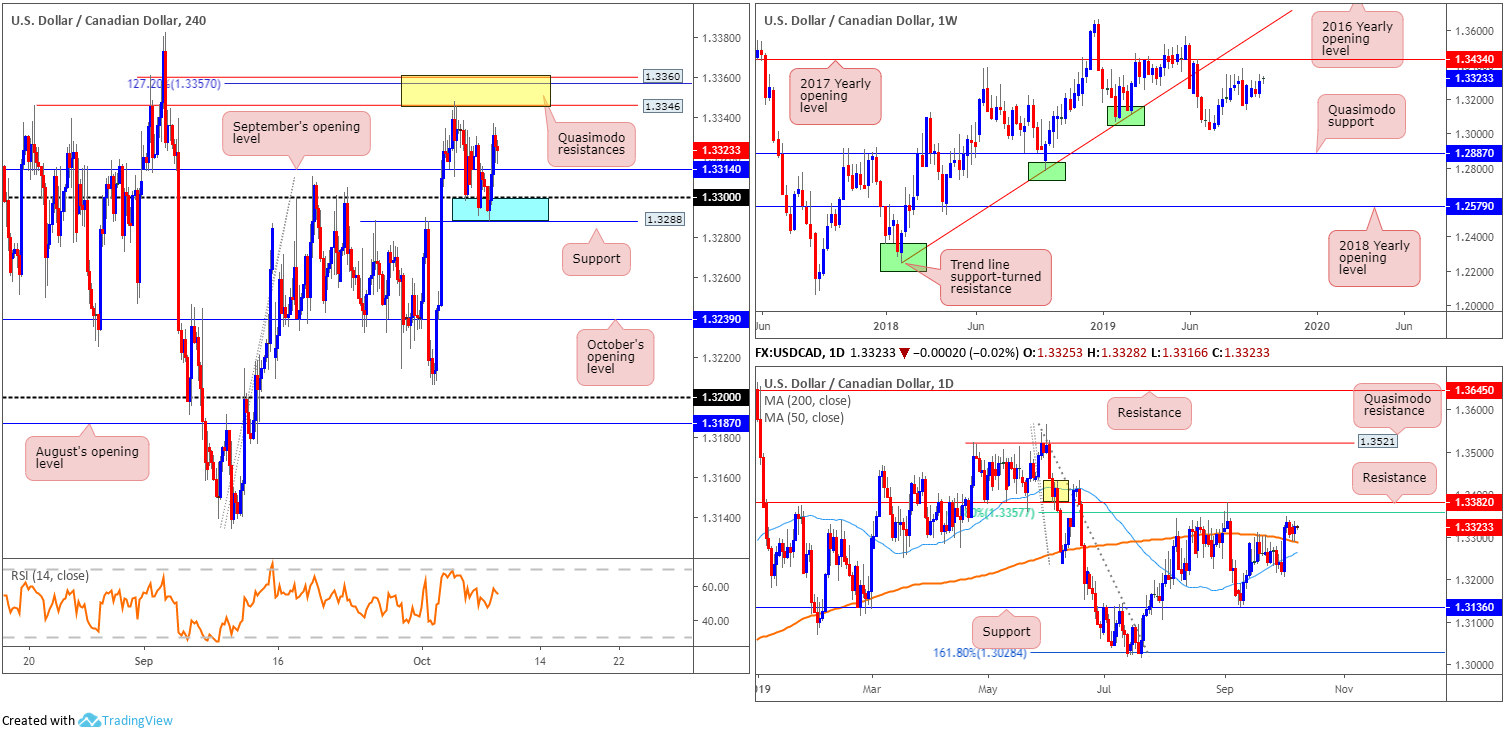
USD/CAD:
For traders who read Tuesday’s report you may recall the following piece:
Weekly candlestick action suggests further buying could be on the menu this week (with resistance not expected to emerge until 1.3434: the 2017 yearly opening level), therefore the retest at the 200-day SMA (1.3287) may be a possible long opportunity for some traders for a run to resistance at 1.3382/the 61.8% Fibonacci ratio at 1.3357. Interestingly, the moving average coincides with an area of H4 support (blue) between 1.3288/1.33, therefore resembling a potential reversal zone buyers may look to work from.
With 1.3288/1.33 holding ground yesterday, waiting for H4 price to engulf September’s opening level at 1.3314 could be a way of confirming buyer intent to 1.3360/1.3346 (two H4 Quasimodo resistances). A H4 close above 1.3314, thus, could be considered a signal; others may prefer to wait for a retest to form before committing funds (entry and risk can then be based on the rejection candle’s framework).
Areas of consideration:
The breakout above 1.3314 yesterday was reasonably volatile, placing an entry long at unsatisfactory risk/reward to 1.3360/1.3346. The alternative, as highlighted above, is to wait and see if a retest at 1.3314 occurs, preferably in the shape of a strong H4 bull candle.
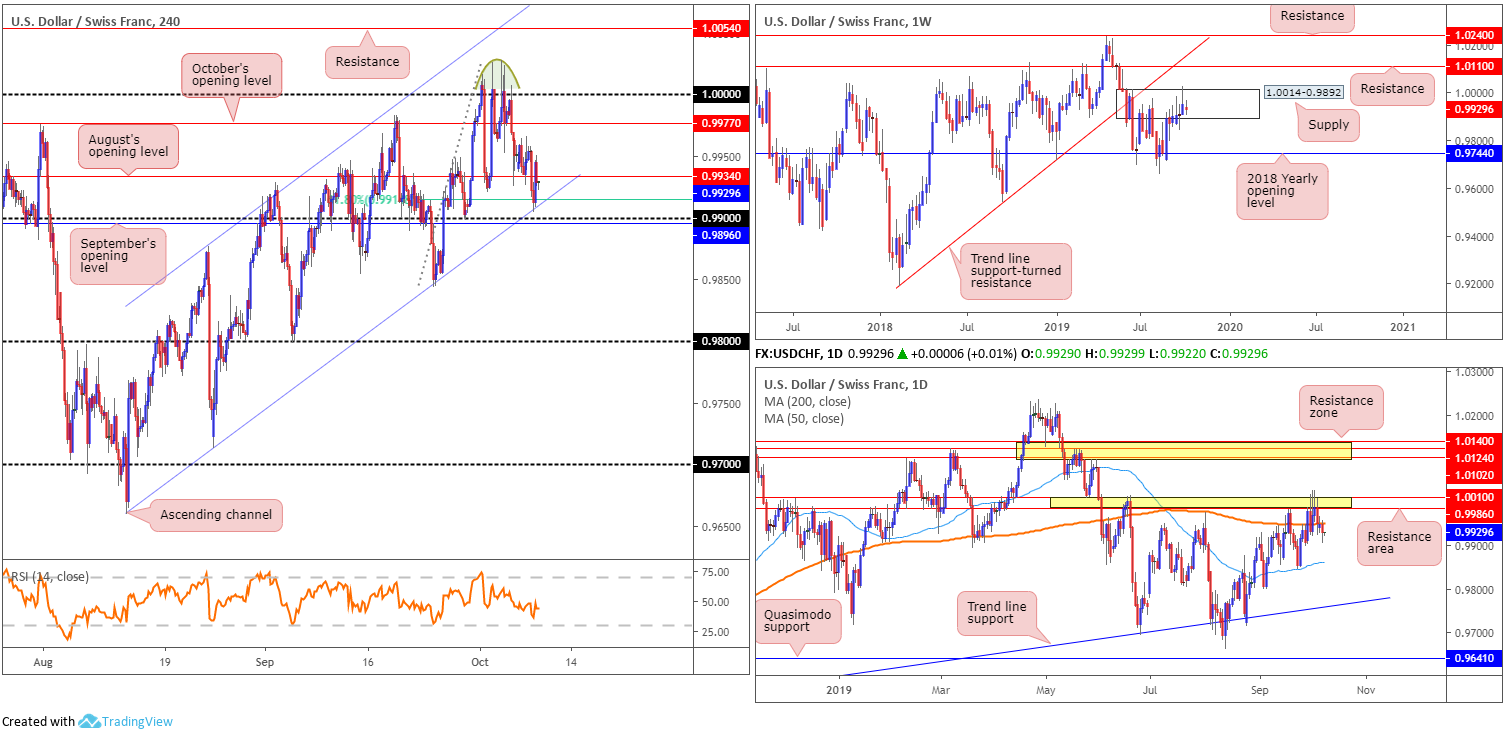
USD/CHF:
In recent sessions, the USD/CHF receded to fresh weekly lows just north of the 0.99 handle before staging a modest recovery as risk perception continues to drive markets.
The recent recovery was likely aided on the back of technical buying off H4 channel support (extended from the low 0.9659) and intersecting 61.8% Fibonacci support (0.9915), though appears struggling to overturn August’s opening level at 0.9934. Clearance of this level likely exposes October’s opening level at 0.9977, closely trailed by 1.0000 (parity).
With respect to the weekly timeframe’s technical picture, unchanged from Monday’s weekly briefing, last week’s candle clipped the top edge of supply at 1.0014-0.9892. While the recent move to multi-month peaks at 1.0027 possibly tripped some buy stops, interest from the sell side of the market clearly remains. In the event of a push higher this week, however, traders are urged to note resistance coming in at 1.0110, with a break of this barrier exposing trend line support-turned resistance (etched from the low 0.9187). If downside persists, the 2018 yearly opening level at 0.9744 is marked as the next support base.
Closer analysis of price action on the daily timeframe saw yesterday’s candle emphasise a bearish presence beneath the 200-day SMA (orange – 0.9951). Nudging beneath the 200-day SMA may lead to the 50-day SMA entering the fold (blue – 0.9859).
Areas of consideration:
Having noted weekly price establishing some ground within the parapets of supply, and daily price pencilling in further downside south of its 200-day SMA, sellers appear to have the upper hand at the moment.
Should a break beneath 0.99 take hold, a short could be something to consider. The move lower perhaps clears the pathway to the 0.9843 September 24 low and 0.98 handle. Remember, though, we also have the 50-day SMA at 0.9859 to contend with.
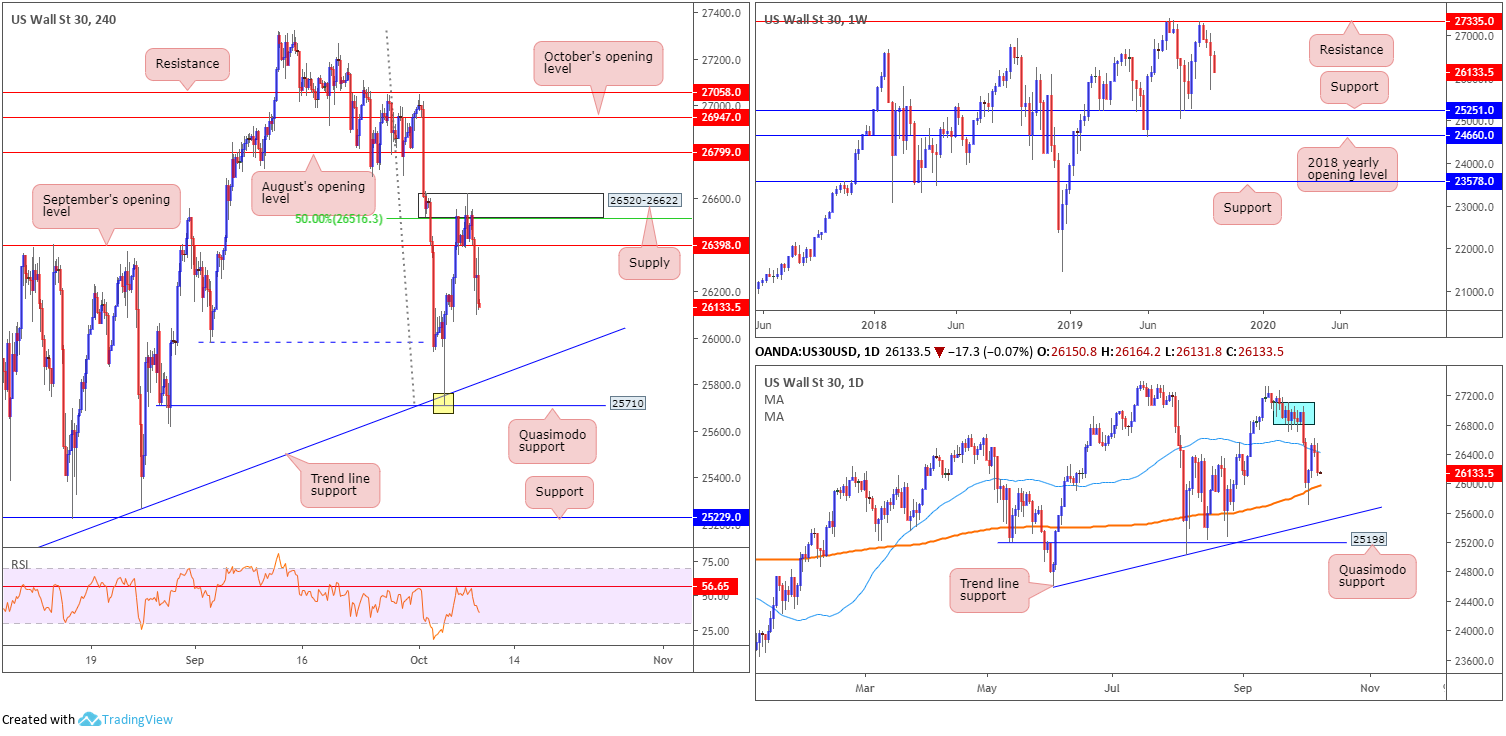
Dow Jones Industrial Average:
US stocks tumbled Tuesday amid mounting anxiety ahead of trade talks between Washington and Beijing, as headlines raised doubts trade talks, set to begin Thursday, will be successful. The Dow Jones Industrial Average shed 313.98 points, or 1.19%; the S&P 500 also lost 45.73 points, or 1.56%, and the tech-heavy Nasdaq 100 declined 120.86 points, or 1.56%.
Longer-term analysis has weekly price steamrolling southbound, poised to potentially approach support coming in at 25251, closely followed by the 2018 yearly opening level at 24660. Elsewhere, daily candles are seen compressing between the 200-day SMA (orange – 25978) and the 50-day SMA (blue – 26420). Overhead, supply is evident between 27110-26813 (blue – positioned just south of the weekly resistance at 27335), while to the downside we have trend line support etched from the low 24604 in sight.
H4 supply at 26520-26622, along with a 50.0% resistance value at 26516, recently entered the mix, though sellers out of this zone, albeit a fresh base, were likely cautious due to nearby support by way of September’s opening level at 26398. The next downside targets from here fall in at the 200-day SMA and H4 trend line support taken from the low 25024. For any of our readers who managed to take advantage of yesterday’s slide, great work.
Areas of consideration:
All three timeframes display scope to extend losses today; the closest support target resides in the shape of a trend line support on the H4 timeframe, closely tailed by the 200-day SMA. Shorting at current price positions traders at an adverse risk/reward given stop-loss placement would, technically speaking, need to be beyond September’s opening level at 26398. An alternative is to simply wait and see if H4 price pulls back and retests 26398. Selling from here allows traders the option of locating protective stop-loss orders above H4 supply at 26520-26622, giving the trade room to breathe and also allowing for a reasonably attractive risk/reward scenario.
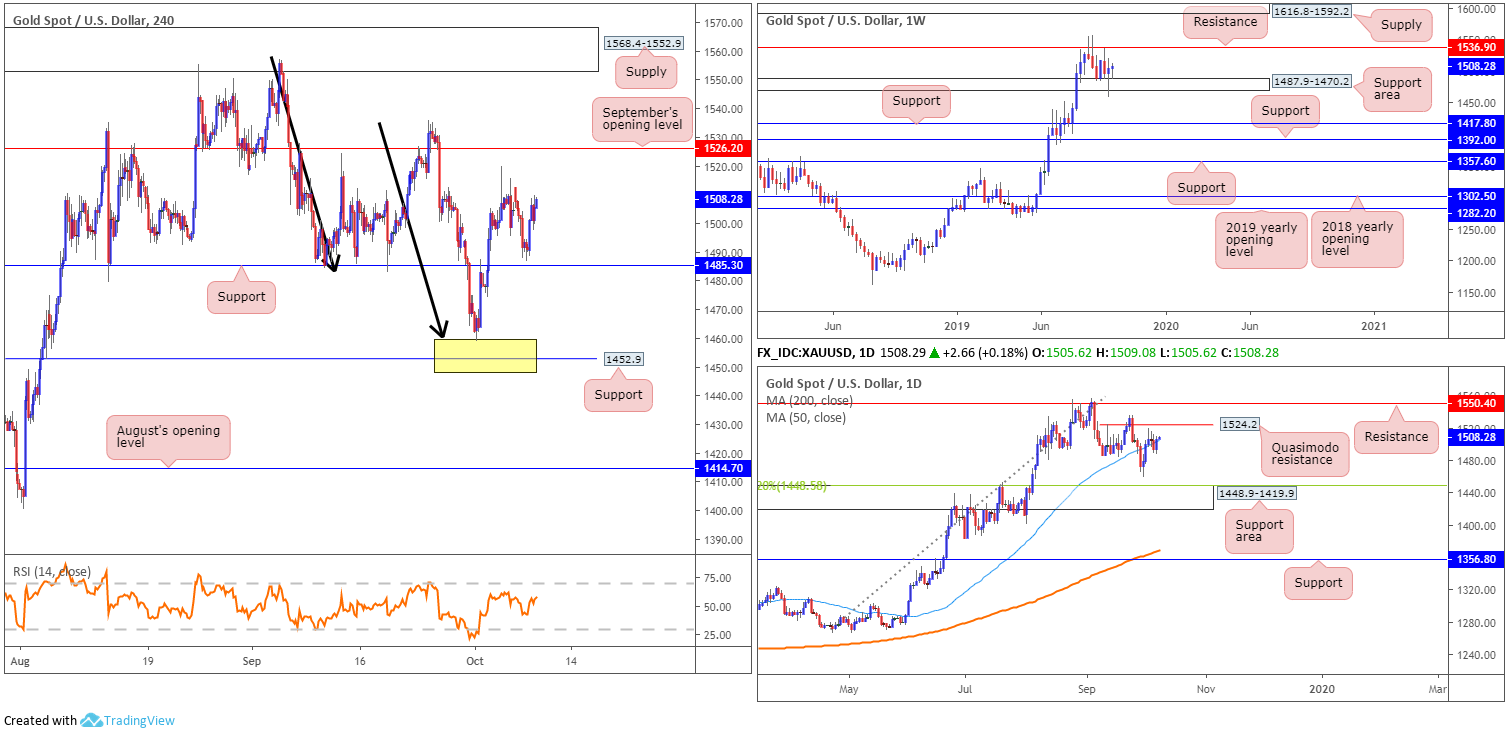
XAU/USD (GOLD):
Benchmark US equity indexes experienced reasonably substantial losses Tuesday amid broad risk aversion, consequently ramping up demand for safe-haven assets, such as gold.
Leaving H4 support unchallenged at 1485.3, the yellow metal shifted higher against the greenback and recovered all of Monday’s downside. Additional upside from current price on the H4 timeframe has last Thursday’s high at 1519.7 to target, followed closely by September’s opening level at 1526.2. Beyond this point, little is seen stopping a run towards supply coming in at 1568.4-1552.9.
On a wider perspective, weekly flow remains defensive off 1487.9-1470.2, with resistance on this scale seen close by at 1536.9. Supply at 1616.8-1592.2 is the next area of interest to the upside, whereas below the current support area, two layers of support are seen at 1392.0 and 1417.8.
Technical research on the daily timeframe has the yellow metal trading marginally north of its 50-day SMA (blue – 1504.8), thanks to recent bidding. Above here, Quasimodo resistance is seen at 1524.2, positioned just south of another layer of resistance at 1550.4.
Areas of consideration:
H4 support at 1485.3 remains a point of interest in this market for possible long opportunities, all the while buyers defend the weekly support area mentioned above at 1487.9-1470.2. However, with that being said, should daily Quasimodo resistance at 1524.2 enter the fight, 1485.3 may be violated.
For conservative buyers still eyeing 1485.3, waiting for additional candlestick confirmation to form might be an option worth exploring before executing a trade. This helps recognise commitment from the buy side of this market and will, as long as traders understand the candlestick’s entry and exit points, provide levels to trade from.
The accuracy, completeness and timeliness of the information contained on this site cannot be guaranteed. IC Markets does not warranty, guarantee or make any representations, or assume any liability regarding financial results based on the use of the information in the site.
News, views, opinions, recommendations and other information obtained from sources outside of www.icmarkets.com.au, used in this site are believed to be reliable, but we cannot guarantee their accuracy or completeness. All such information is subject to change at any time without notice. IC Markets assumes no responsibility for the content of any linked site.
The fact that such links may exist does not indicate approval or endorsement of any material contained on any linked site. IC Markets is not liable for any harm caused by the transmission, through accessing the services or information on this site, of a computer virus, or other computer code or programming device that might be used to access, delete, damage, disable, disrupt or otherwise impede in any manner, the operation of the site or of any user’s software, hardware, data or property.


