Key risk events today:
US ADP Non-Farm Employment Change; Crude Oil Inventories.
EUR/USD:
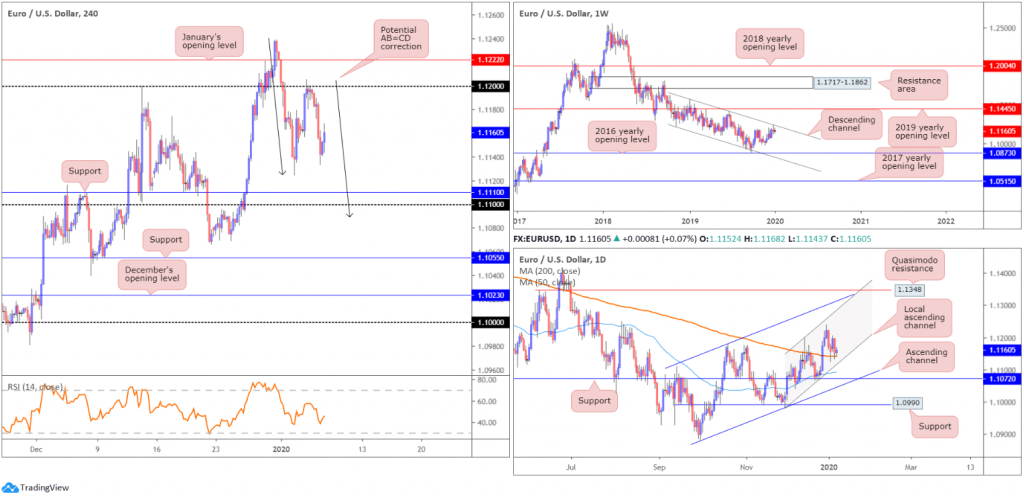
Following Monday’s five-point fakeout above 1.12 on the H4 timeframe, leaving January’s opening level at 1.1222 unchallenged, EUR/USD declined to lows of 1.1133, losing more than 0.40% on Tuesday. On the data front, EZ Annual core inflation remained unchanged at 1.3% in December. The US Non-Manufacturing PMI, according to the Institute for Supply Management, registered 55 percent, which is 1.1 percentage points higher than the November reading of 53.9 percent. This represents continued growth in the non-manufacturing sector, at a slightly faster rate.
In line with the weekly timeframe, recent losses were anticipated. Weekly movement, as highlighted in Monday’s technical briefing, is testing channel resistance, extended from the high 1.1569. Noticeable downside objectives fall in around the 2016 yearly opening level at 1.0873 and channel support, taken from the low 1.1109.
A closer reading of price action on the daily timeframe, though, has downside capped by its 200-day SMA (orange – 1.1140), positioned a few points north of the 50-day SMA (blue – 1.1092). We also remain compressing within a local (reasonably small) ascending channel configuration (1.0981/1.1199), formed inside a larger ascending channel formation taken from 1.0879/1.1179. In terms of support/resistance on this scale, Quasimodo resistance plotted at 1.1348 is in view, as is nearby support at 1.1072 (boasts an incredibly strong history since early August 2019) and another layer of support coming in at 1.0990.
Aside from the 1.1125 January 3rd low, the next downside targets on the H4 fall in around support at 1.1110, closely shadowed by the 1.11 handle.
Areas of consideration:
While higher-timeframe structure generally takes precedence over lower timeframes, the fact daily price chalked up a reasonably persistent defence of late off its 200-day SMA is concerning for weekly sellers.
On the H4 timeframe, in addition to the 1.12/11 round numbers in view, a potential AB=CD bullish correction (black arrows) implies a marginal fakeout through 1.11 could be in store to around the 1.1089ish region. Therefore, any traders looking to enter long based on the H4 support at 1.1110 and the 1.11 handle may want to take this into consideration.
GBP/USD:
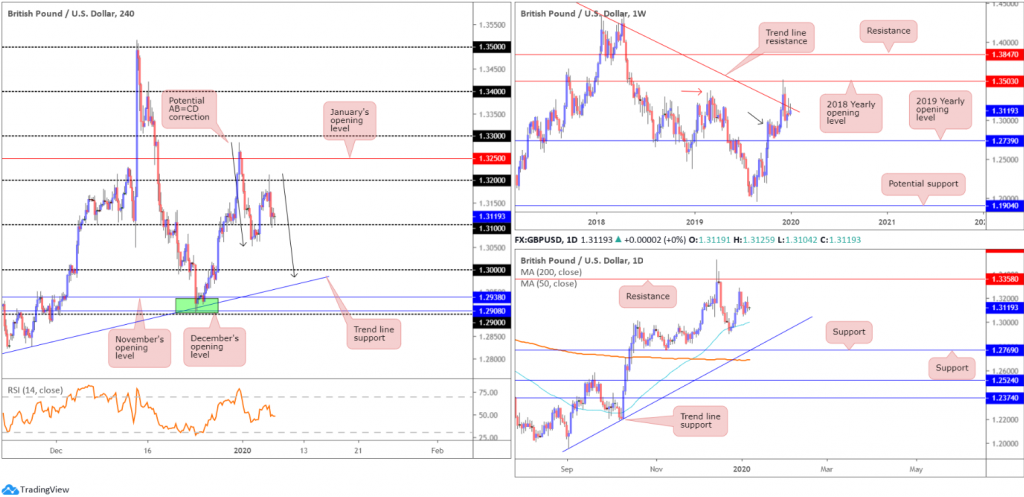
Despite Monday’s firm opening, The US dollar index’s recent advance, aided by an upbeat US Non-Manufacturing PMI reading, took a bite out of the British pound Tuesday, shedding more than 45 points, or 0.37%. MPs also returned from recess yesterday, debating the Brexit Withdrawal Bill in a committee stage, which passed, as expected.
As evident from the H4 timeframe this morning, the candles settled a touch north of the 1.31 handle, following a sharp move off 1.32. South of 1.31, beyond 1.3060ish, limited support is visible until reaching the key figure 1.30. Note This level also comes together with a potential AB=CD bullish correction (black arrows) at around 1.2982 and a trend line support, extended from the low 1.2768.
Meanwhile, on the weekly timeframe, buyers and sellers continue to square off between long-standing trend line resistance, pencilled in from the high 1.5930, and nearby demand around the 1.2939 region (black arrow), likely seduced by the recent break of the notable high at 1.3380 (red arrow).
The 50-day SMA (blue – 1.2999) remains reasonably dominant support on the daily timeframe. Another layer of support that may enter the fight, though, is 1.2769, which happens to merge closely with trend line support, pencilled in from the low 1.1958 and the 200-day SMA (orange – 1.2688). With respect to resistance, the only level of interest right now sits at 1.3358, capping upside since mid-June 2019.
Areas of consideration:
Although the level may not hit today, 1.30 is an obvious point of direction for many buyers in this market, considering its local (H4) confluence and also the 50-day SMA aligning closely with the round number.
A decisive close beneath 1.31, followed up with a retest as resistance, may also be of interest to some traders today. While 1.3060 highlights possible support, a retest at the underside of 1.31, shaped by way of a H4 bearish candlestick signal, is likely enough to drive through any buying opposition, targeting 1.30 as the take-profit zone.
AUD/USD:
In recent hours, confirmed reports of Iran launching over a dozen ballistic missiles against US military and coalition forces in Iraq triggered a flight to safety. The US Pentagon stated it will take all necessary measures to protect US personnel and allies.
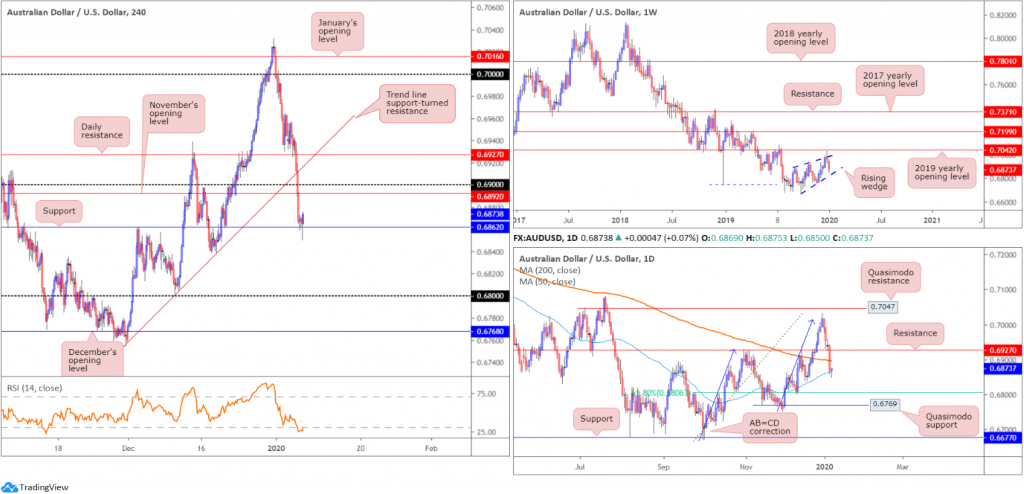
AUD/USD extended previous losses but is, at the time of writing, finding some respite off H4 support coming in at 0.6862, confirmed by the relative strength index (RSI) testing oversold territory. What’s interesting from a technical perspective is daily structure shows the 50-day SMA (blue – 0.6864) aligns with the said H4 support. Beyond the current 50-SMA, we see possible support emerging off the 61.8% daily Fibonacci retracement at 0.6806, closely trailed by daily Quasimodo support at 0.6769.
Weekly action, since registering a bottom in late September at 0.6670, has been busy carving out what appears to be a rising wedge formation, typically considered a continuation pattern. Recent selling witnessed price decline back into the rising wedge, with a break lower possible given the primary downtrend in this market has faced a southerly bearing since early 2018.
Areas of consideration:
Although weekly price is suggestive of further declines, an intraday long position off the current H4 support at 0.6862 is an option. Knowing the level boasts a connection to the 50-day SMA, an advance to at least November’s opening level on the H4 at 0.6892/200-day SMA is certainly a possibility. In addition to this, the recently closed H4 candle put in a reasonably obvious hammer candlestick pattern (a bullish signal at troughs).
USD/JPY:
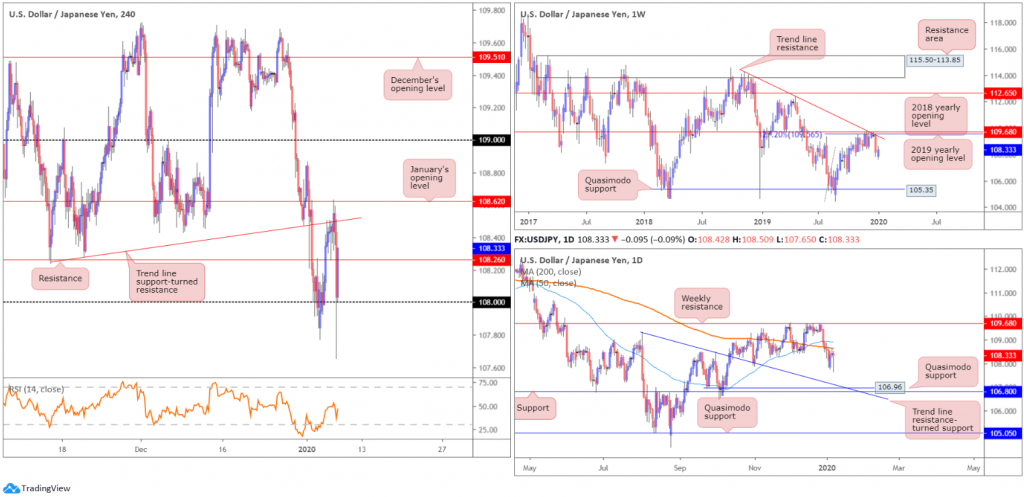
USD/JPY shed hefty ground in early Asia this morning, clocking lows of 107.65 in the process. A bout of risk aversion triggered the descent over confirmed reports of Iran launching over a dozen ballistic missiles against US military and coalition forces in Iraq.
Despite this, H4 action reclaimed 108+ status in recent movement, and is attempting to overthrow resistance at 108.26. Beyond 108, however, traders may wish to note the next support target falls in around 107.42 (not visible on the screen). Trend line support-turned resistance, extended from the low 108.24, assuming a break higher, is the next port of call to the upside, closely followed by January’s opening level at 108.62.
The story on the weekly timeframe remains unchanged. USD/JPY printed a decisive 130-point move lower last week off notable resistances, comprised of a 127.2% Fibonacci extension at 109.56 (taken from the low 104.44), the 2019 yearly opening level at 109.68 and trend line resistance, extended from the high 114.23. Aside from the 106.48 September 30 swing low, limited support is evident until shaking hands with Quasimodo support at 105.35. Regarding the market’s primary trend, the pair has been entrenched within a long-term range since March 2017, spanning 115.50/105.35.
Daily flow, on the other hand, is seen capped beneath the 200-day SMA (orange – 108.63), with visible support plotted nearby at 106.80, coupled with a Quasimodo support at 106.96 and a trend line resistance-turned support, taken from the high 109.31.
Areas of consideration:
Weekly action nosediving from notable resistance around 109.68, and daily price holding beneath its 200-day SMA reflects a strong bearish vibe in this market. Therefore, once again, the noted H4 trend line resistance, along with its closely fitted resistance at 108.62 (Jan opening level), could be an area worthy of consideration for selling opportunities today.
Conservative traders, threatened by current volatility, may opt to wait for additional candlestick confirmation to emerge from 108.60ish before pulling the trigger (entry/risk measures can then be determined according to the candlestick pattern).
USD/CAD:
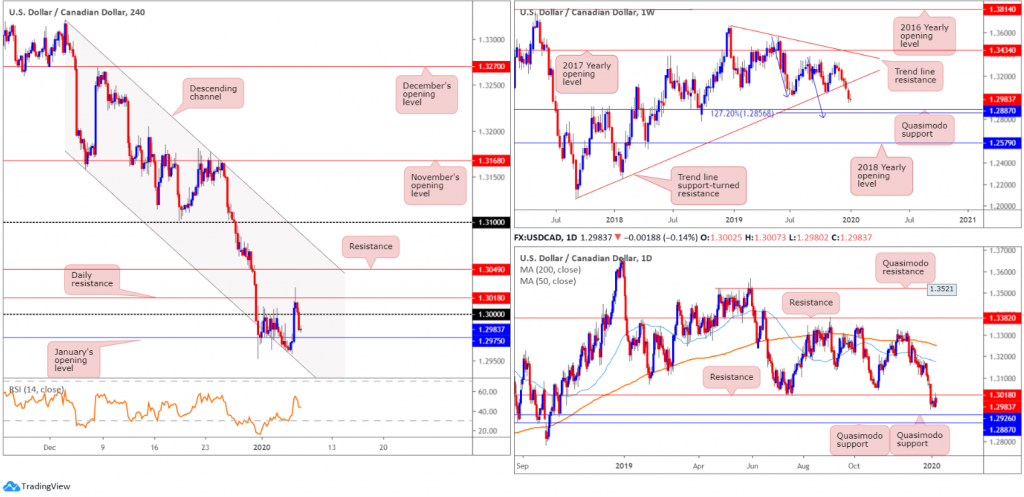
Early trade Tuesday witnessed USD/CAD chalk up a strong recovery off H4 channel support, extended from the low 1.3158. A combination of dollar strength, waning oil prices and less-than-stellar trade balance figures out of Canada, lifted the pair through 1.30 and daily resistance at 1.3018 to highs of 1.3029.
As seen from the H4 chart, though, buyers failed to sustain gains north of 1.30, pressured lower on the back of confirmed reports of Iran launching over a dozen ballistic missiles against US military and coalition forces in Iraq. January’s opening level at 1.2975 is in sight as the next support target on the H4 scale, followed by the noted H4 channel support.
Elsewhere, daily price, as highlighted above, tested resistance at 1.3018 and held ground. Sellers must contend with daily Quasimodo support at 1.2926, closely shadowed by a weekly Quasimodo support at 1.2887. Weekly price also boasts a 127.2% AB=CD bullish correction (blue arrows) at 1.2856. As such, 1.2856/1.2887 on the weekly timeframe is likely a base active buyers reside.
The immediate trend, according to the weekly timeframe, has faced north since bottoming in September 2017; however, this move could also be considered a deep pullback in a larger downtrend from the 1.4689 peak in early January 2016.
Areas of consideration:
Overall, higher-timeframe chart studies signify further losses, at least until reaching 1.2926.
The close below 1.30 on the H4 likely enticed some sellers into the market yesterday, with protective stop losses positioned above daily resistance at 1.3018. Ultimately, these sellers are likely looking for price to overpower January’s opening level at 1.2975 as well as the current H4 channel support to head for daily Quasimodo support at 1.2926.
A retest at the underside of 1.30 may provide additional entries, particularly if shaped by way of a H4 bearish candlestick pattern.
USD/CHF:
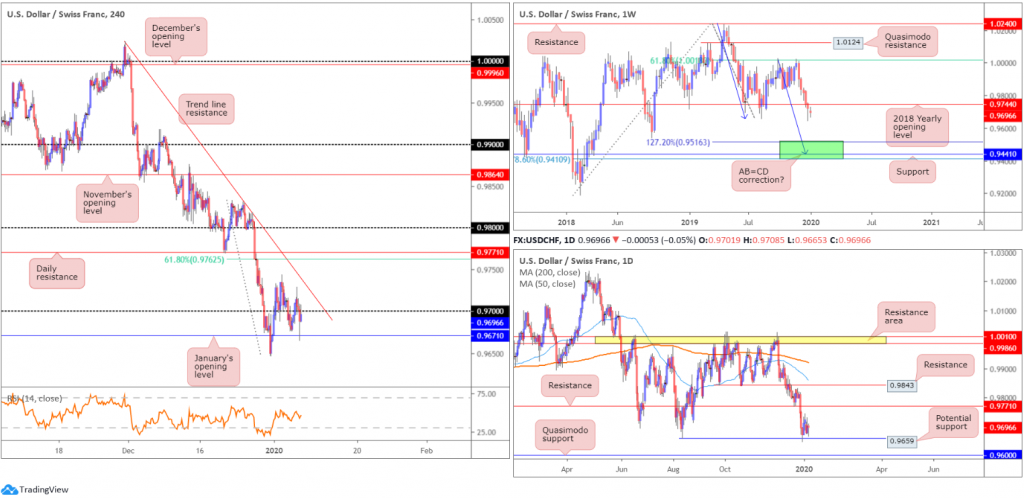
USD/CHF movement, in response to amplified geopolitical risk, was surprisingly passive. January’s opening level, based on the H4 timeframe, at 0.9671 remains as support. Possible resistance resides close by in the form of the 0.97 handle, closely trailed by a trend line resistance, extended from the high 1.0023.
South of 0.9671, chart studies reveal limited support until shaking hands with the 0.96 handle. Above the aforementioned trend line resistance, 61.8% Fibonacci resistance lies at 0.9762 and daily resistance at 0.9771.
Weekly price shows that since shaking hands with the underside of the 61.8% Fibonacci retracement ratio at 1.0018, last week chalked up its fifth consecutive bearish candle. The unit also activated sell stops south of the 2018 yearly opening level at 0.9744, which has capped downside since the beginning of 2019. In the event we continue navigating lower ground, the next downside target can be seen around the 0.9410/0.9516 region (comprised of a 78.6% Fibonacci retracement at 0.9410, support at 0.9441 and a 127.2% AB=CD bullish correction at 0.9516 – green).
The 0.9659 August 13 low held price north mid-week on the daily timeframe, reaching highs of 0.9733 by the week’s close. Whether this will be enough to test resistance at 0.9771 is difficult to tell at this point. Areas of interest beyond the said zones can be found at resistance coming in at 0.9843 and a Quasimodo support at 0.9600. Both the 200-day SMA (orange – 0.9920) and 50-day SMA (blue – 0.9859) also face a southerly bearing, with the 50-SMA drifting south of the 200-SMA.
Areas of consideration:
Weekly sellers holding ground beneath 0.9744 and H4 price crossing below 0.97 echoes a bearish vibe in this market. A H4 close below January’s opening level mentioned above at 0.9671 would likely be viewed as a strong bearish indication we’re heading for 0.96 (represents not only a round number but also the daily Quasimodo support).
The only concern, of course, is daily price defending 0.9659. Therefore, traders may consider waiting and seeing if a retest at 0.9671 occurs, following a break lower, preferably in the shape of a H4 bearish candlestick signal. This helps identify seller intent and provides entry and risk levels to trade, making the calculation of risk/reward easier.
Dow Jones Industrial Average:
US stocks plunged lower in recent hours, as sentiment took a hit after Iranian forces carried out multiple attacks on Iraqi bases housing US personnel and allies. Tuesday, however, saw the Dow Jones Industrial Average erase 119.70 points, or 0.42%; the S&P 500 dropped 9.10 points, or 0.28% and the tech-heavy Nasdaq 100 lost 2.07 points, or 0.02%.
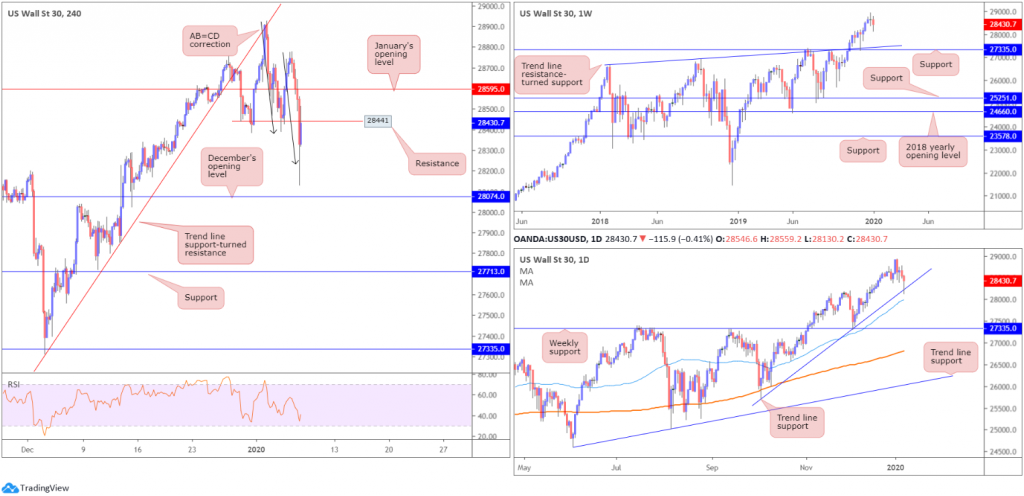
Technical research based on the H4 timeframe has price retesting the underside of Quasimodo support at 28441, after scoring lows of 28130, in the shape of an AB=CD bullish correction (black arrows). December’s opening level at 28074 offers potential support in the event we continue to push lower, whereas a break of 28441 has January’s opening level at 28595 to target.
Weekly price is pretty much unchanged:
Following a weekly hammer candlestick pattern (considered a buy signal at troughs), formed five weeks back at the retest of support drawn from 27335, along with trend line support etched from the high 26670, the index tested fresh record peaks of 28925 last week.
Meanwhile, on the daily timeframe, trend line support, extended from the low 25710, entered the fray in recent movement, bolstered by additional support nearby from the 50-day SMA (blue – 27995).
Areas of consideration:
While the uptrend remains in a strong position, and daily price recently shook hands with trend line support, H4 resistance at 28441, along with January’s opening level at 28595, may hamper upside. Therefore, the logical approach here may be to wait and see if H4 price climbs above 28595 before considering long entries into this market. This would likely unlock the path north to the all-time high of 28925.
Entry techniques above 28595 could be simply to enter on the breakout candle’s (H4) close and position stop-loss orders accordingly. An alternative might be to wait for a retest at 28595 to form before committing funds to a position. Ultra conservative traders, however, might only be satisfied buyers on a break above the 28779 January 7 high.
(Italics represents previous analysis)
The accuracy, completeness and timeliness of the information contained on this site cannot be guaranteed. IC Markets does not warranty, guarantee or make any representations, or assume any liability regarding financial results based on the use of the information in the site.
News, views, opinions, recommendations and other information obtained from sources outside of www.icmarkets.com.au, used in this site are believed to be reliable, but we cannot guarantee their accuracy or completeness. All such information is subject to change at any time without notice. IC Markets assumes no responsibility for the content of any linked site.
The fact that such links may exist does not indicate approval or endorsement of any material contained on any linked site. IC Markets is not liable for any harm caused by the transmission, through accessing the services or information on this site, of a computer virus, or other computer code or programming device that might be used to access, delete, damage, disable, disrupt or otherwise impede in any manner, the operation of the site or of any user’s software, hardware, data or property.
