
Key risk events today:
ECB President Lagarde Speaks; FOMC Meeting Minutes.
(Previous analysis as well as outside sources – italics).
EUR/USD:
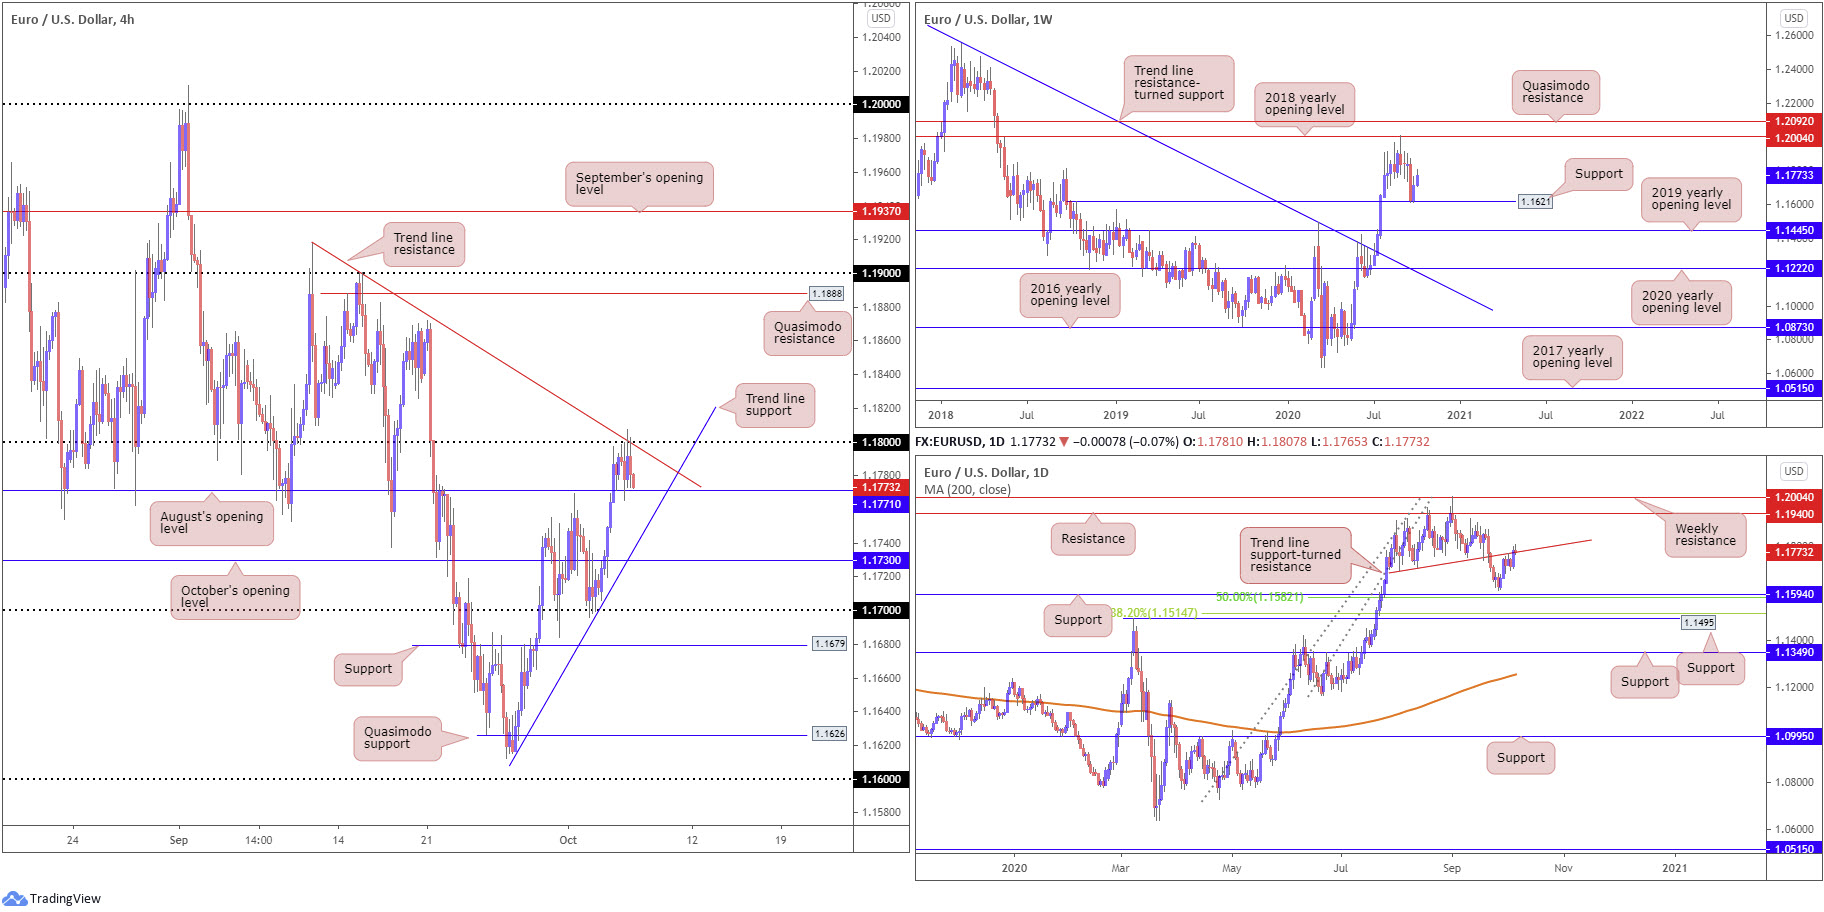
It was a mixed session for EUR/USD Tuesday, with H4 reacting to the 1.18 handle and converging trend line resistance, taken from the high 1.1917. August’s opening value also made an appearance at 1.1771 as support. Overhead, we do not see much on offer until Quasimodo resistance at 1.1888, while a 1.1771 violation is likely to target the steep trend line support, extended from the low 1.1616.
Further out on the weekly timeframe, price action recently responded to minor support at 1.1621, set just north of the 2019 yearly opening value at 1.1445. An extension to the upside potentially throws the 2018 yearly opening value at 1.2004 back into action.
A closer reading of price action on the daily timeframe reveals the unit challenging a trend line support-turned resistance, etched from the low 1.1695. Removing this line calls for resistance at 1.1940, whereas a rejection shines the spotlight on support at 1.1594 (and 50.0% retracement ratio at 1.1582).
Areas of consideration:
Due to Tuesday’s lacklustre performance, the outlook remains mostly unchanged.
In the event 1.18 surrenders today, a continuation to H4 Quasimodo resistance at 1.1888 could be on the cards. Falling in line with weekly direction, climbing above 1.18 is potentially appealing to intraday breakout buyers (conservative traders, nevertheless, are likely to seek at least a 1.18 retest before committing).
August’s opening value at 1.1771 (H4) could also remain supportive today. Failure here points to a test of H4 trend line support, taken from the low 1.1616. Should we move beyond the latter, this is when sellers, likely feeding off daily trend line resistance, may emerge in numbers, targeting October’s opening value at 1.1730.
GBP/USD:
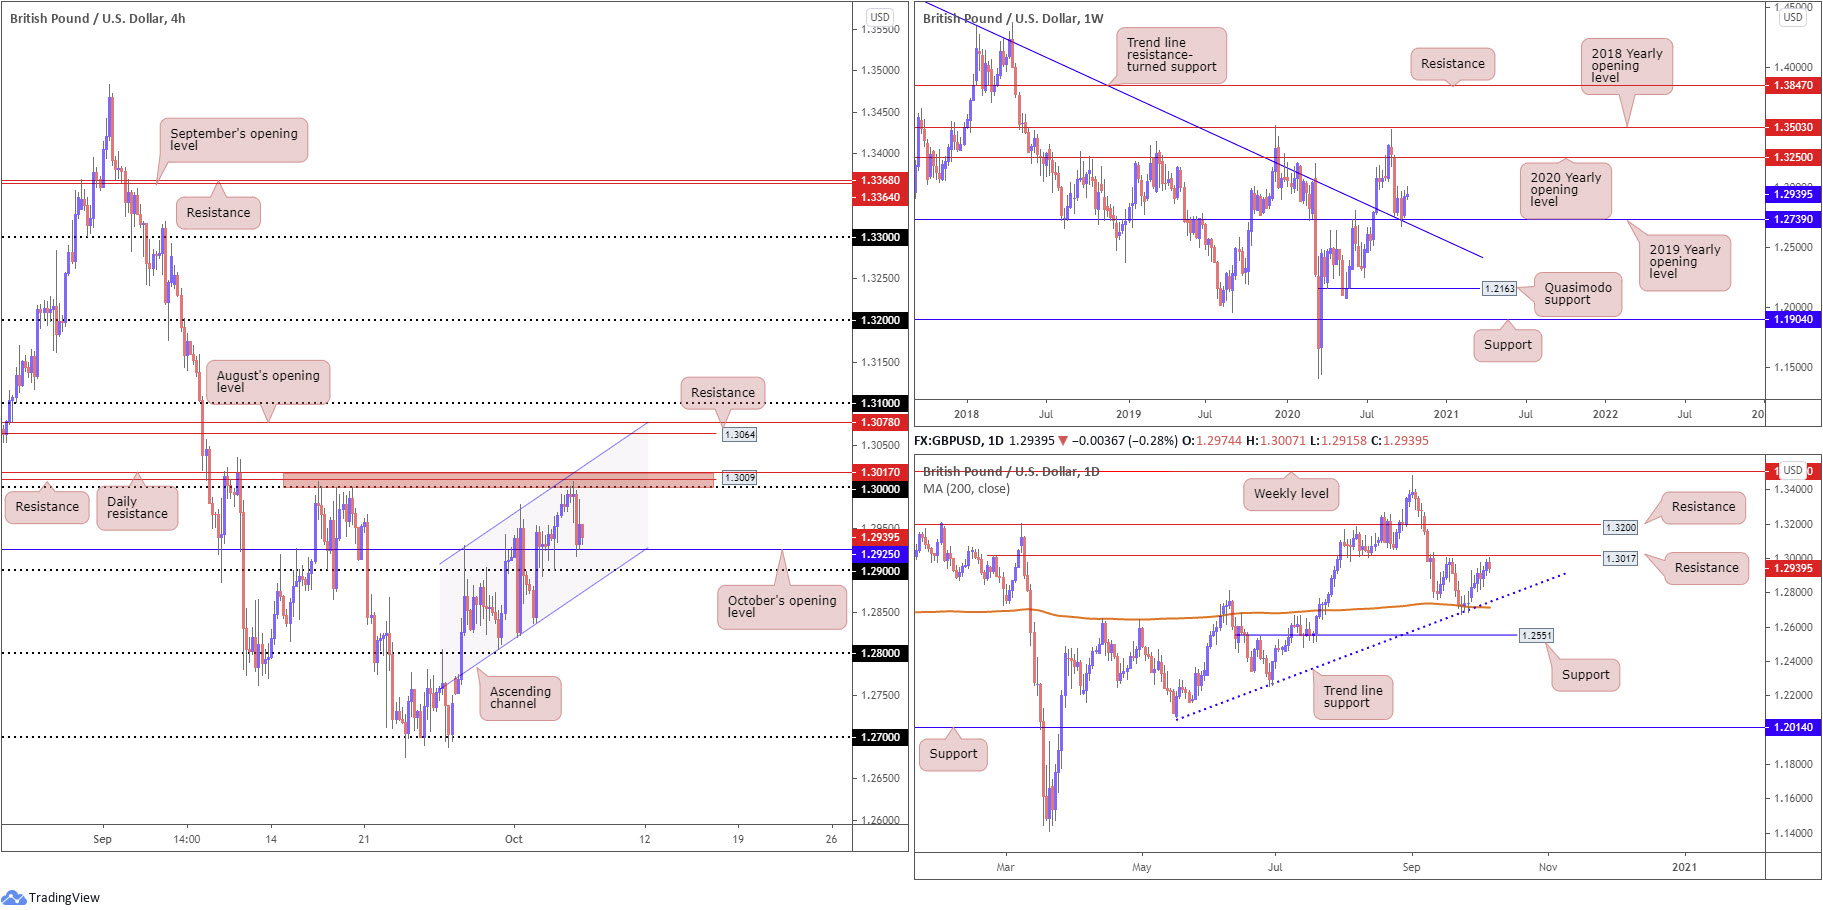
Pound sterling took a step back on Tuesday after shaking hands with the key figure 1.30, consequently delivering H4 candles to October’s opening value at 1.2925. Additional resistance was, as noted in recent analysis, seen around 1.30: H4 resistance at 1.3009 and daily resistance at 1.3017 (red).
On the daily timeframe, the 200-day SMA (orange – 1.2713) and joining trend line support, extended from the low 1.2075, reside to the downside. Above 1.3017 resistance exposes another layer of resistance at 1.3200. From the weekly timeframe, GBP/USD finished last week higher by nearly 200 points after crossing swords with support at 1.2739, a 2019 yearly opening value. Technicians will acknowledge the level also blends with trend line resistance-turned support, extended from the high 1.5930. In terms of resistance, price has room to advance as far north as the 2020 yearly opening value at 1.3250. Crossing 1.2739, on the other hand, registers a bearish setting, with the 1.2251 June 29 low targeted, closely shadowed by Quasimodo support priced in at 1.2163.
Areas of consideration:
For those who read Tuesday’s technical briefing you may recall the following (italics):
Going forward, despite weekly price forecasting additional space to advance, 1.3017/1.30 resistance (red zone on the H4) is marked as a potentially troublesome obstacle for buyers. For that reason, bearish themes could emerge from this region today. Breaking above the area, nonetheless, is likely to prompt further buying to H4 resistance at 1.3064, August’s opening value at 1.3078 and the 1.31 handle.
According to technical studies on the H4 heading into Wednesday, 1.29 and channel support (H4), extended from the low 1.2805, may appeal to buyers. Violating the latter helps confirm bearish strength south of daily resistance at 1.3017 and also demonstrates weekly buyers may lack enthusiasm off 1.2739. Intraday bears under H4 channel support, therefore, are likely to hone in on 1.28.
AUD/USD:
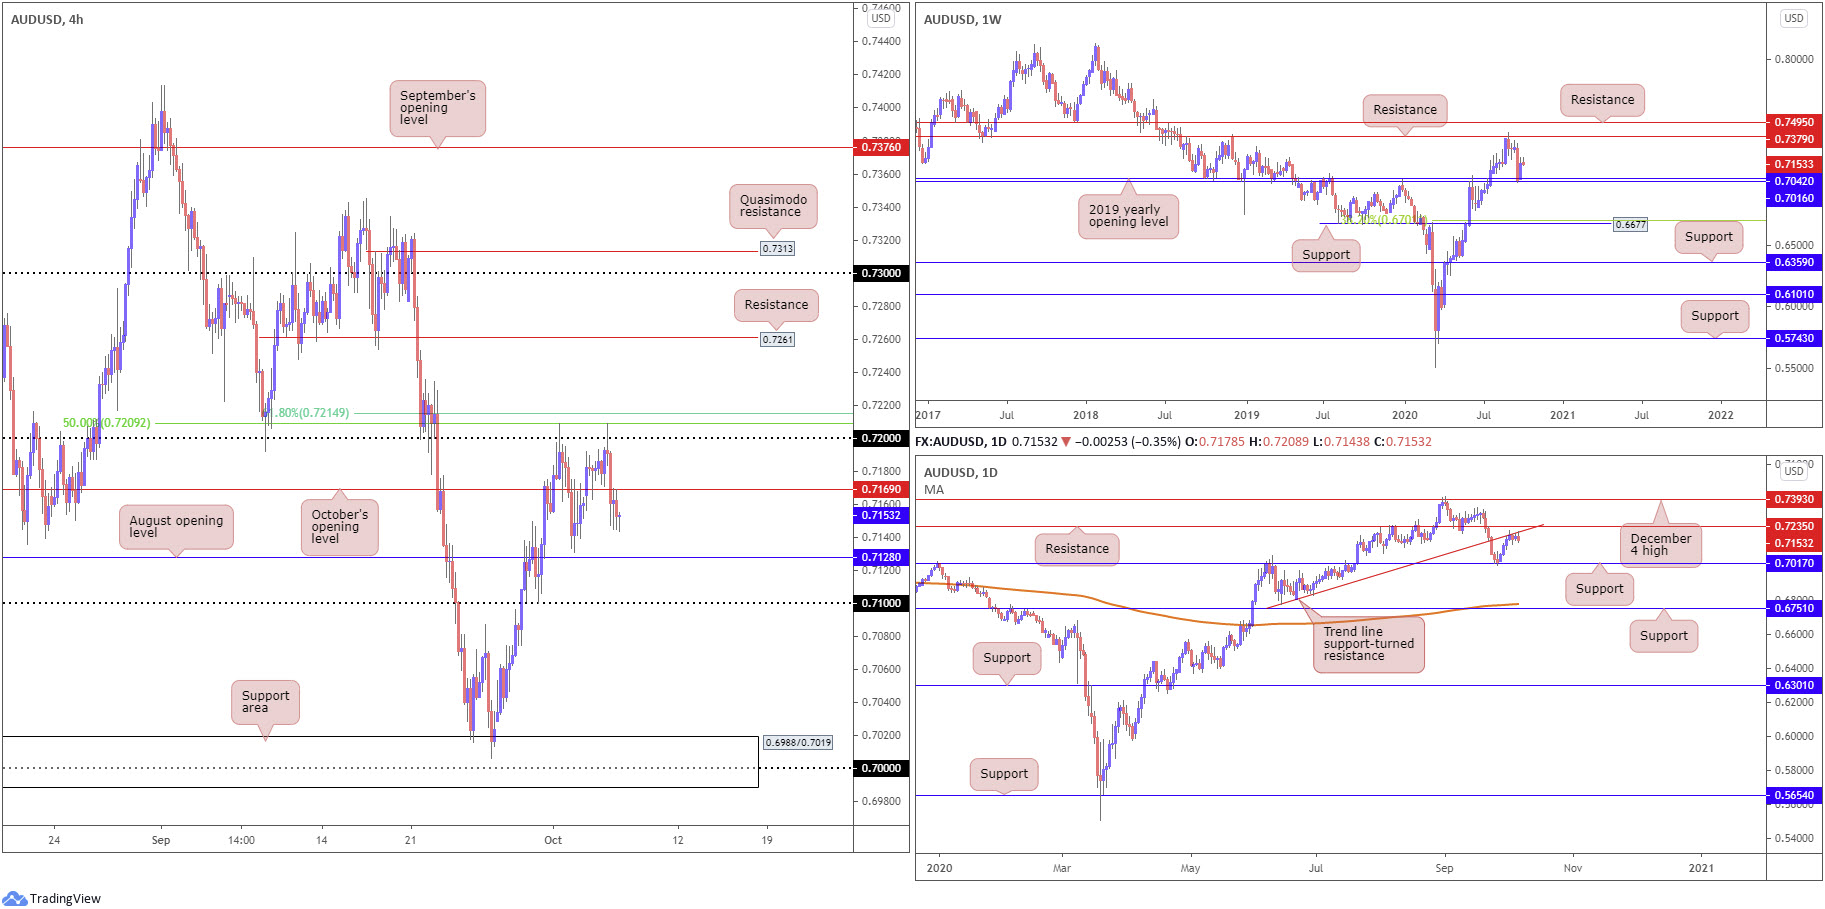
In wake of the RBA and Aussie Budget, with the former standing pat on rates, the Australian dollar underperformed against its US counterpart Tuesday. On the technical front, H4 whipsawed above the 0.72 handle in the early hours to test a 50.0% retracement ratio at 0.7209 (positioned a few pips under a 61.8% Fibonacci retracement ratio at 0.7214), movement that eventually drew candle action through October’s opening value at 0.7169 (now serving as resistance). Next on tap, as far as support is concerned, is seen around August’s opening value at 0.7128, with a break exposing the 0.71 handle.
From the weekly timeframe (unchanged since Monday’s weekly report):
Buyers pencilled in a strong presence off the 2020 and 2019 yearly opening values at 0.7016 and 0.7042 last week, respectively, following a 3.6% decline the week prior. Additional bullish sentiment could target as far north as resistance at 0.7379. It might also be worth noting the trend in this market remains to the upside, therefore the rebound from 0.7016/0.7042 may be interpreted as a dip-buying signal. Should the market fail to extend recovery gains, support priced in at 0.6677 is next in the firing range, alongside a 38.2% Fibonacci retracement ratio at 0.6701.
From the daily timeframe (also mostly unchanged since Monday’s weekly report):
The rebound from support at 0.7017 sparked a wave of buying last week, drawing enough impetus to challenge trend line support-turned resistance, extended from the low 0.6776 (sited just south of resistance coming in at 0.7235). Above here, traders’ crosshairs will likely be fixed on (December 4 high resistance) 0.7393. As can be seen from the chart, however, the aforementioned trend line resistance is holding firm at the moment.
Areas of consideration:
- Buyers entering long based on the weekly timeframe face resistance on the daily chart. Conservative buyers are likely to seek at least a H4 close above daily resistance at 0.7235 before considering bullish positions.
- With H4 holding under October’s opening value at 0.7169, and recently retesting the line as resistance, intraday bearish signals to at least August’s opening value at 0.7128 could unfold, possibly followed by the 0.71 handle.
USD/JPY:
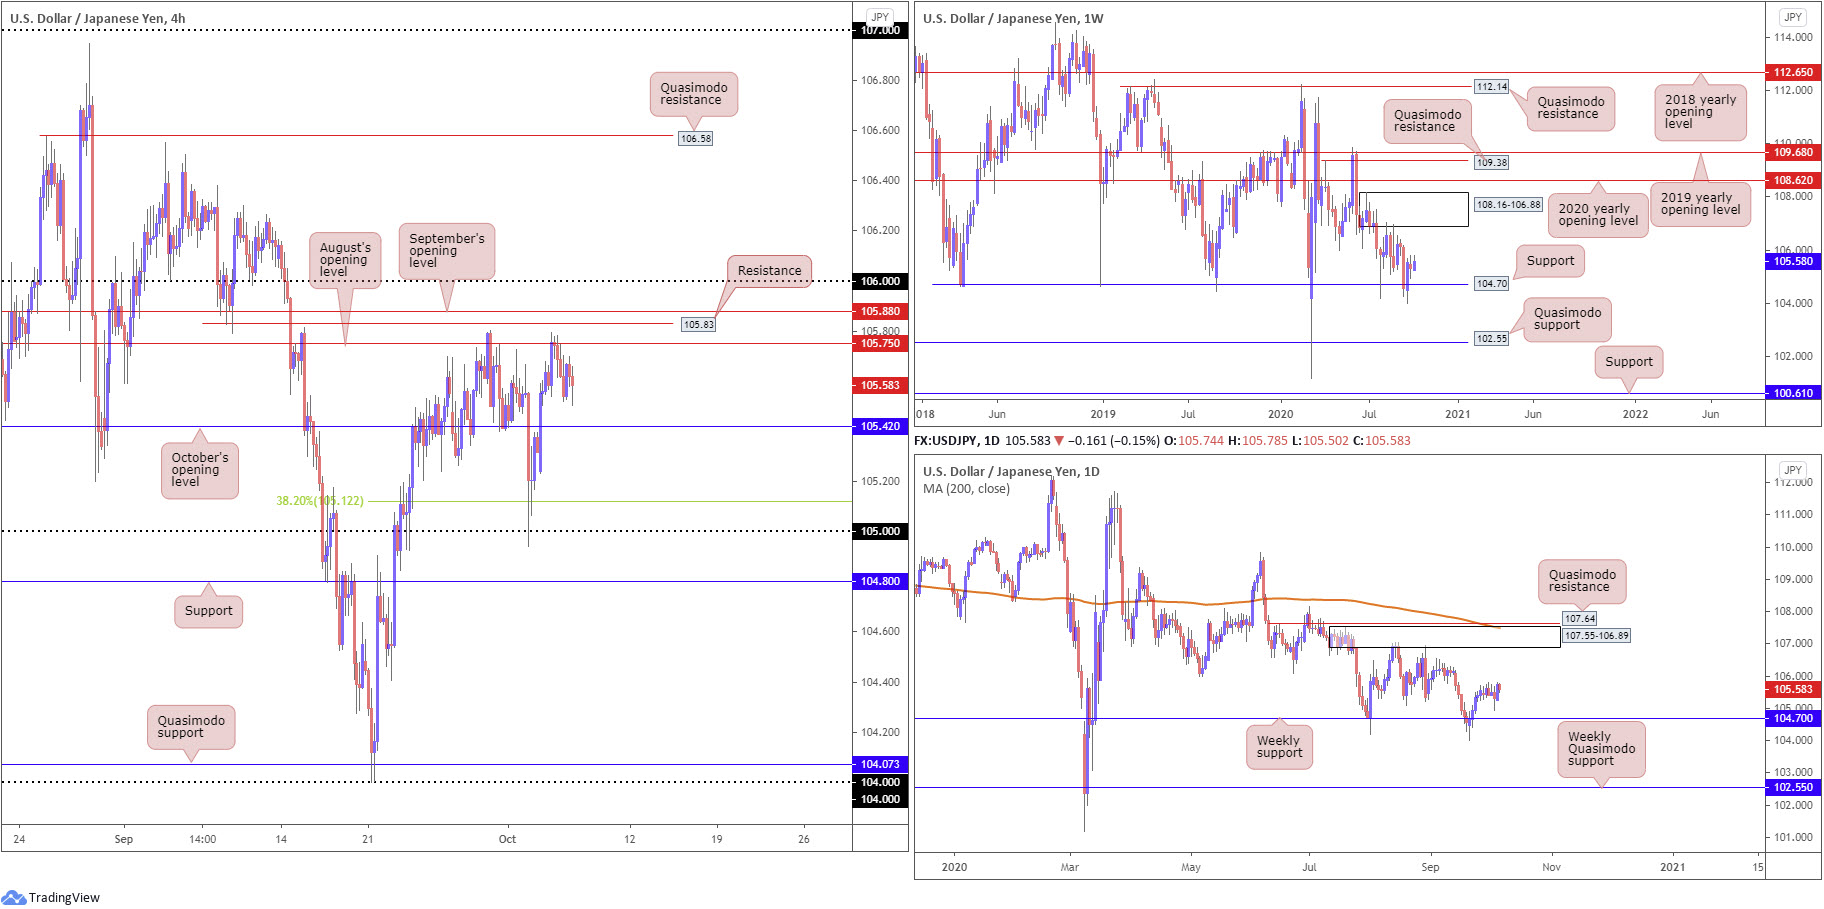
USD/JPY modestly snapped back on Tuesday, replying to August’s opening value at 105.75 on the H4 and shifting October’s opening value at 105.42 back into the limelight. The reaction from 105.75 is not really a surprise given the level served sellers well heading into the closing stages of September.
H4 resistance is seen just above 105.75 at 105.83, along with September’s opening value at 105.88 and the round number 106.
From the weekly timeframe (unchanged since Monday’s weekly report):
Supply at 108.16-106.88 remains prominent on the weekly timeframe, capping upside since price made its way off support at 104.70 at the end of July. The aforementioned support also recently made a second showing, with price rebounding nearly 1%. Both areas, therefore, remain firmly on the watchlist. Quasimodo support at 102.55 offers a feasible target beyond current support in the event we turn south, while removing supply draws the 2020 yearly opening value at 108.62 into the fight.
From the daily timeframe (unchanged since Monday’s weekly report):
Supply at 107.55-106.89, an area housed within the lower boundary of weekly supply mentioned above at 108.16-106.88, remains on the radar. Upside momentum derived from weekly support at 104.70 highlights the possibility of readdressing the aforementioned supply. Of note, the daily area also benefits from nearby Quasimodo resistance at 107.64 and the 200-day SMA (orange – 107.48).
Areas of consideration:
Despite August’s opening value at 105.75 capping upside Tuesday, a pop to H4 resistance at 105.83 (a prior Quasimodo support level) and September’s opening value at 105.88 is still in the table, which may draw in mild selling interest.
According to the higher timeframes, however, bulls may eventually take over until reaching around the 106.88/89ish region (the lower edges of higher timeframe supply). Consequently, breakout moves above 106 are also still likely watched going forward.
USD/CAD:
[Bloomberg] President Donald Trump told his negotiators to stop talks with Democratic leaders on a fiscal stimulus package, hours after Federal Reserve Chair Jerome Powell’s strongest call yet for greater spending to shore up the economic recovery.
“I have instructed my representatives to stop negotiating until after the election when, immediately after I win, we will pass a major Stimulus Bill that focuses on hardworking Americans and Small Business,” Trump said Tuesday in a tweet.
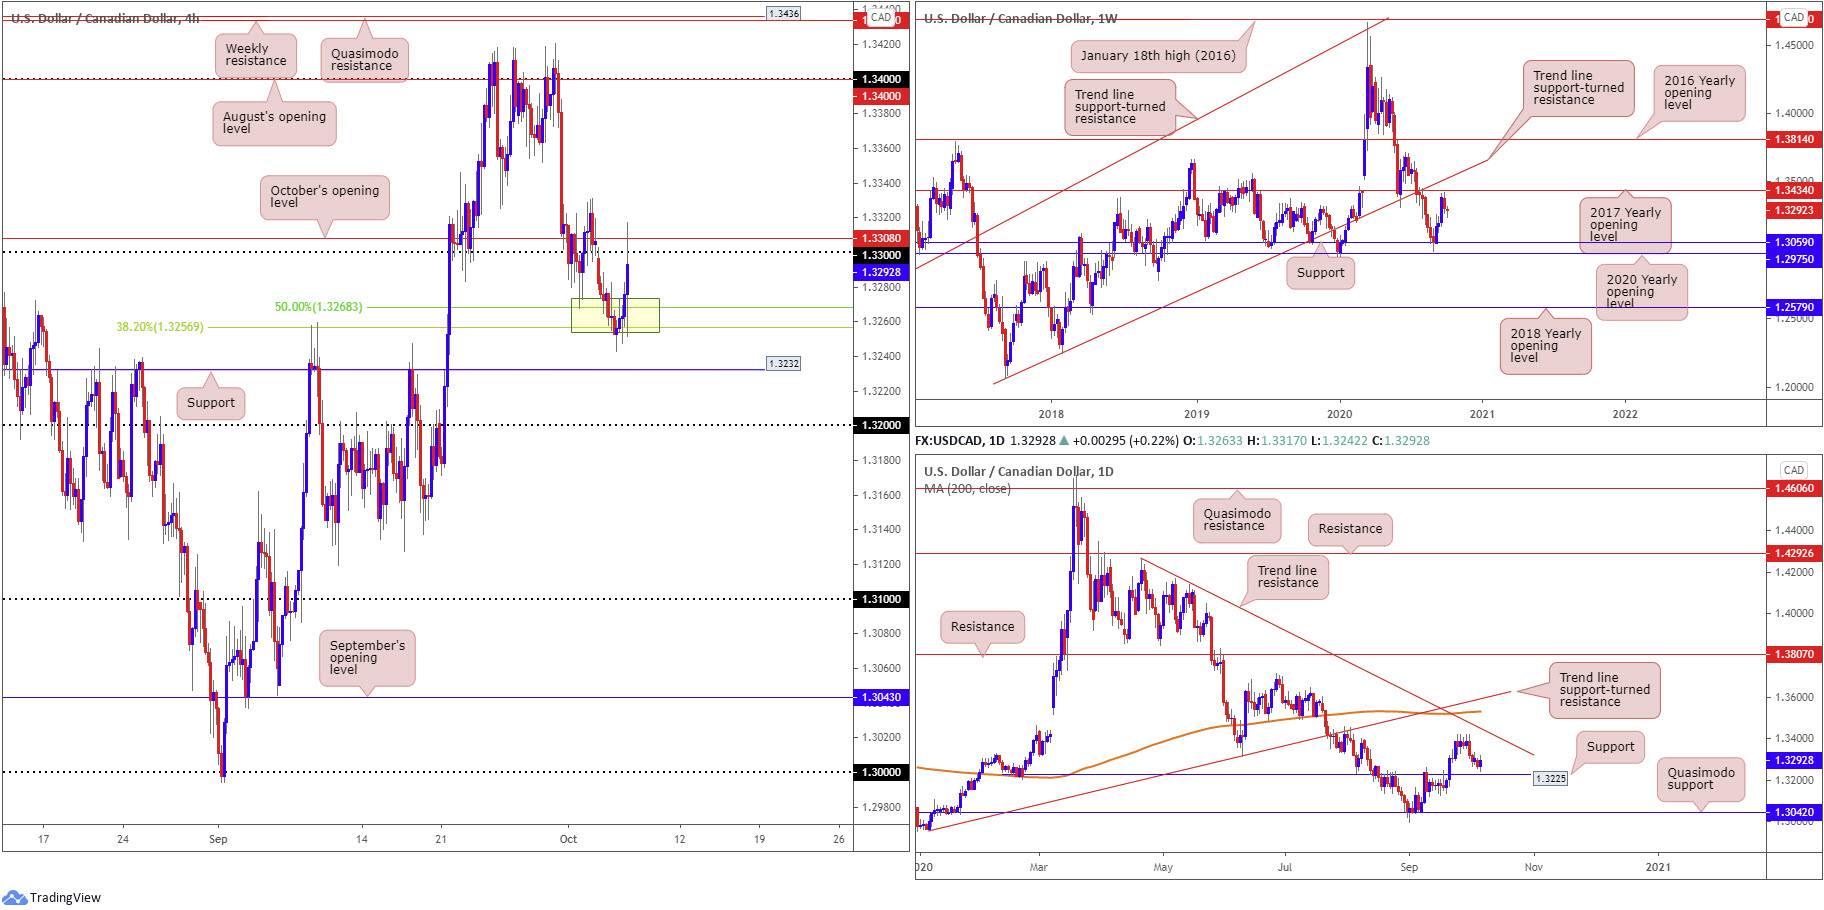
Risk assets took a hit following the above, jolting USD bulls against the Canadian dollar. Technically, this helped USD/CAD defend the current H4 Fib combination (38.2% Fibonacci retracement ratio at 1.3256/50.0% retracement ratio at 1.3268 – yellow). As you can see, trade is now testing the mettle of 1.33 and October’s opening value at 1.3308.
Further afield on the weekly timeframe, price recently came within touching distance of the 2017 yearly opening value at 1.3434 (sited just under trend line support-turned resistance, taken from the low 1.2061). Follow-through selling on the weekly timeframe could eventually tug the currency pair back to support at 1.3059, pinned just north of the 2020 yearly opening value at 1.2975.
Daily price demonstrates room for sellers to push for support coming in at 1.3225. Resistance on the daily timeframe, nonetheless, is not expected to make an appearance until trend line resistance, etched from the high 1.4265. Directly above here also rests the 200-day SMA (orange – 1.3530) and a trend line support-turned resistance, taken from the low 1.2957.
Areas of consideration:
- Extending recovery gains out of 1.3256/1.3268 on the H4 and taking the candles above October’s opening value at 1.3308 might be enough of a spark to encourage further buying, with room to reach 1.34/August’s opening value.
- Another H4 level worth taking into account, in the event upside levels off, is support priced in at 1.3232, owing to the base fusing with daily support at 1.3225.
USD/CHF:
Recent hours witnessed broad USD upside take over as risk assets tumbled amid news US President Trump instructed representatives to stop talks with Democratic leaders on a fiscal stimulus package.
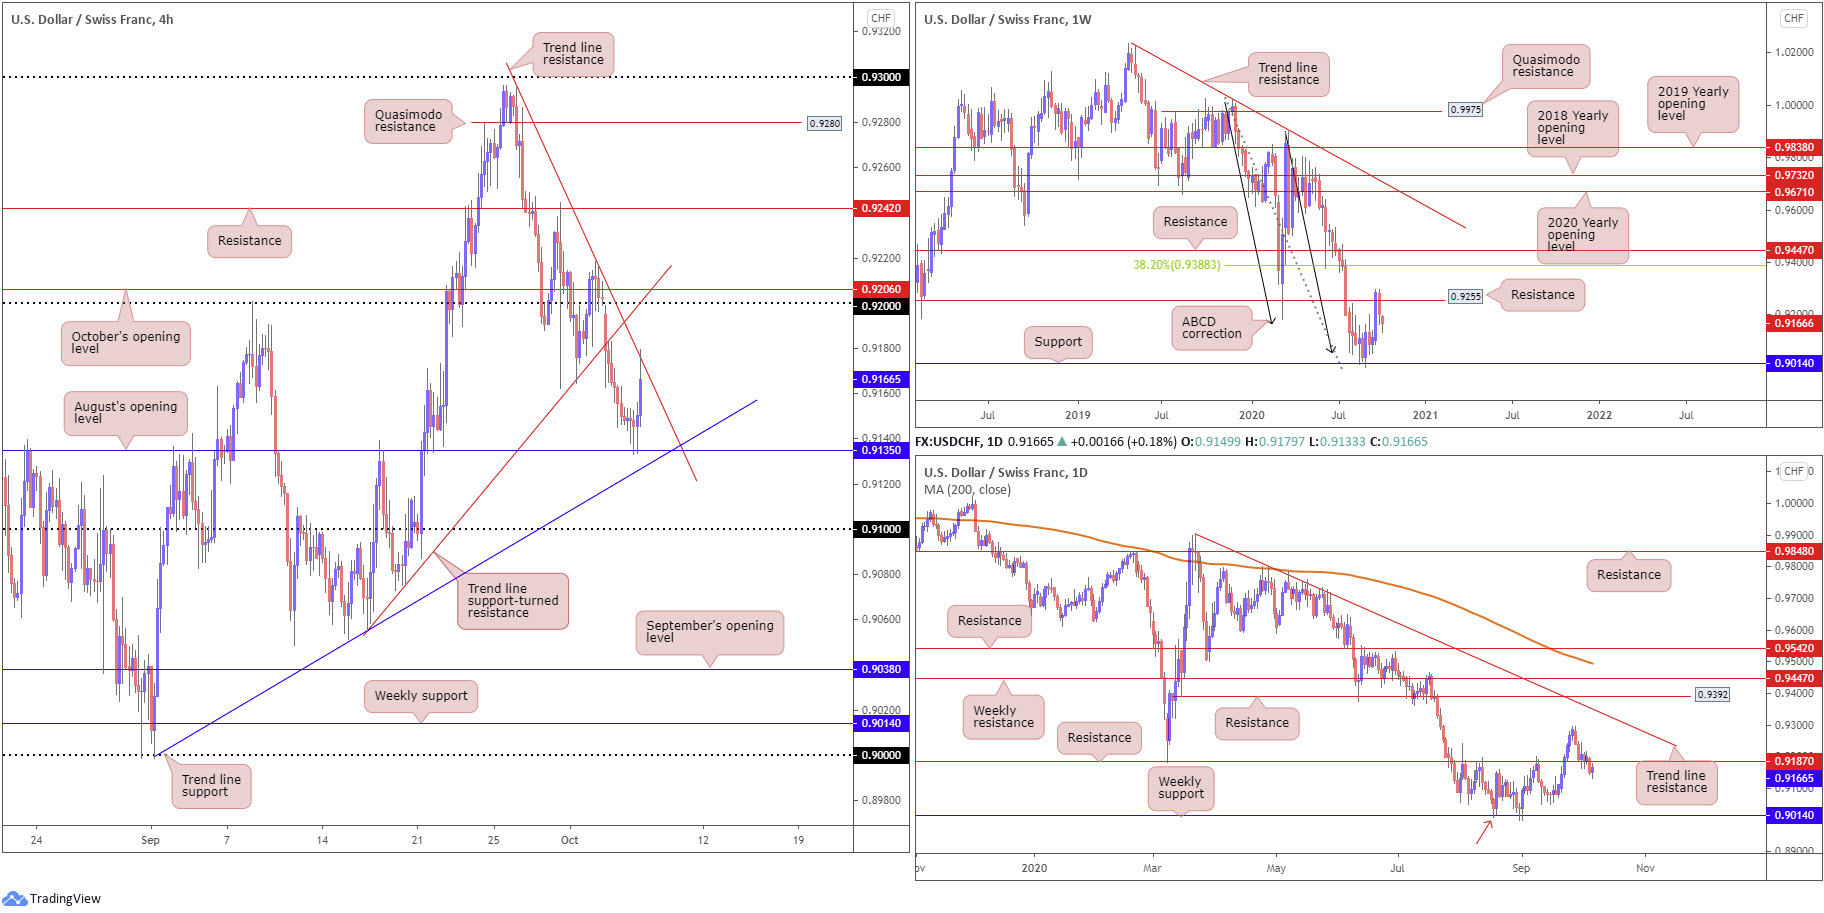
Technically, this led USD/CHF off August’s opening value at 0.9135 on the H4 (sited just north of trend line support [0.8998]) to test trend line resistance, extended from the high 0.9295. A break beneath 0.9135 could propel things towards the 0.91 barrier, whereas seeking higher levels above current trend line resistance throws the 0.92 handle into the pot as possible resistance.
The weekly timeframe’s technical picture is little changed. Resistance at 0.9255 (a previous Quasimodo support level) recently put in an appearance. This follows a recent rebound from support at 0.9014, potentially gleaning additional impetus from ABCD support at 0.9051 (black arrows). Should buyers regain consciousness, the focus above current resistance falls in at a 38.2% Fibonacci retracement ratio at 0.9388, a common take-profit target out of ABCD patterns (derived from legs A-D).
Turning to the daily timeframe shows price action hovering under recently penetrated support at 0.9187 (now serving as potential resistance), a critical level during August and September. Dropping through this support potentially offers an early cue to further weakness on the weekly timeframe, targeting the aforementioned weekly support (also stands as a Quasimodo support on the daily chart – red arrow).
Areas of consideration:
(Following on from Tuesday’s outlook)
According to the higher timeframes, H4 is still likely headed south of 0.9135. The test of H4 trend line resistance (0.9295), therefore, might interest intraday sellers today.
A break beyond H4 trend line support (0.8998) may also catch the attention of intraday breakout sellers, targeting 0.91 as an initial take-profit target.
Dow Jones Industrial Average:
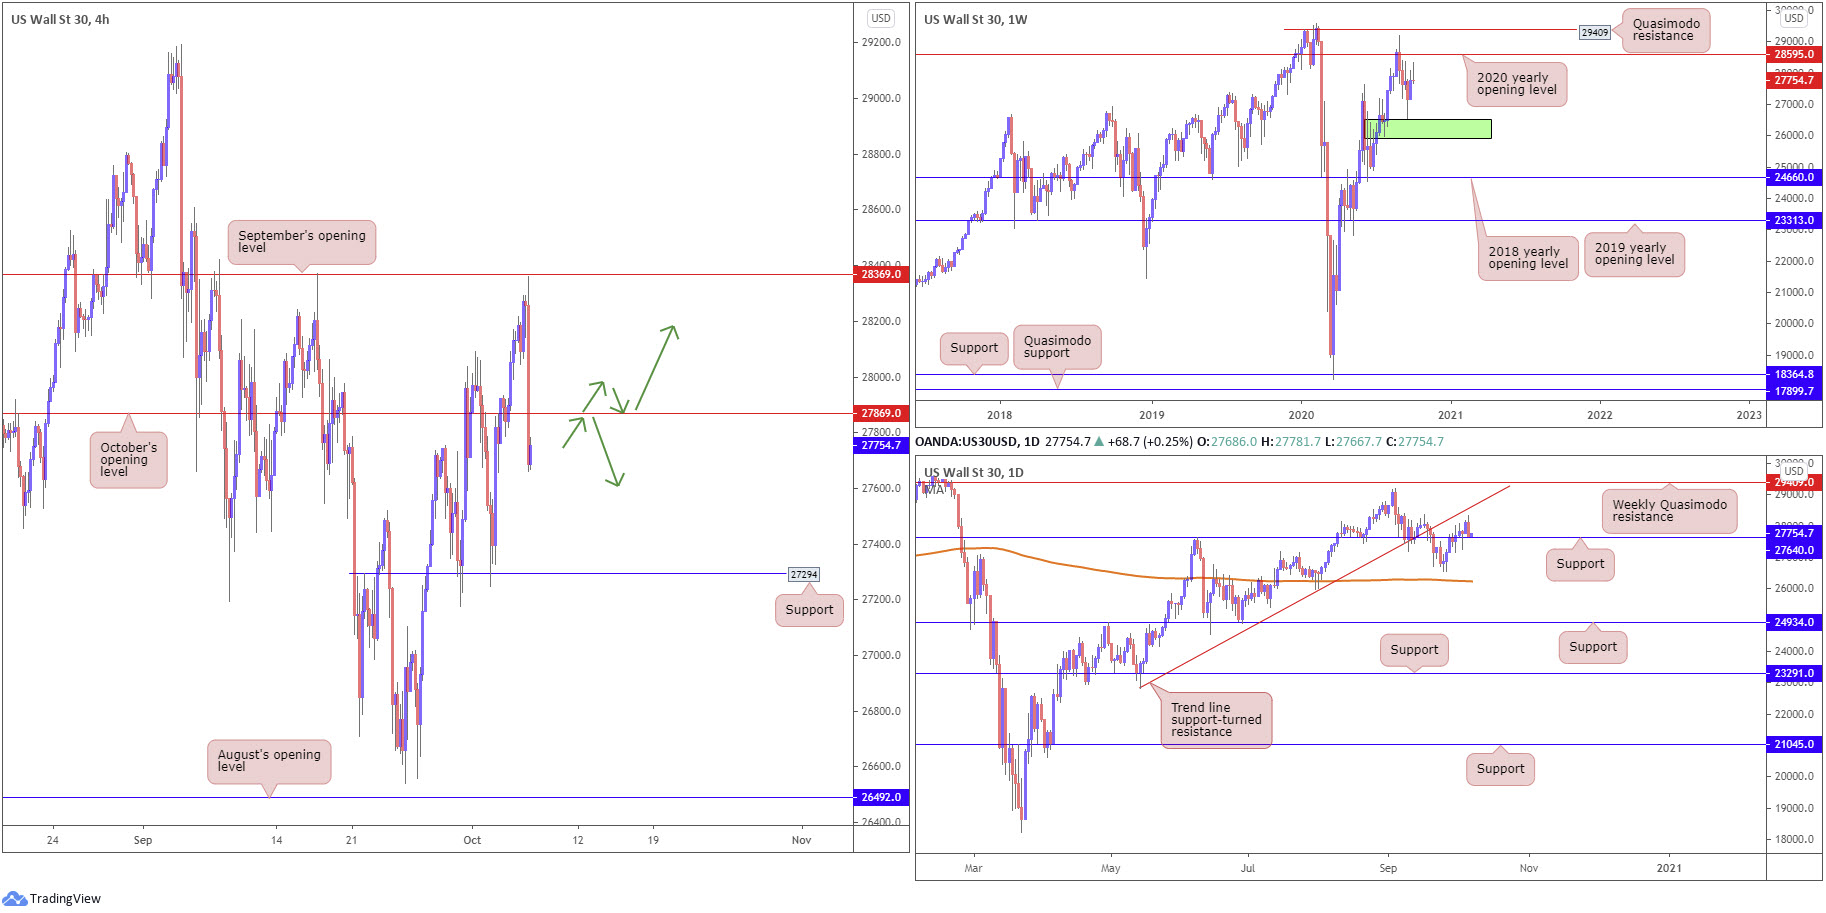
US equities tumbled Tuesday after US President Donald Trump called off Stimulus talks. The Dow Jones Industrial Average declined 375.88 points, or 1.34%; the S&P 500 dropped 47.68 points, or 1.40% and the Nasdaq traded lower by 177.88 points, or 1.57%.
From a technical standpoint, weekly price, thanks to recent selling, trades considerably off best levels south of the 2020 yearly opening value at 28595. To the downside, demand rests (green) at 25916-26523. From the daily timeframe, after putting in a bearish outside reversal candle yesterday ahead of a trend line support-turned resistance, extended from the low 22803, support at 27640 is within striking distance.
Across the page, H4 shows price fell sharply a few points south of September’s opening value at 28369 on Tuesday, blowing through October’s opening value at 27869. This, assuming daily support at 27640 is overrun, sets the technical stage for an approach to H4 support priced in at 27294.
Areas of consideration:
Daily support at 27640 is likely to deter H4 sellers from taking action under October’s opening value at 27869, despite the H4 chart exhibiting scope to drop as far south as support at 27294. A retest at 27869, followed up with a H4 bearish candlestick signal, however, might see some sellers take the plunge. Another scenario, of course, is daily buyers force H4 back above 27869, a move that may see H4 buyers jump on board to target September’s opening value at 28369.
XAU/USD (GOLD):
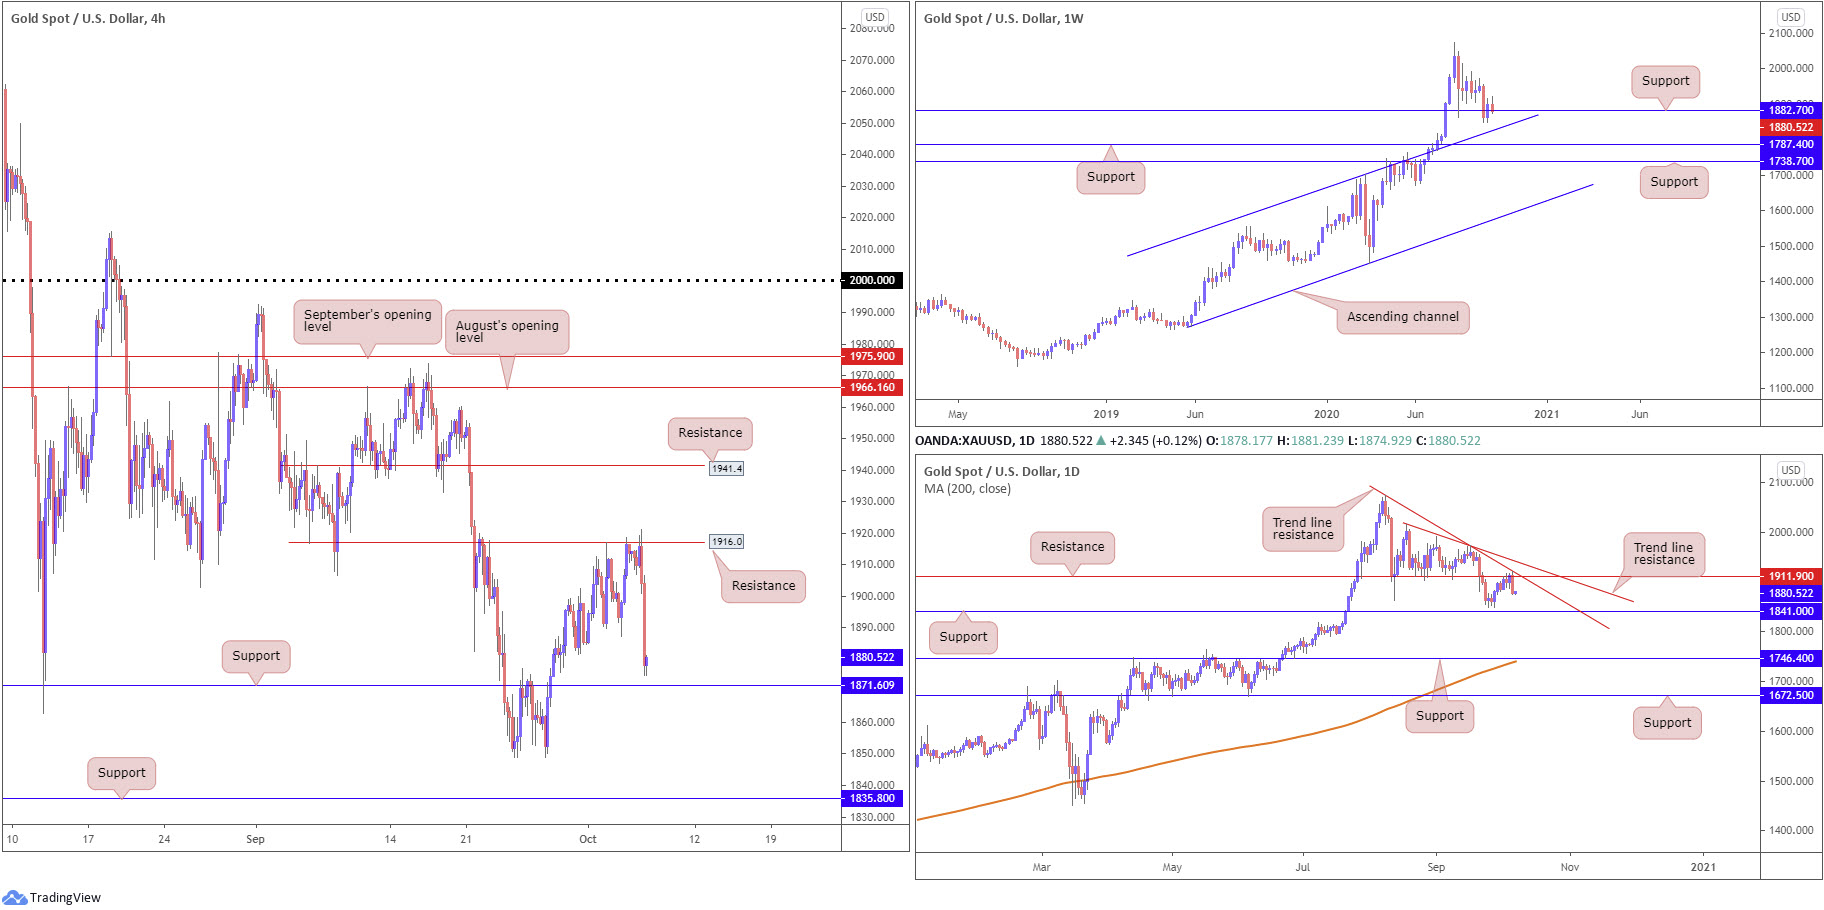
Bullion suffered Tuesday, down nearly 2% against the US dollar, as the precious metal fell victim to strong USD bidding amid risk aversion.
H4 resistance at $1,916 held back buyers, with the candles settling the session just north of H4 support coming in at $1,871. Daily price also receded lower from resistance at $1,911, aided by trend line resistance, extended from the high $2,075. Shaped in the form of a bearish outside day reversal, the daily chart reveals scope to approach support at $1,841.
While both the daily and H4 timeframes eye lower levels, traders might want to take into account that weekly price remains circling a support level at $1,882. In addition to this, the trend in this market has faced decisively north since 2016.
Areas of consideration:
Sellers are likely monitoring H4 support at $1,871 today, as a push through here shines the spotlight on H4 support at $1,835, which sits just under daily support at $1,841 (the next downside target on the daily timeframe). Consequently, a H4 close below $1,871 could trigger bearish scenarios, while a decisive rejection from $1,871 suggests the pendulum may swing in favour of weekly bulls off support at $1,882.
The accuracy, completeness and timeliness of the information contained on this site cannot be guaranteed. IC Markets does not warranty, guarantee or make any representations, or assume any liability regarding financial results based on the use of the information in the site.
News, views, opinions, recommendations and other information obtained from sources outside of www.icmarkets.com.au, used in this site are believed to be reliable, but we cannot guarantee their accuracy or completeness. All such information is subject to change at any time without notice. IC Markets assumes no responsibility for the content of any linked site.
The fact that such links may exist does not indicate approval or endorsement of any material contained on any linked site. IC Markets is not liable for any harm caused by the transmission, through accessing the services or information on this site, of a computer virus, or other computer code or programming device that might be used to access, delete, damage, disable, disrupt or otherwise impede in any manner, the operation of the site or of any user’s software, hardware, data or property.


