
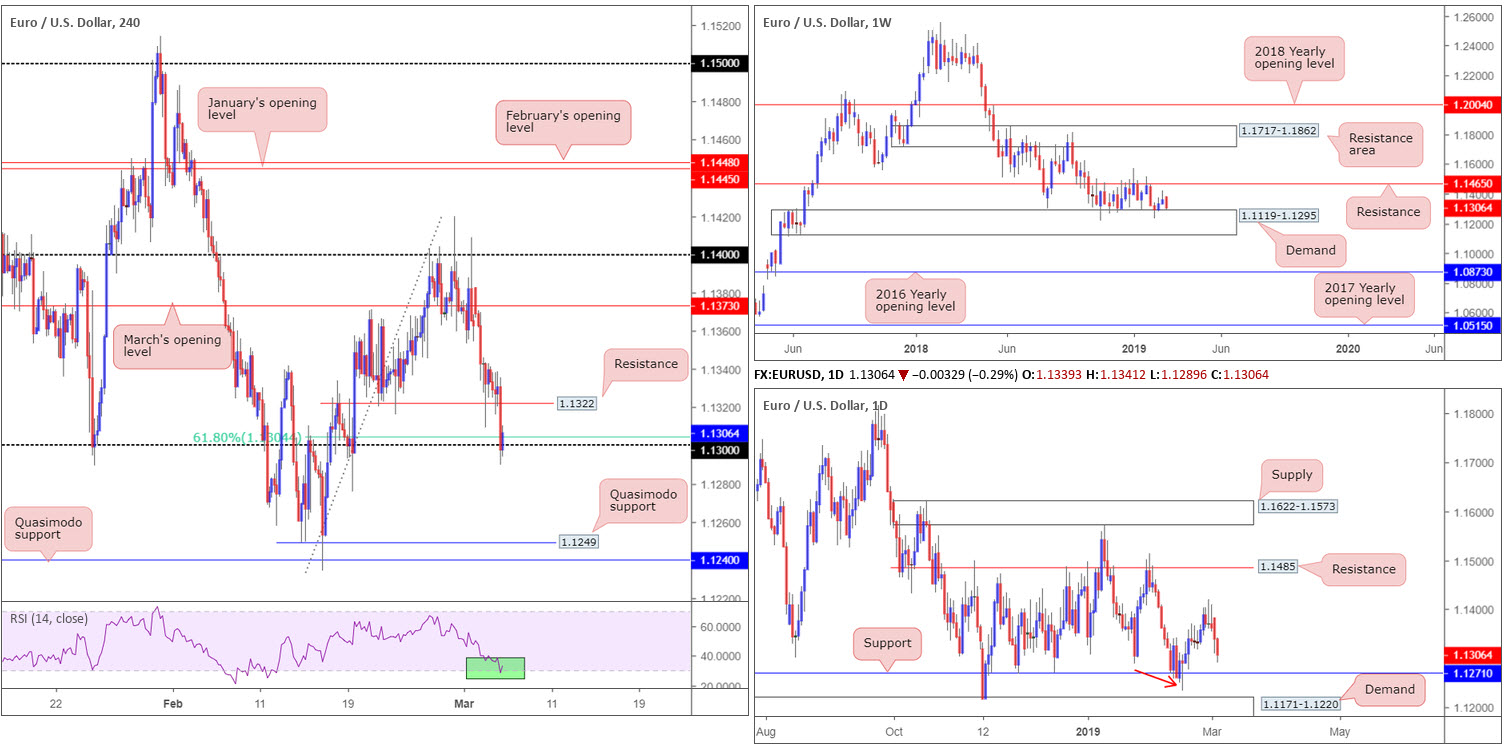
EUR/USD:
The US (February) ISM non-manufacturing index 59.7 vs. 57.4 expected was a major catalyst behind the greenback’s gains Tuesday, which tested highs of 97.01. Feeding off of the US dollar’s advance, the single currency plunged lower and settled a few pips north of 1.13 on the H4 timeframe, despite surpassing the number in early US hours. Traders may also want to acknowledge additional support emerging from a 61.8% H4 Fibonacci value at 1.1304. What’s also notable is the H4 RSI indicator seen displaying an oversold reading (green).
In terms of the bigger picture, the weekly timeframe shows buyers and sellers, since October 2018, have been battling for position between a long-standing support/resistance at 1.1465 and notable demand coming in at 1.1119-1.1295. As of Tuesday, the pair is seen testing the top edge of the said demand area. Overall, however, the trend continues to face a southerly direction on this timeframe, with the possibility of a subsequent lower low forming in the future.
The picture on the daily timeframe has support at 1.1271 in view, following yesterday’s decline. Concerning trend structure, though, the chart demonstrates potential to push beyond the noted support (given the recent lower low at 1.1234 [red arrow]), possibly into the walls of demand plotted at 1.1171-1.1220.
Areas of consideration:
The 1.13 handle, as underlined in Tuesday’s analysis, is an area buyers are likely to make an appearance. Not only has it additional support from the 61.8% H4 Fibonacci mentioned above at 1.1304, it’s also further bolstered by the top edge of weekly demand at 1.1295. A long from 1.13 would, according to our technical studies, have an initial upside target of 1.1373 (March’s opening level), though clearing 1.1322 is the first port of call, and possibly a cue to consider reducing risk to breakeven.
In regards to entry, the research team felt 1.1295 is high probability, with a stop-loss placement at 1.1274 (beneath the 1.1276 Feb 19 low). Well done to any of our readers who managed to jump aboard this move as price is, at the time of writing, in profit and poised to challenge 1.1322.
Today’s data points: US ADP Non-Farm Employment Change; FOMC Member Williams Speaks.
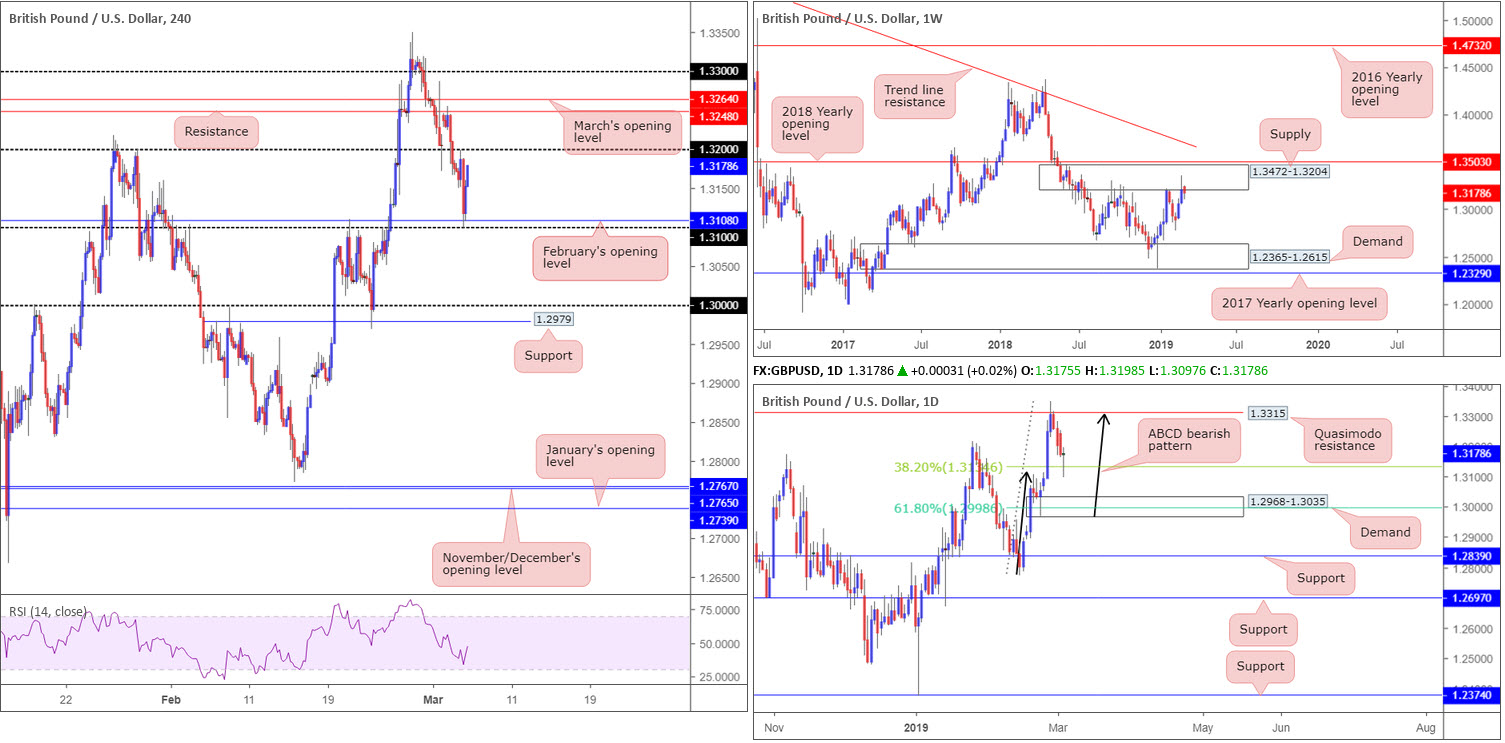
GBP/USD:
Tuesday’s headline seasonally adjusted IHS Markit/CIPS UK services PMI business activity Index registered 51.3 in February, up from a two-and-a-half year low of 50.1 in January. Though the release sparked a round of buying, price swiftly pared gains after topping a couple of pips ahead of 1.32 on the H4, and continued to press for lower ground until shaking hands with 1.31.
1.31 is, as you can see on the daily timeframe, connected closely to a 38.2% Fibonacci support value at 1.3134, which is considered the first take-profit target for those short the ABCD bearish pattern (black arrows)/Quasimodo resistance at 1.3315. Weekly movement, on the other hand, remains engaging with the lower edge of supply pictured at 1.3472-1.3204 (positioned just south of the 2018 yearly opening level at 1.3503).
Areas of consideration:
While the market trades from weekly supply, traders have to contemplate the fact the daily ABCD bearish pattern off the daily Quasimodo resistance may have completed as the first take-profit target: the 38.2% Fibonacci support was achieved yesterday. Therefore, it is possible the market could observe a push higher into the said weekly supply.
A response from the underside of 1.32 may develop again today on the H4, given its history. Aside from this, though, limited confluence exists here. Above this number, March’s opening level at 1.3264 and H4 resistance at 1.3248 is an interesting zone, though again, holds little in terms of additional confluence.
Today’s data points: MPC Members Cunliffe and Saunders Speak; US ADP Non-Farm Employment Change; FOMC Member Williams Speaks.
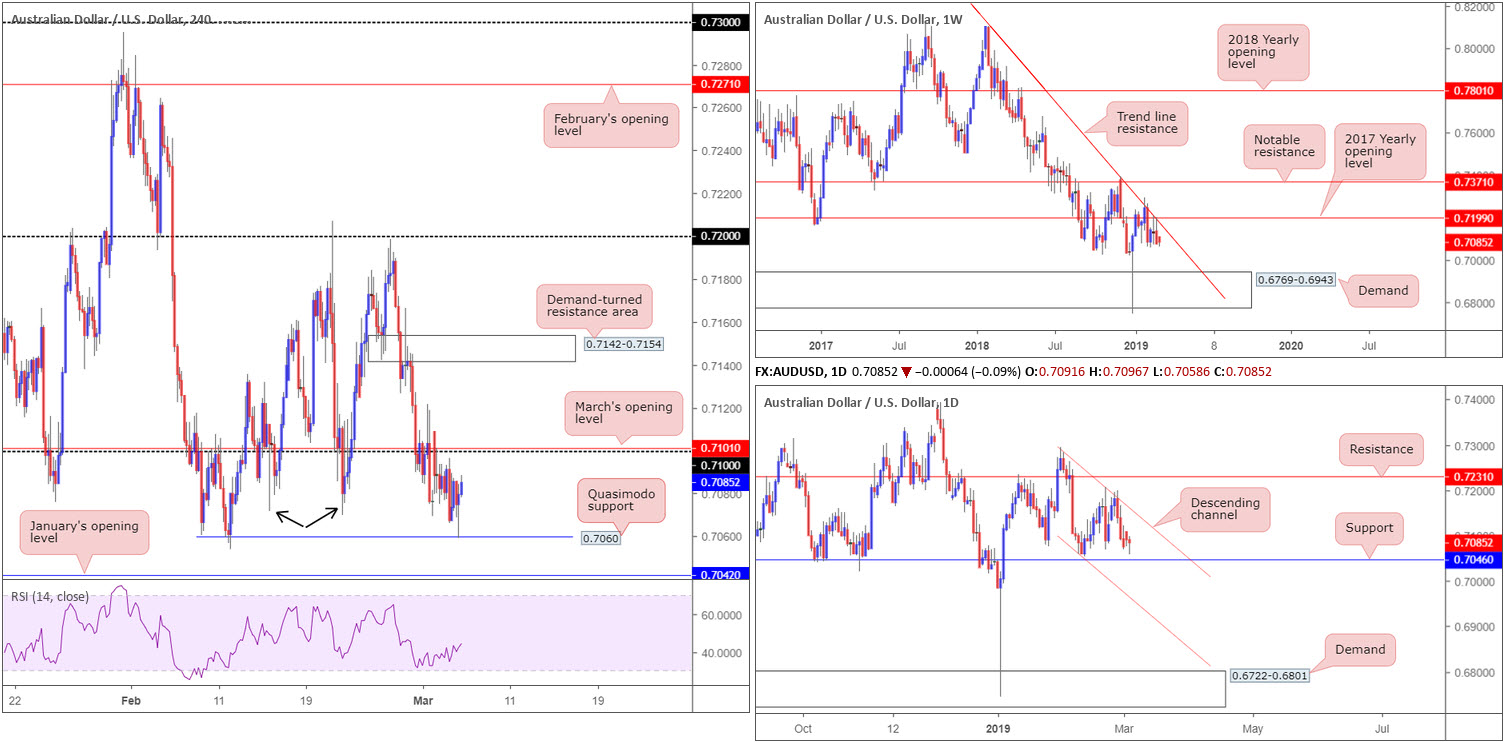
AUD/USD:
H4 Quasimodo support at 0.7060 nudged its way into the spotlight Tuesday, following a break of 0.7072ish: a double bottom support (black arrows). Technically speaking, stop-loss orders were likely taken from those looking to trade the double-bottom formation and used as liquidity to buy from the Quasimodo. Buyers’ stop-loss orders, when filled, automatically become sell orders.
The response from 0.7060 has thus far been strong. The next area of concern is not expected to enter the frame until around 0.71/March’s opening level at 0.7101. Above this point, the runway is also reasonably clear until reaching a demand-turned resistance area coming in at 0.7142-0.7154.
From a technical standpoint, nevertheless, the research team is wary of such high levels. The reasoning lies within higher-timeframe structure.
Weekly flow is contained by the 2017 yearly opening level at 0.7199 and merging trend line resistance (taken from the 2018 yearly high of 0.8135). This coupled with downside displaying room to press as far south as demand at 0.6769-0.6943 on this timeframe, sellers appear to have the upper hand this week.
Daily action is compressing within a descending channel (0.7295/0.7060) and has notable support eyed at 0.7046 as the next downside target. This level boasts reasonably clean history dating as far back as late August 2015.
Areas of consideration:
Despite both weekly and daily timeframes suggesting a move lower, the likelihood of H4 action filling orders around 0.71 is high. This is, in fact, a potential sell zone (stop-loss placement above the 0.7121 March high), targeting January’s opening level at 0.7042, which, in our humble view, is also good for a potential long play, having seen daily support form four pips above the level at 0.7046. Like the buy from 0.7060, though, a bounce is all that is expected from 0.7042, as you will effectively be entering long into weekly selling. As for stop-loss placement, beneath H4 demand at 0.7026-0.7049 is an option (taken from Jan 4 2019), with an expectation of price reclaiming 0.7060 (at this point this level would be resistance).
Today’s data points: US ADP Non-Farm Employment Change; FOMC Member Williams Speaks.
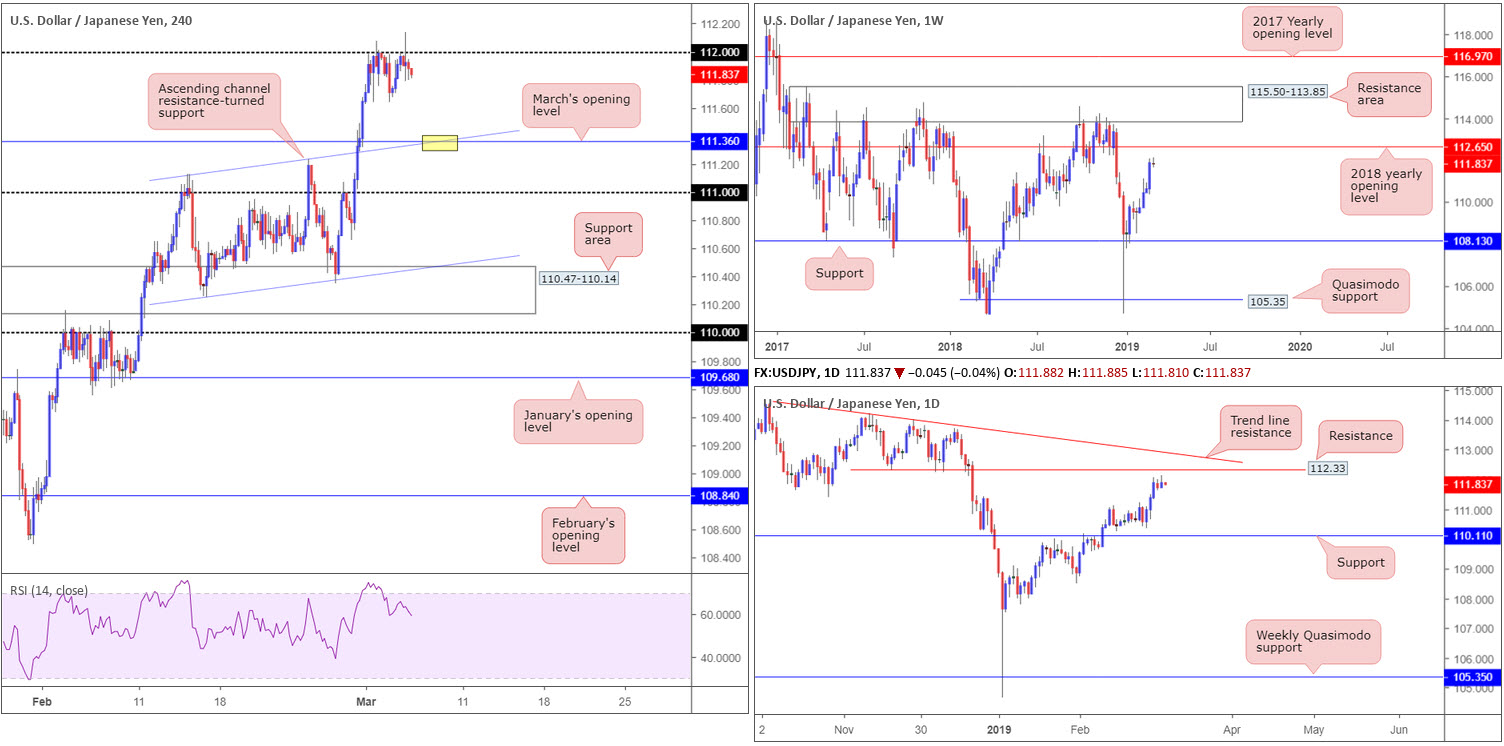
USD/JPY:
Despite the buck outperforming major rivals for a fifth consecutive day, the Dow Jones Industrial Average and the USD/JPY concluded Tuesday flat.
The H4 candles, as you can see, continues to hug the underside of 112 as resistance. Assuming further selling takes form today and possibly into the week, price will likely shake hands with March’s opening level drawn from 111.36, which links closely with an ascending channel resistance-turned support (taken from the high 111.12).
Pivotal resistance at 112.65 (the 2018 yearly opening level) is seen on the weekly timeframe, demonstrating this market still has room to advance. The story on the daily timeframe shows price consolidating south of resistance pencilled in at 112.33, followed by trend line resistance extended from the high 114.23.
Areas of consideration:
On account of the above reading, there’s a chance the market may observe sellers push lower from 112 and possibly bring the H4 candles towards March’s opening level at 111.36. This barrier, particularly at the point the channel support merges with the level (yellow), is an interesting buy zone given we have room to move higher on the weekly timeframe to at least 112.65.
For traders wishing for a little more confirmation out of 111.36, waiting for a H4 bullish candlestick formation to come about is an option. Not only will the candlestick signal identify buyer intent, it’ll serve as a guide for entry and risk levels.
Today’s data points: US ADP Non-Farm Employment Change; FOMC Member Williams Speaks.
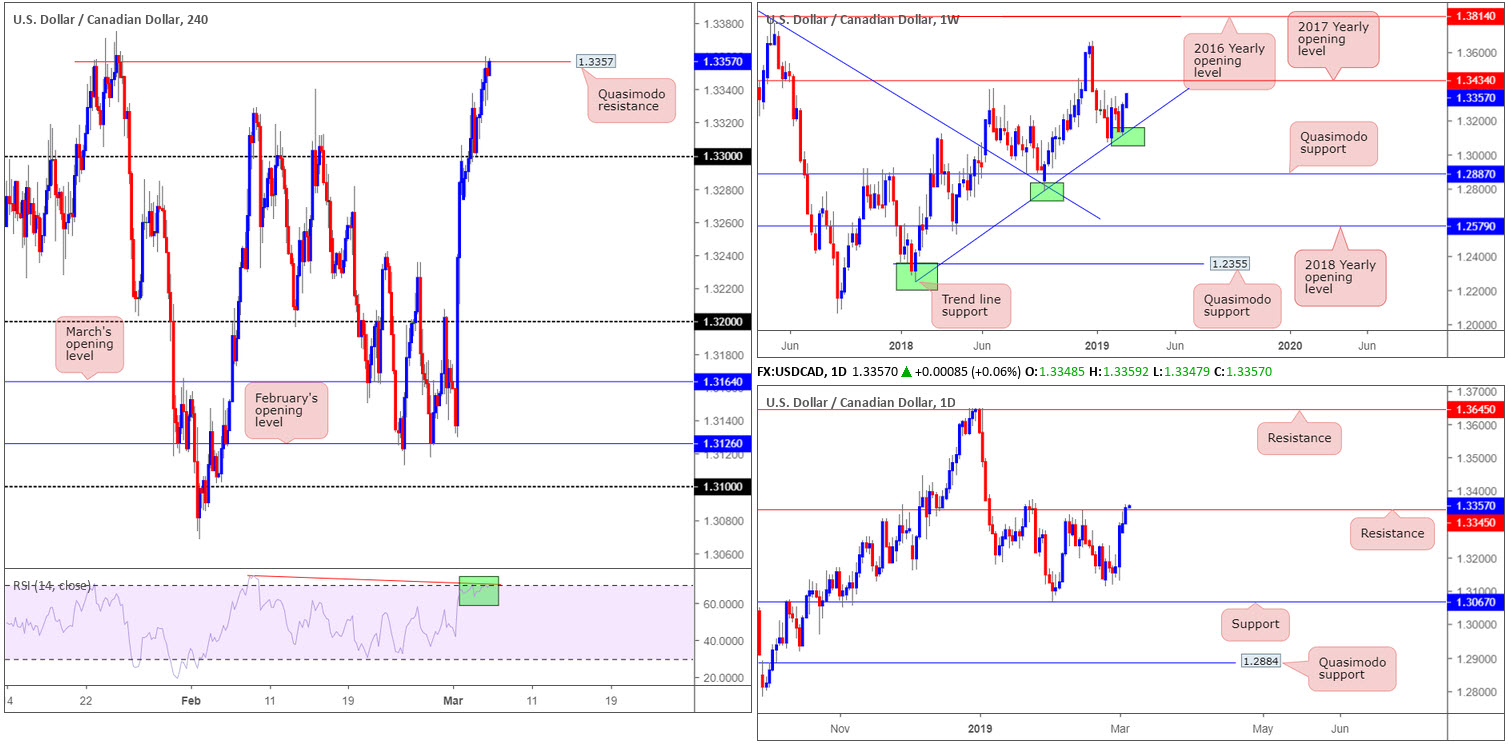
USD/CAD:
The US dollar reigned supreme over the majority of its G10 peers Tuesday. The combination of a healthy USD and a waning oil market from $57.15 lifted the USD/CAD to highs of 1.3360.
With respect to the weekly timeframe, additional upside likely lies ahead. Shaped in the form of a clear-cut bullish engulfing candle off trend line support (extended from the low 1.2247) last week, the market continues to run for higher ground, with the next resistance target seen around the 2017 yearly opening level priced in at 1.3434.
What’s interesting on the daily timeframe, however, is resistance at 1.3345 is being tested. Although we’re marginally above this level, at the time of writing, resistance levels are NOT fixed price points in the market, they’re more of a zone. Therefore, counting the sellers out of the fight because of a 10-pip breach on the daily timeframe is not recommended.
A closer look at price action on the H4 timeframe has the candles crossing swords with Quasimodo resistance at 1.3357. While a pullback from this level to 1.33 is not out of the question, traders may also want to pencil in the possibility of a run beyond here to 1.34 (not seen on the screen).
Areas of consideration:
According to our technical reading, limited evidence supports the sellers at current price. Yes, we are trading from H4 Quasimodo resistance at 1.3357, and yes we still have daily resistance at 1.3345 in the fight, though the problem with this is there’s been little to no selling – the candlesticks emphasize a bullish tone. On top of this, we have weekly flow portending room to trade higher to 1.3434.
With the above in mind, the research team feels a break above 1.3357 on the H4 timeframe is on the cards. This, followed up with a retest (preferably by way of a H4/H1 bullish candlestick signal as traders can use this structure to define entry and risk levels), is considered a high-probability long, targeting 1.34 on the H4 and then 1.3434 on the weekly timeframe.
Today’s data points: US ADP Non-Farm Employment Change; FOMC Member Williams Speaks; Canadian Trade Balance; BoC Rate Statement and Overnight Rate; Canadian Ivey PMI.
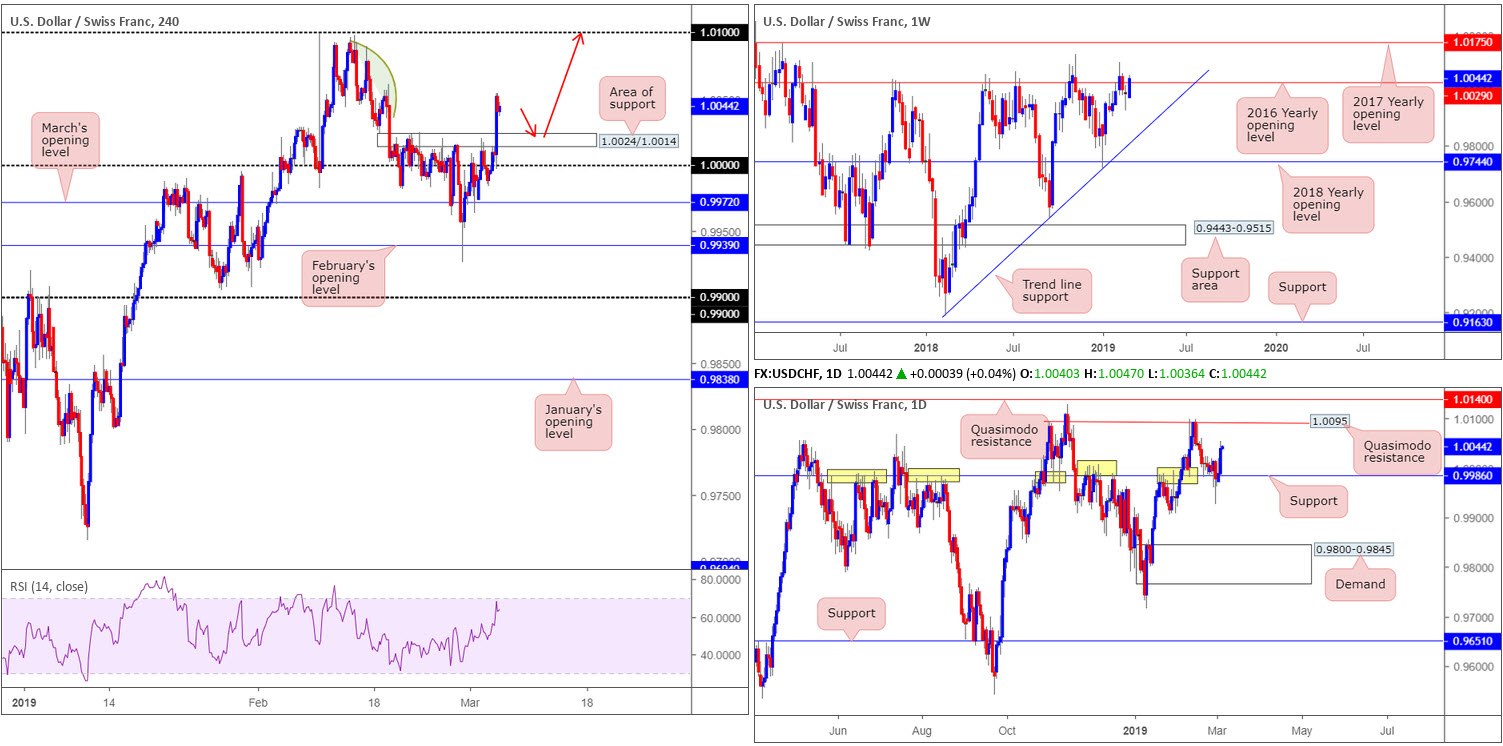
USD/CHF:
Broad-based USD bidding benefitted the USD/CHF Tuesday, following a retest of 1.0000 (parity) on the H4 timeframe. Price, as you can see, responded from this number with strength, consequently clearing orders from a resistance area at 1.0024/1.0014 (now acting support area) and reaching highs of 1.0054. The green arc pattern to the left is there to resemble mildly consumed supply, and highlight the 1.01 handle as the next clear resistance level on the H4 timeframe. A retest of 1.0024/1.0014 as support, therefore, is certainly a possibility today, targeting 1.01.
In conjunction with H4 price, daily activity demonstrates scope to press as far north as Quasimodo resistance at 1.0095, after notable support at 0.9986 survived its latest challenge. 1.0095 held price action lower once already mid-February, therefore it is not a barrier to overlook.
The vibe on the weekly timeframe, nonetheless, is somewhat mixed at the moment. Price action continues to flirt with its 2016 yearly opening level at 1.0029, though appears to be struggling to push lower. As highlighted in the previous weekly briefing, 1.0029’s history as a resistance – dating as far back as February 2016 – still has the potential to draw in sellers.
Areas of consideration:
In light of daily price showing room to move as high as 1.0095 as well as H4 price also favouring a move towards its 1.01 handle, a retest of 1.0024/1.0014 is worthy of interest. Given the threat of possible selling out of the weekly timeframe, however, traders may want to consider waiting for H4 price to print an additional bullish candlestick signal. That way, not only have you identified buyer intent, you also have clear structure to base entry and risk levels from.
Today’s data points: US ADP Non-Farm Employment Change; FOMC Member Williams Speaks.
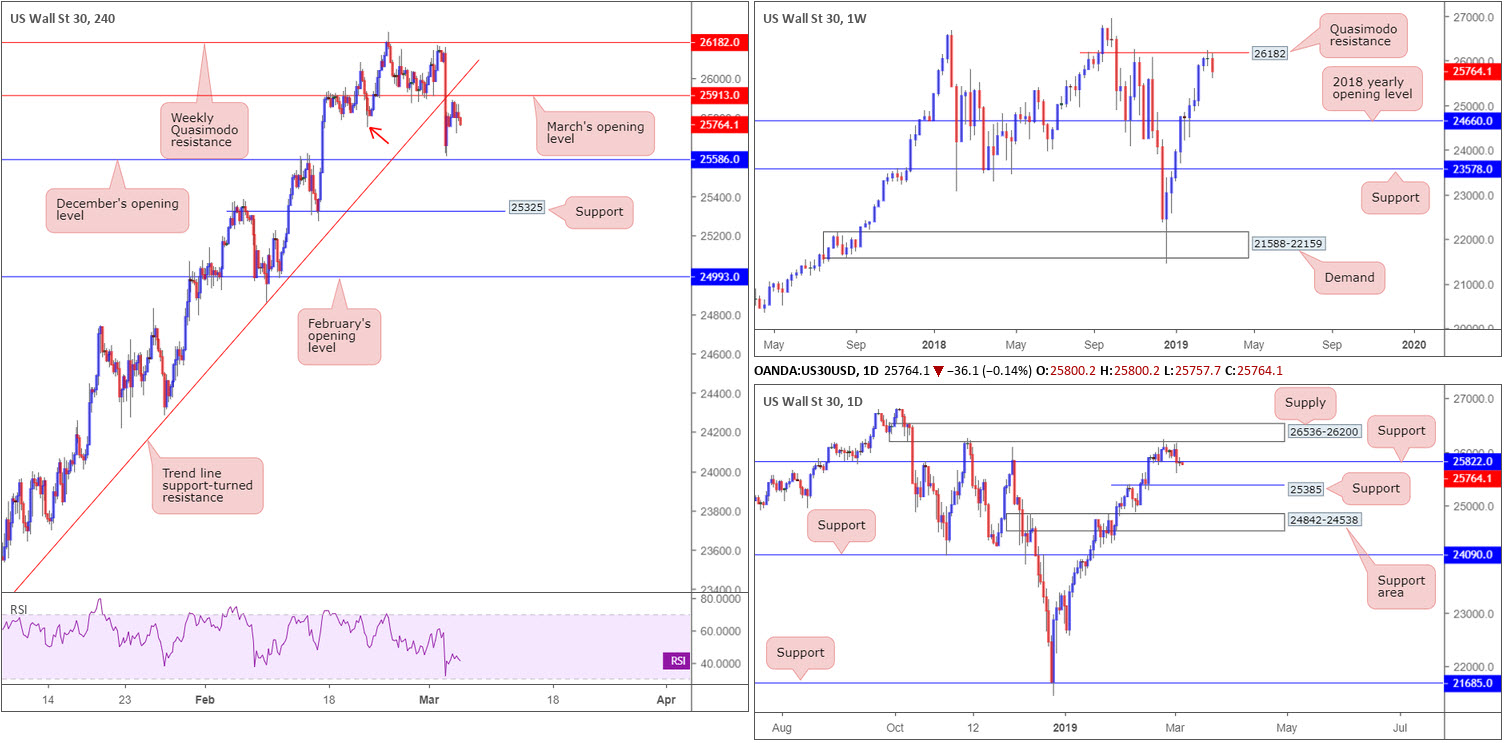
Dow Jones Industrial Average:
Trading volume entered a subdued phase Tuesday, topping a few points south of March’s opening level at 25913 on the H4 timeframe. Having seen Monday’s session chalk up a fresh lower low at 25605, breaking the 25752 Feb 21 low (red arrow), further selling is possible which could lead to a break of December’s opening level at 25586.
Supporting lower prices is the weekly timeframe. Quasimodo resistance at 26182 is in motion, with the next downside objective not seen until crossing paths with the 2018 yearly opening level at 24660. In addition to this, daily price made a run for support at 25822 in recent trade, testing lows of 25605. In the event buyers are consumed here, the next area of concern can be seen around 25385.
Areas of consideration:
Based on weekly price fading Quasimodo resistance and daily sellers making a play for support, H4 sellers are likely looking to enter short from March’s opening level at 25913 today.
For conservative traders concerned about having their stop-loss orders consumed on a fakeout through 25913, waiting for additional candlestick confirmation will help avoid this (entry and stop parameters can be defined according to the candlestick’s rules of engagement).
Today’s data points: US ADP Non-Farm Employment Change; FOMC Member Williams Speaks.
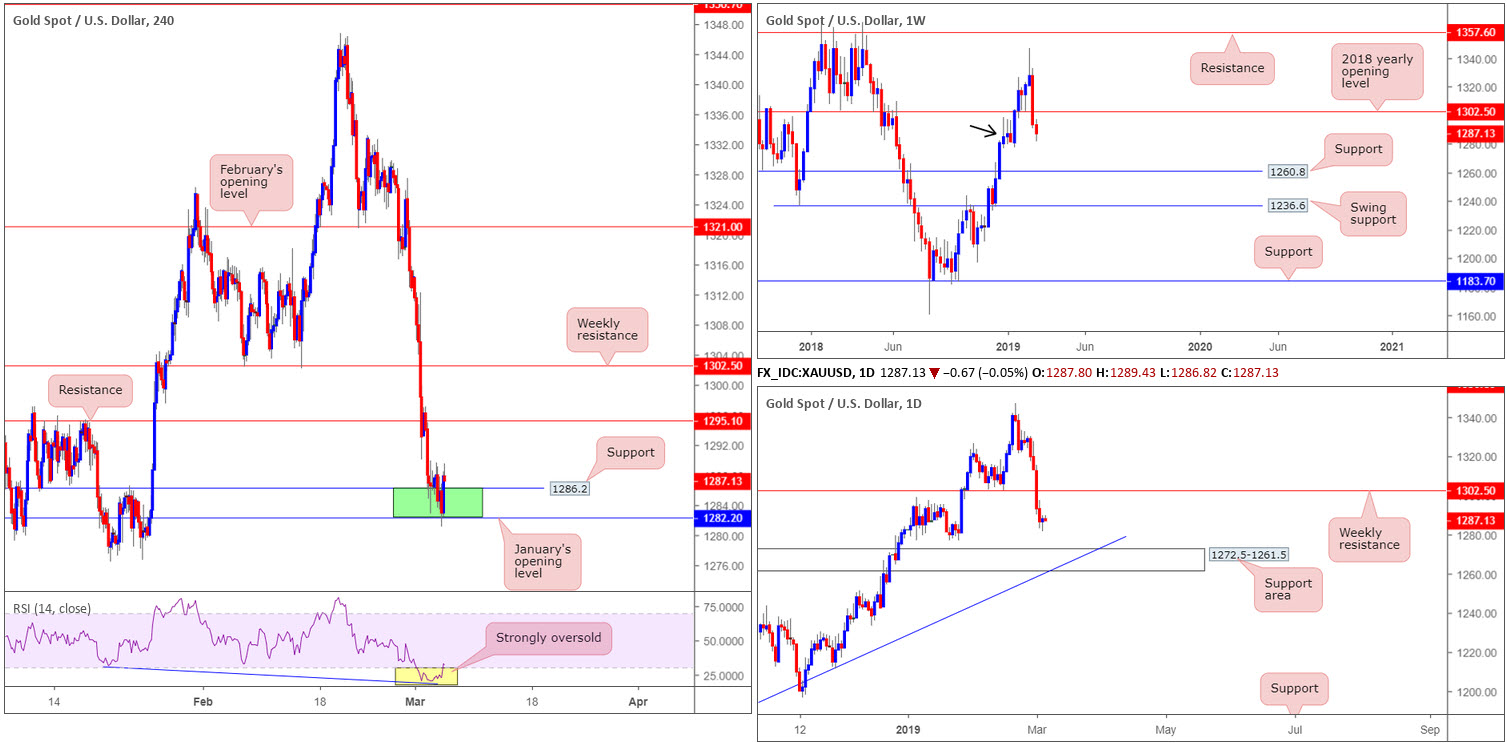
XAU/USD (GOLD):
For those who read Tuesday’s report you may recall the piece highlighting interest out of the green H4 zone at 1282.2/1286.2 (comprised of January’s opening level at 1282.2 and H4 support at 1286.2). As of writing, the area is holding ground, though did suffer a marginal breach to the downside yesterday, likely tripping a portion of stops.
The interest for 1282.2/1286.2 largely stemmed from the weekly timeframe. By way of a near-full-bodied bearish candle, weekly price engulfed the 2018 yearly opening level at 1302.5 in strong fashion last week. Nevertheless, demand is seen in motion around 1276.5-1298.5 (black arrow), which could force a retest of 1302.5 as resistance this week. It’s the demand that caught our interest here. Further adding to this, the H4 RSI indicator still displays a strong oversold/divergence reading.
Beyond the parapets of the current weekly demand, the daily chart has eyes on a support area coming in at 1272.5-1261.5, which happens to align with a trend line support (taken from the low 1160.3).
Areas of consideration:
The green zone on the H4 timeframe at 1282.2/1286.2 remains of interest.
For those already long from the said H4 zone (and survived the move beneath 1282.2 yesterday), the first take-profit target rests around H4 resistance at 1295.1, followed by weekly resistance at 1302.5.
For conservative traders wanting a confirming candlestick signal, recent action printed a H4 bullish engulfing candlestick out of the zone. Trading off its close (1282.9), with stop-loss orders positioned beneath its wick (1282.3), is certainly an option today.
The accuracy, completeness and timeliness of the information contained on this site cannot be guaranteed. IC Markets does not warranty, guarantee or make any representations, or assume any liability with regard to financial results based on the use of the information in the site.
News, views, opinions, recommendations and other information obtained from sources outside of www.icmarkets.com.au, used in this site are believed to be reliable, but we cannot guarantee their accuracy or completeness. All such information is subject to change at any time without notice. IC Markets assumes no responsibility for the content of any linked site. The fact that such links may exist does not indicate approval or endorsement of any material contained on any linked site.
IC Markets is not liable for any harm caused by the transmission, through accessing the services or information on this site, of a computer virus, or other computer code or programming device that might be used to access, delete, damage, disable, disrupt or otherwise impede in any manner, the operation of the site or of any user’s software, hardware, data or property.


