
Key risk events today:
BoJ Gov Kuroda Speaks; US ADP Non-Farm Employment Change; US ISM Non-Manufacturing PMI; Crude Oil Inventories.
(Previous analysis as well as outside sources – italics).
EUR/USD:
The key observation on the US dollar index Tuesday was the failure to hold on to recent gains, dipping under 93.50 as yield on the 10-year Treasury note clocked fresh lows.
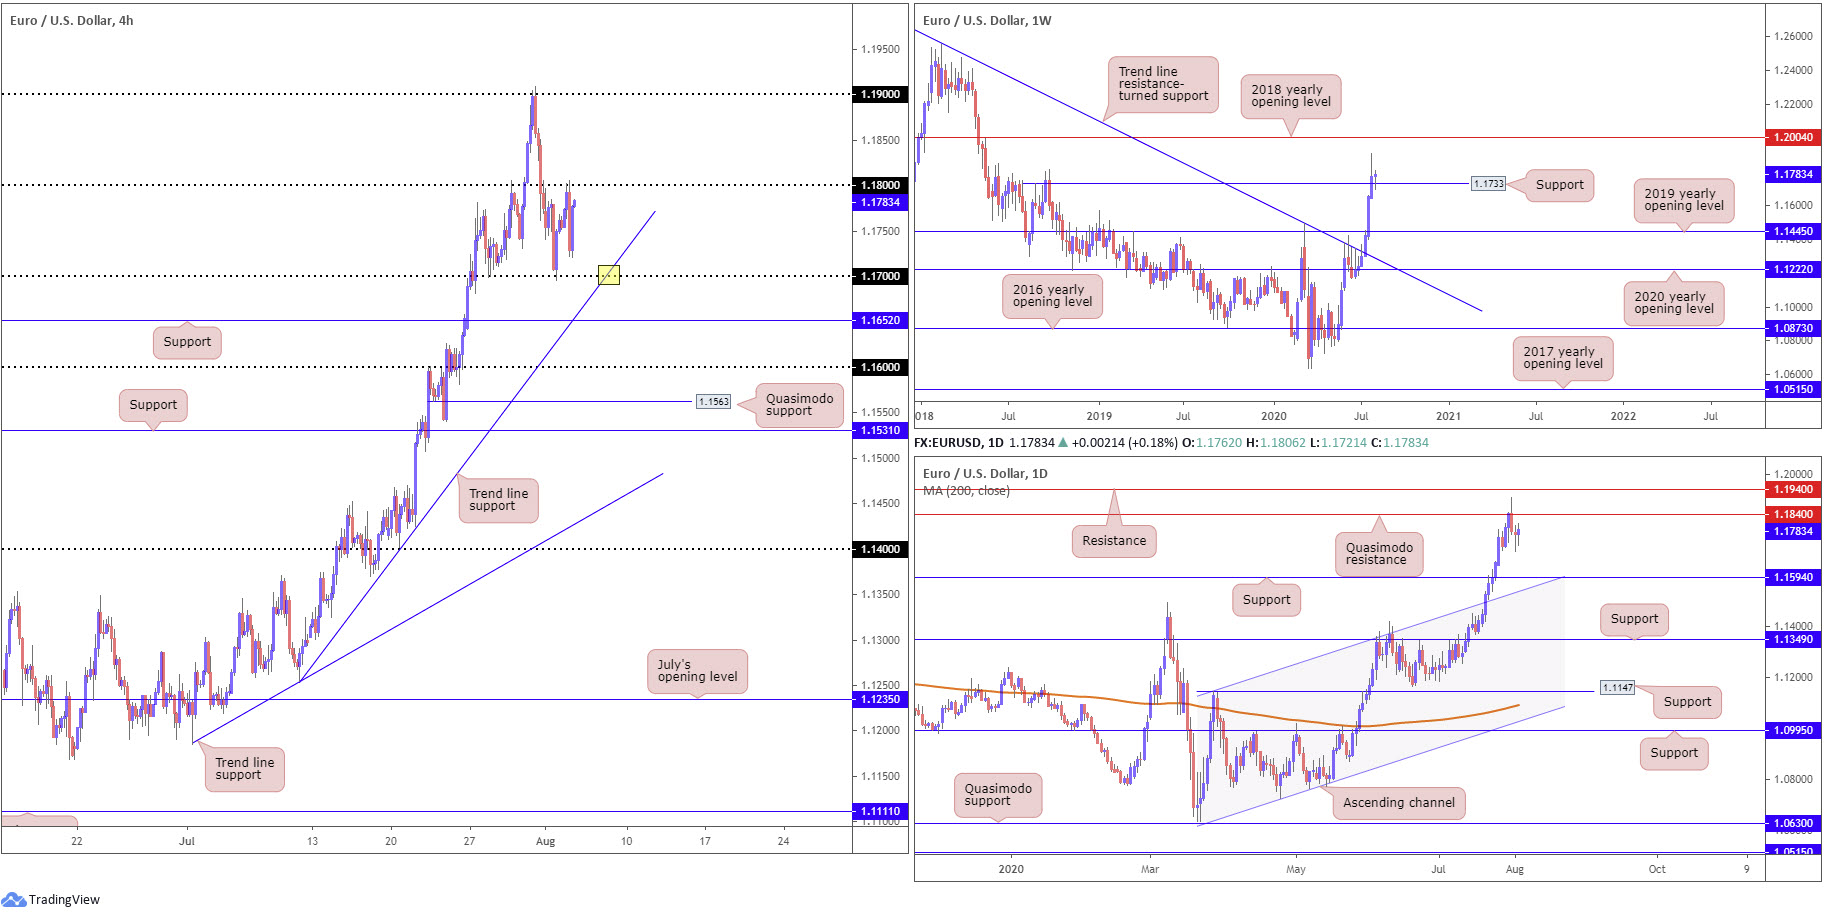
EUR/USD, on the H4 timeframe, touched gloves with the underside of 1.18 which, as you can see, held firm as resistance. North of here, voyaging to 1.19 is a possibility, whereas swinging lower from current price could push 1.17 back into the frame and trend line support, taken from the low 1.1254.
Further out, weekly flow is digesting a sixth consecutive weekly gain, and the recent retest of 1.1733 as support (prior Quasimodo resistance). This could perhaps fuel interest towards the 2018 yearly opening level at 1.2004.
Quasimodo resistance at 1.1840 on the daily timeframe remains in view, while Tuesday pencilled in another notable lower shadow. Moves lower has support as far south as 1.1594 in sight, stationed nearby channel resistance-turned support, extended from the high 1.1147. Renewed interest to the upside, nonetheless, could eventually bring light to resistance priced in at 1.1940.
Areas of consideration:
The break of weekly trend line resistance (July 13), taken from the high 1.2555, and violation of the 1.1495 March 9 high, reflects a long-term (potential) technical trend change.
Weekly trend structure points to additional bullish sentiment and is currently retesting 1.1733 support, potentially providing fuel to take H4 through 1.18 to daily resistance at 1.1840. This consequently leaves intraday buyers sufficient room to manoeuvre north of 1.18.
A rotation to 1.17 today, on the other hand, particularly at the point the H4 trend line support merges (yellow), could have dip-buyers make an appearance.
GBP/USD:
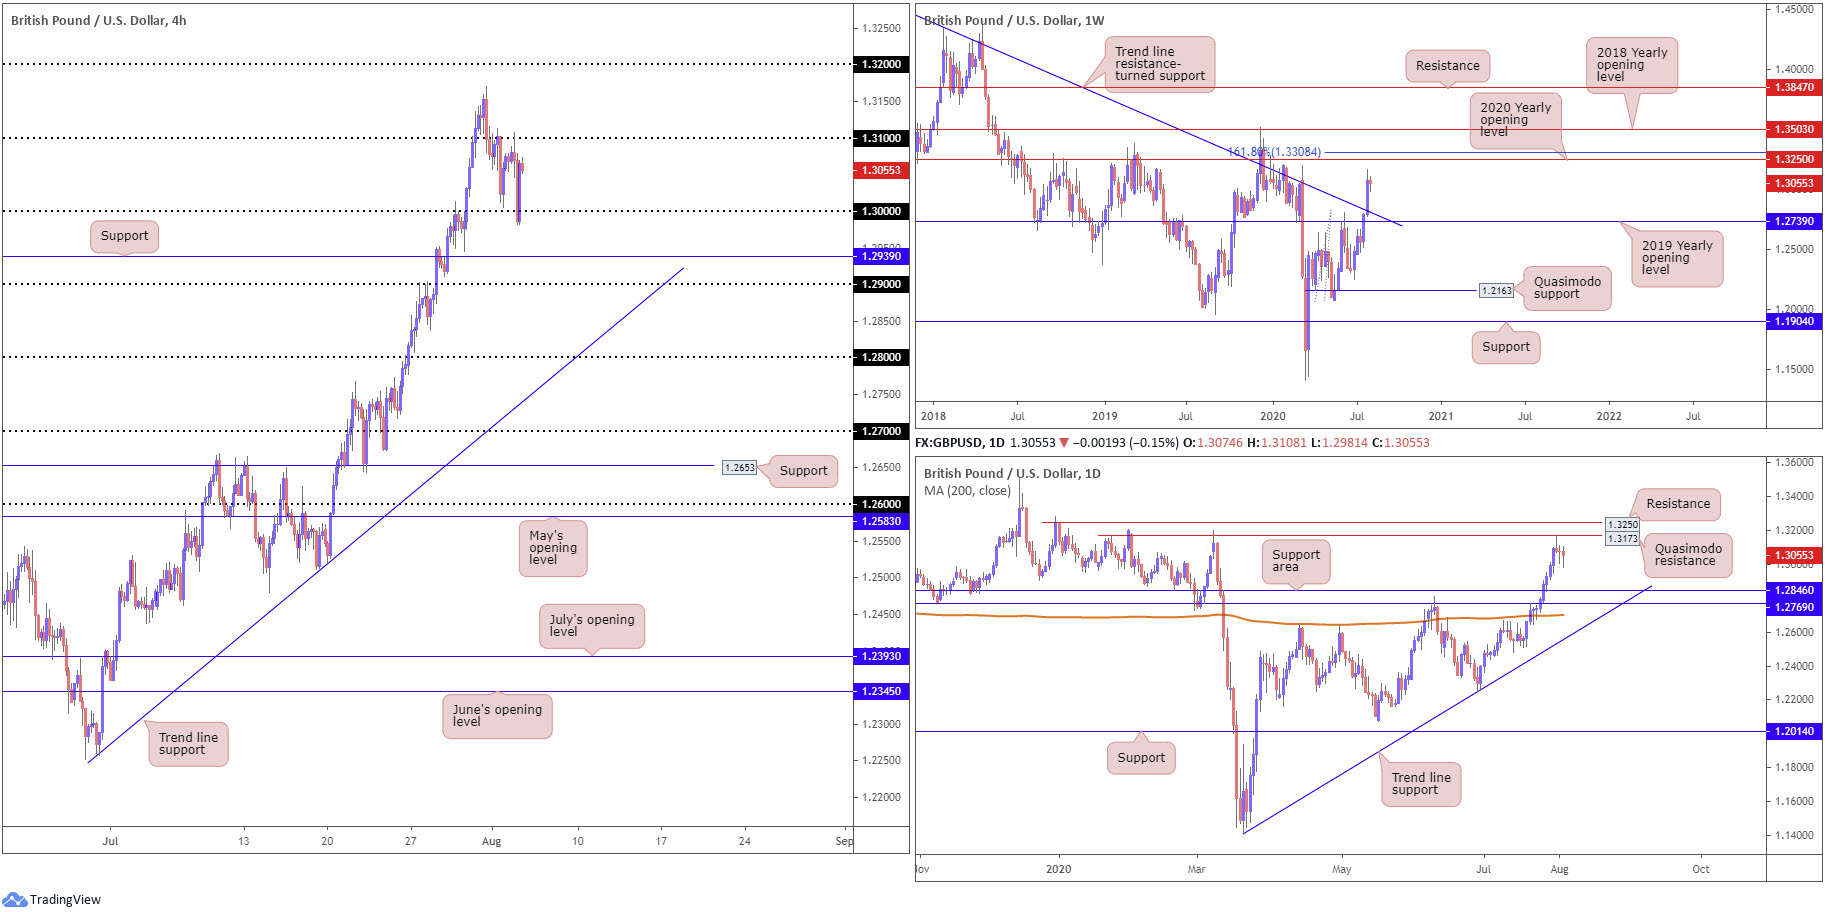
The British pound shook hands with levels just south of the key figure 1.30 vs. the buck Tuesday, though failed to sustain the breach as the US dollar index invited moves beneath 93.50.
1.31, as you can see, is proving a hard nut (resistance) to crack, holding price lower for a second time this week. The technical landscape on the weekly timeframe, however, suggests we are likely to eventually reclaim 1.31 to the upside, as the bigger picture displays scope to reach the 2020 yearly opening level at 1.3250 and a 161.8% Fibonacci extension point at 1.3308. In addition, daily flow, after chalking up a second back-to-back half-hearted hammer candle (bullish), also has room to approach Quasimodo resistance at 1.3173.
Areas of consideration:
The recent trend line resistance break on the weekly timeframe (1.5930), despite the 1.3514 December 9 high (2019) still intact (a break of here also signals trend change to the upside), may have long-term traders consider bullish positions.
The reaction from 1.30 (H4) has likely attracted buyer interest in this market, with current longs perhaps seeking at least a retest of 1.31. In light of weekly price showing room to move to the 2020 yearly opening level at 1.3250 and daily price to 1.3173, the possibility of further gains above 1.31 is certainly there. Current buyers, therefore, may seek additional long positions above 1.31, while at the same time the move could also entice fresh buying.
AUD/USD:
The Reserve Bank of Australia (RBA) held rates and retained guidance Tuesday, reiterating the central bank will maintain its accommodative approach as long as required.
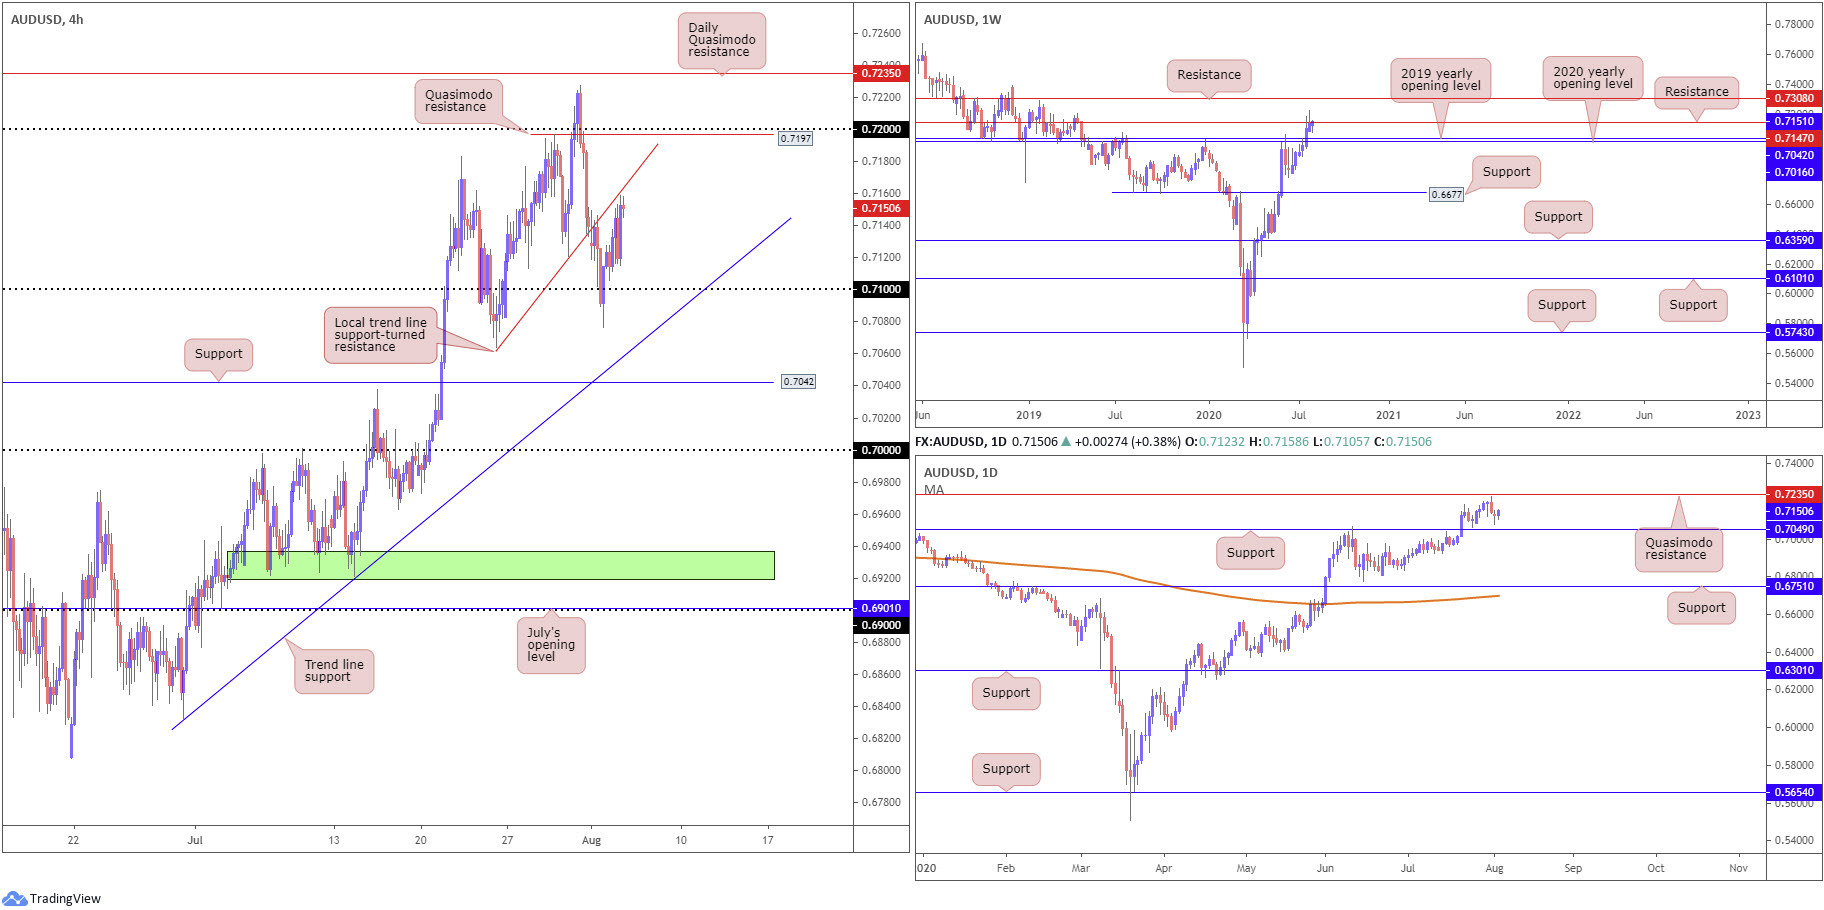
Monday’s whipsaw to lows at 0.7076 (a move that snapped sell-stop-liquidity sub 0.71 on the H4 scale), along with the US dollar index tunnelling through 93.50, observed AUD/USD chalk up modest gains Tuesday.
Technical action above 0.71 has H4 candles nearing a local trend line support-turned resistance, taken from the low 0.7063, with a break exposing Quasimodo resistance at 0.7197 and the 0.72 handle. Technicians may also want to note trend line support, extended from the low 0.6832, in the event we pop back beneath 0.71 today, followed closely by daily support at 0.7049 and H4 support at 0.7042.
Price movement on the weekly timeframe has buyers and sellers battling for position at resistance drawn from 0.7147, aligning closely with our local H4 trend line support-turned resistance mentioned above. Breaking 0.7147 may shoulder longer-term flow towards another layer of resistance at 0.7308. The story on the daily timeframe, however, has support pencilled in at 0.7049, with a Quasimodo formation plotted at 0.7235 as the next base of resistance.
Areas of consideration:
Bearish scenarios off local H4 trend line support-turned resistance (0.7063), given its near-connection with weekly resistance at 0.7147, could send things back to at least 0.71 today, with the possibility of whipsawing to nearby H4 trend line support (0.6832).
USD/JPY:
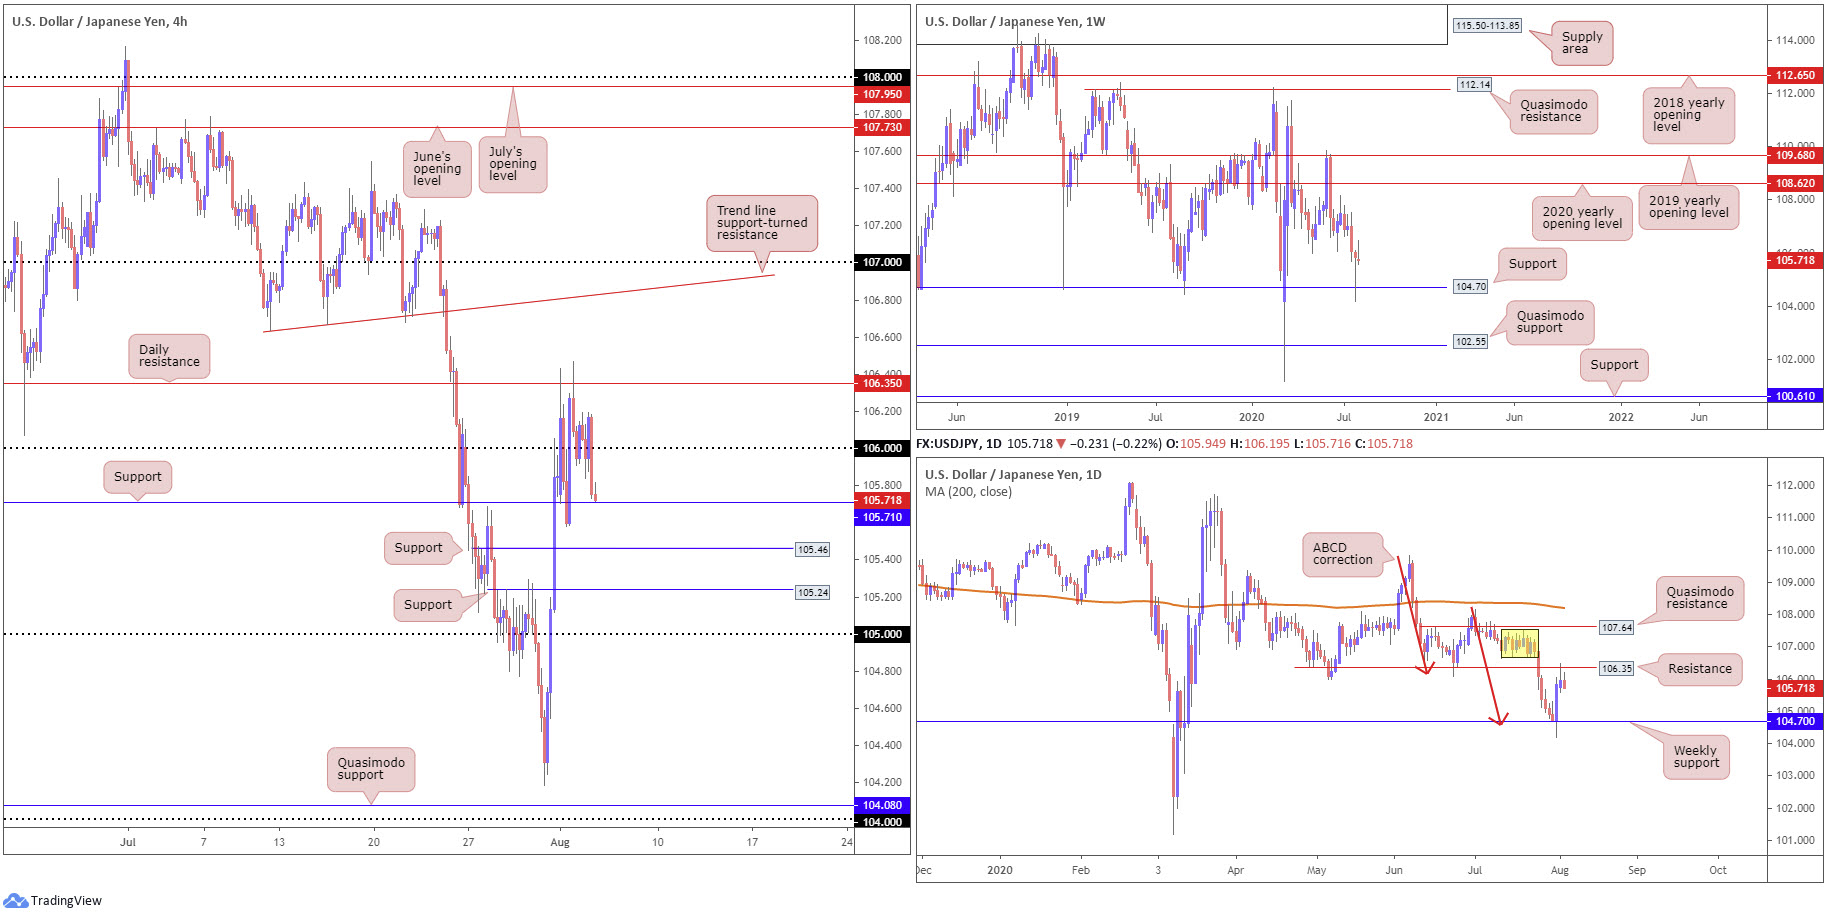
Amidst softening US Treasury yields and the US dollar index sinking back through 93.50, USD/JPY retook 106 to the downside Tuesday following Monday’s test of daily resistance at 106.35. This has thrown H4 support at 105.71 into the fold, with a break possibly setting sights on H4 support at 105.46 (a prior Quasimodo resistance level). Contrary to this, however, weekly movement recently pencilled in a hammer pattern last week, which is generally considered a bullish signal at troughs, off support at 104.70. Noticeable upside targets on this timeframe rest at the 2020 yearly opening level from 108.62, with a break unmasking the 2019 yearly opening level at 109.68.
Areas of consideration:
Governed by the weekly timeframe rebounding from support at 104.70 and forming a bullish candlestick signal, longer-term analysis suggests the possibility of a run higher. Daily resistance at 106.35, nonetheless, has so far put a cap on upside, threatening the possibility of a H4 close under 105.71.
Therefore, traders will be watching H4 support mentioned above at 105.71 closely today. A decisive rejection from here signals weekly buyers could make a stand; a break under the aforementioned H4 support, however, suggests daily sellers could send things to at least H4 support at 105.46.
USD/CAD:
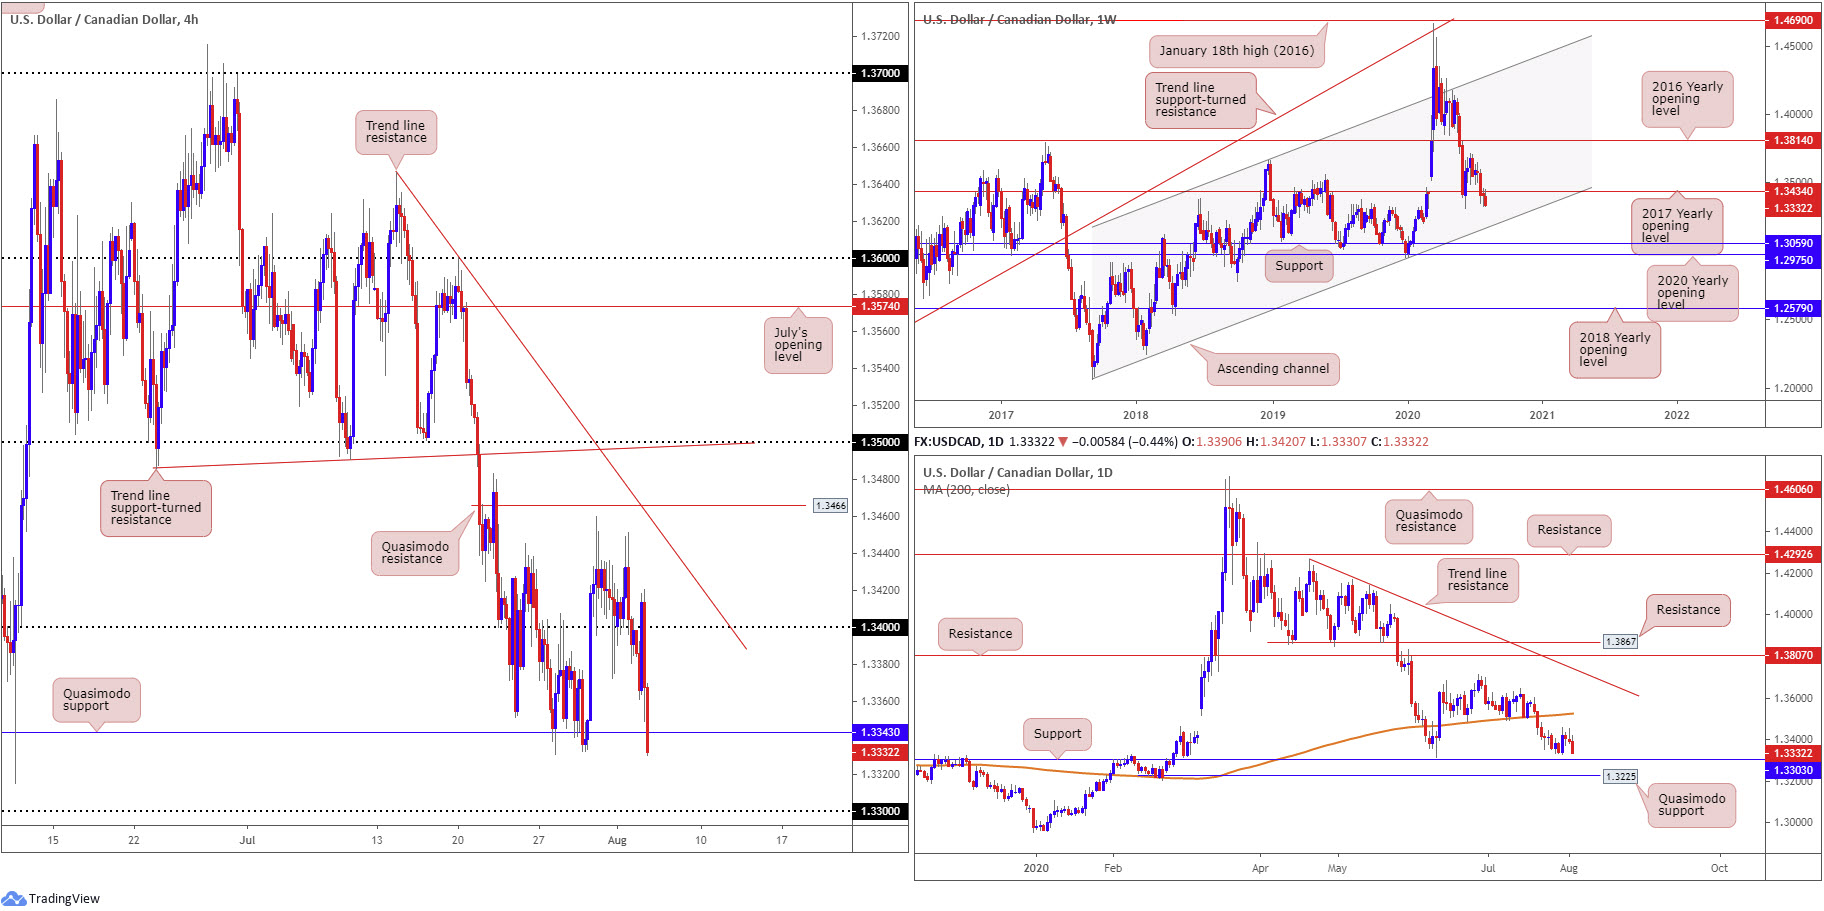
USD/CAD slipped sharply lower Tuesday, pressured by oil prices gaining a foothold above $41.50 a barrel and the US dollar index piloting sub 93.50.
Price action, based on the H4 timeframe, left behind the 1.34 handle in recent hours in search of Quasimodo support at 1.3343 and, with a little enthusiasm, the 1.33 handle.
Technically the break to lower levels is not a surprise.
From the weekly timeframe, the 2017 yearly opening level at 1.3434 represents resistance (since July 20). Below 1.3434, channel support, taken from the low 1.2061, can be viewed as the next potential floor, indicating bearish themes could be on the cards.
In terms of where we’re positioned on the daily timeframe, price is closing in on support at 1.3303. Should we follow sentiment on the weekly timeframe and navigate deeper waters, a break of 1.3303 could also be seen, eyeing Quasimodo support at 1.3225 as the next possible base.
Areas of consideration:
Securing short positions beneath 1.34 was unlikely an easy feat, given Tuesday’s volatility around the figure. Nevertheless, a close under H4 Quasimodo support at 1.3343 would likely be a welcomed sight for sellers, eyeing additional profit taking at the 1.33 vicinity.
Not only is 1.33 a logical downside target for sellers to work with, the level could also form a platform for buyers to make an entrance from. However, do be aware a dip through the 1.33 region could emerge having noted weekly price perhaps wanting to grip channel support (currently circling the 1.32ish neighbourhood).
USD/CHF:
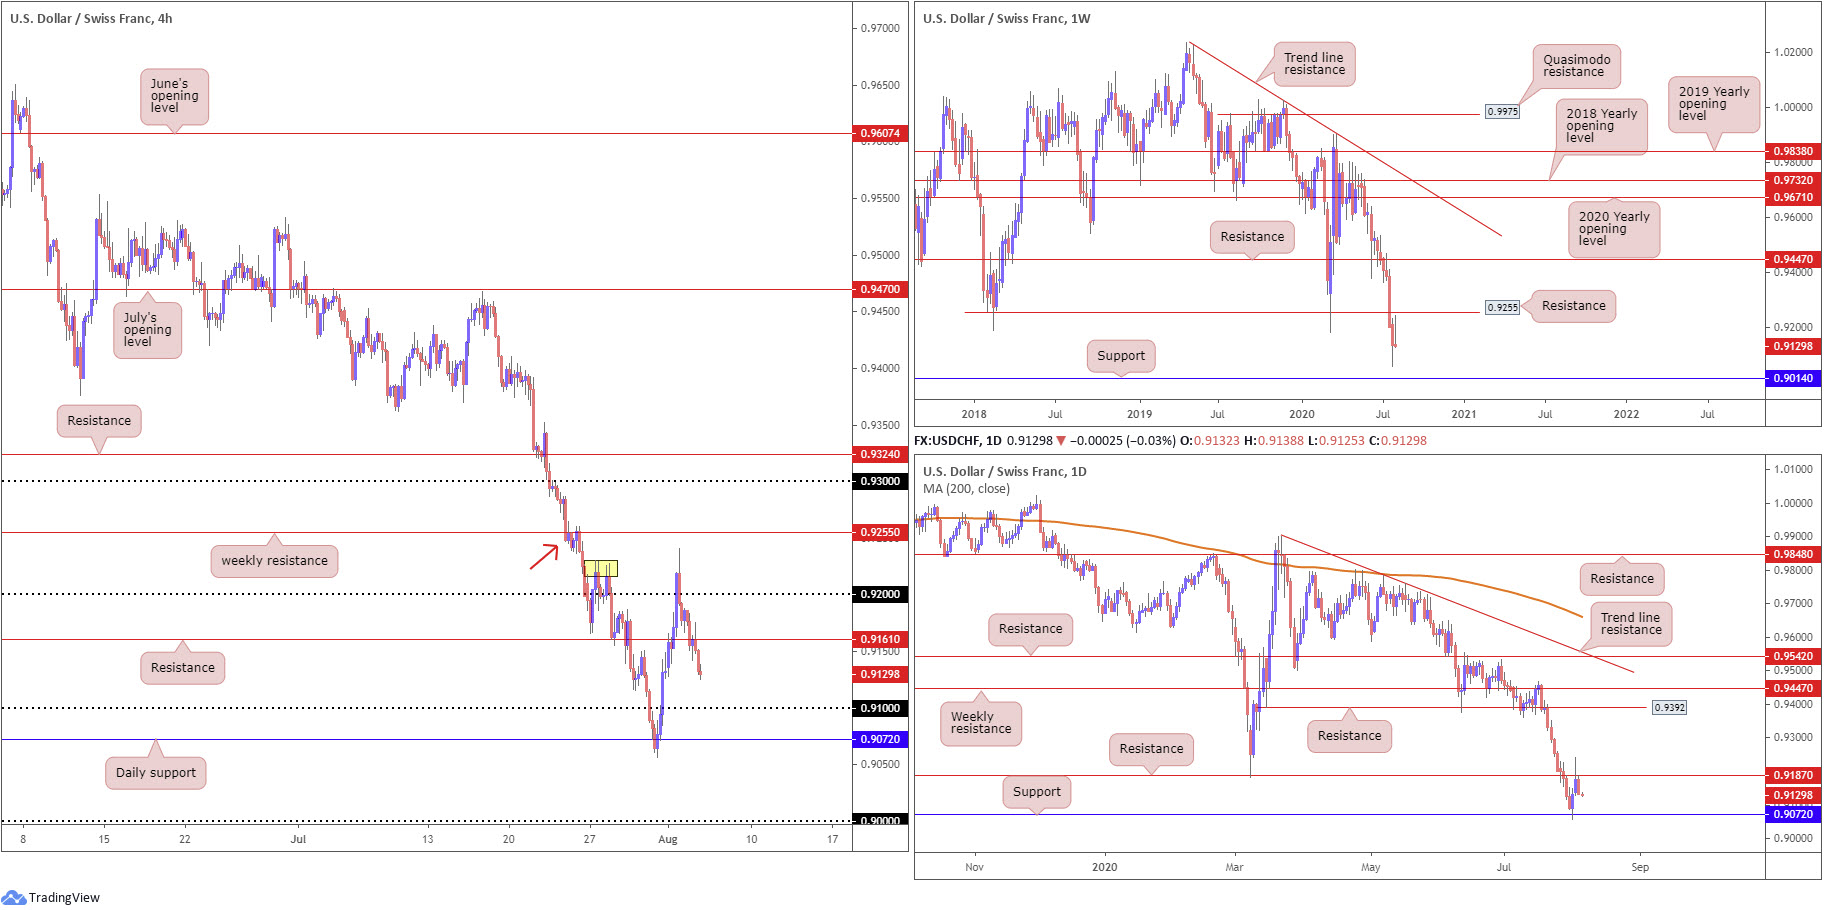
Snapping a two-day bullish phase (derived from daily support coming in at 0.9072) from daily resistance at 0.9187 took USD/CHF to lower levels Tuesday, establishing a near-full-bodied daily bearish candle as the US dollar index took 93.50.
Recent action swept H4 candles through support at 0.9161 (now serving as resistance) and shined the spotlight on the possibility of re-joining the 0.91 handle, closely reinforced by the aforementioned daily support. Also of note is the weekly timeframe, coming off a whopping six-week decline. Technical traders will acknowledge price recently came within striking distance of resistance at 0.9255 (a prior Quasimodo support), before collapsing and threatening a potential approach to support coming in at 0.9014.
Areas of consideration:
Daily resistance holding at 0.9187, coupled with the current weekly candle exhibiting weak posture along with the underlying trend pointing lower, is likely to see sellers push for 0.91 on the H4 today, perhaps even daily support at 0.9027.
The retest at the underside of 0.9161 on the H4, formed in the shape of a near-shooting star candle pattern, likely enticed sellers into the market.
Breaking beyond the current daily support level could stir further selling towards weekly support at 0.9014, aligning closely with the 0.90 handle on the H4.
The accuracy, completeness and timeliness of the information contained on this site cannot be guaranteed. IC Markets does not warranty, guarantee or make any representations, or assume any liability regarding financial results based on the use of the information in the site.
News, views, opinions, recommendations and other information obtained from sources outside of www.icmarkets.com.au, used in this site are believed to be reliable, but we cannot guarantee their accuracy or completeness. All such information is subject to change at any time without notice. IC Markets assumes no responsibility for the content of any linked site.
The fact that such links may exist does not indicate approval or endorsement of any material contained on any linked site. IC Markets is not liable for any harm caused by the transmission, through accessing the services or information on this site, of a computer virus, or other computer code or programming device that might be used to access, delete, damage, disable, disrupt or otherwise impede in any manner, the operation of the site or of any user’s software, hardware, data or property.


