
Key risk events today:
US ADP Non-Farm Employment Change; Crude Oil Inventories; FOMC Member Williams Speaks.
EUR/USD:
Following a YTD peak at 99.67, the benchmark US dollar index fell sharply, weighed by technical selling off long-term weekly resistance at 99.62 and dismal US manufacturing data. According to the Institute for Supply Management, manufacturing contracted in September as the PMI registered 47.8%, a decrease of 1.3 percentage points from the August reading of 49.1%. This is the lowest reading since June 2009, the last month of the Great Recession, when the index registered 46.3%.
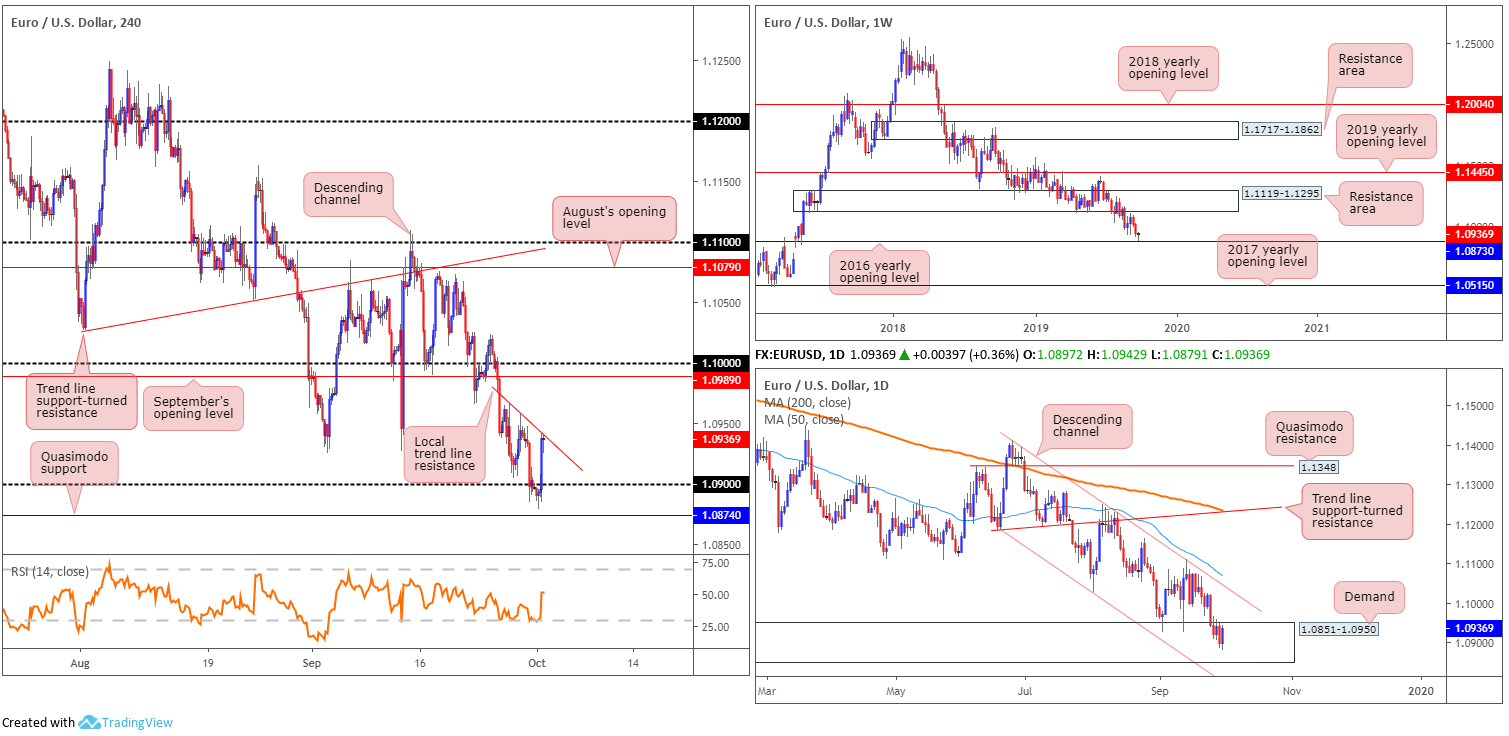
EUR/USD’s technical landscape reveals weekly price bottoming a few points north of 1.0873, the 2016 yearly opening level. This follows a breach of long-standing demand-turned resistance area at 1.1119-1.1295 in August. Concerning long-term trend direction, however, since topping in early 2018 at 1.2555, the trend remains facing a southerly bearing.
Daily action, as underlined in Tuesday’s technical briefing, finds itself back within the parapets of demand at 1.0851-1.0950 – formed April 2017 and houses the 2016 yearly opening level inside its lower bounds. In addition to this, price has remained compressing within a descending channel formation since late June (1.1412/1.1026), with the 50-day SMA (blue – 1.1081) trailing the upper limit.
Across the page on the H4 timeframe, price whipsawed 20 points through 1.09 in recent movement, likely tripping stop-loss orders. Dollar selling, nonetheless, bolstered EUR/USD bidding and saw the unit reclaim 1.09+ status in strong fashion, consequently clawing back a large portion of Monday’s losses.
Areas of consideration:
Noting weekly price rebounding higher just ahead of support, and daily price finding its feet within demand, buyers appear to be gathering steam. The local trend line resistance (taken from the high 1.0967) on the H4 timeframe is currently capping downside, therefore a decisive close beyond this barrier may confirm upside back to at least September’s opening level at 1.0989, closely shadowed by the key figure 1.10.
Entry on the close of the breakout candle is certainly an option (protective stop-loss orders plotted below the candle’s lower shadow), or, for the more conservative trader, waiting for a retest motion to take shape following the breakout higher may be an idea (entry/risk parameters can be determined according to the rejection candle’s structure).
GBP/USD:
Despite ranging more than 130 points, Tuesday’s session wrapped up mostly unmoved. Brexit-related fears fuelled latest movement, consequently pencilling in a low just north of the 1.22 handle on the H4 timeframe. On the data front, according to Markit, the headline seasonally adjusted IHS Markit/CIPS PMI rose slightly to 48.3 in September, up from August’s six-and-a-half year low of 47.4. The headline index has now remained below the neutral 50.0 mark for five successive months, its longest sequence below that mark since mid-2009.
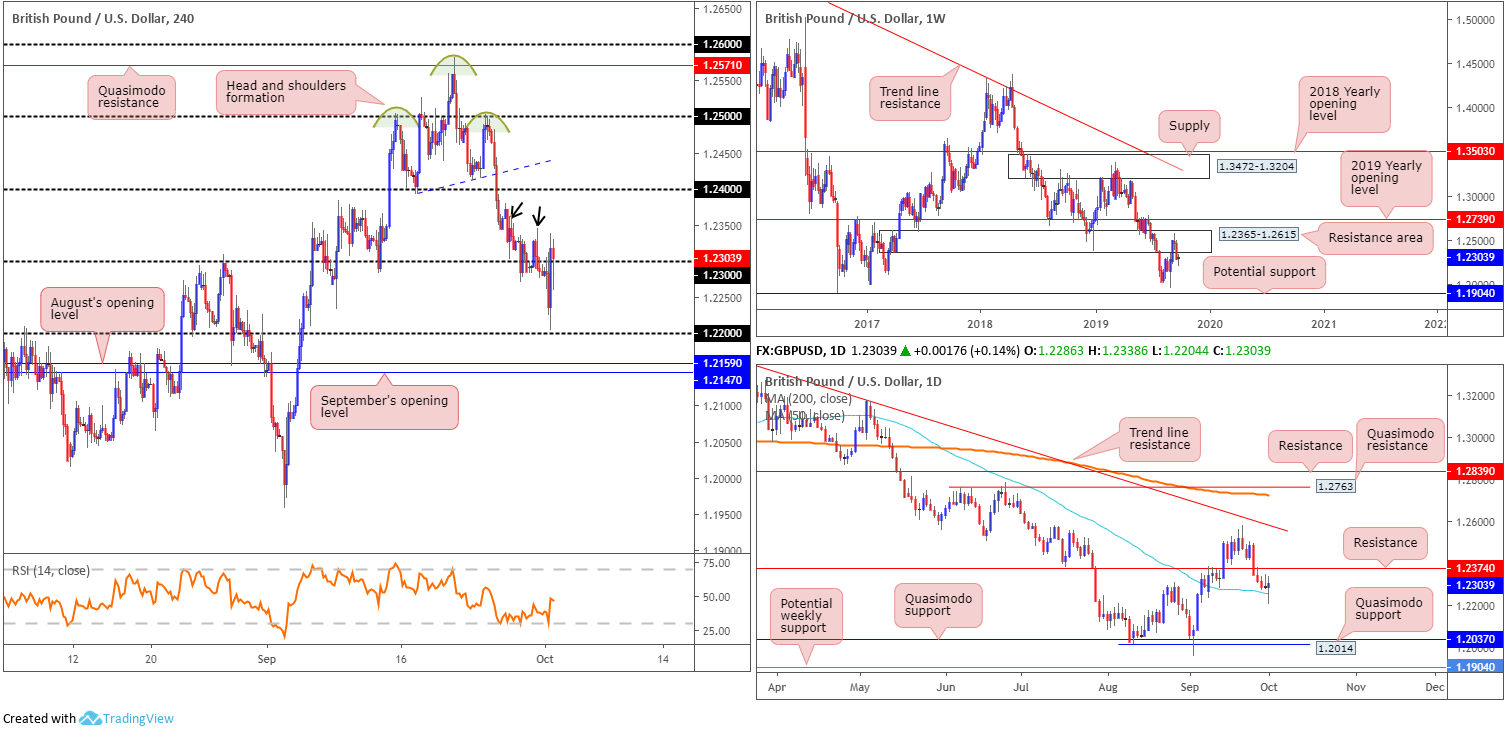
1.23 remains central to H4 structure. Limited supply to the left of current price is visible (note potential consumption spikes – black arrows) until reaching possible resistance at 1.24. Likewise, to the downside, limited support is seen until clocking 1.22.
On a wider perspective, weekly flow denotes a bearish bias after testing a long-term resistance area coming in at 1.2365-1.2615. Further downside from here has support at 1.1904 in view – held price action strongly higher in October 2016. The story on the daily timeframe shows the 50-day SMA (blue – 1.2255) entered the fray Tuesday, with the possibility of a run materialising to resistance at 1.2374.
Areas of consideration:
Further downside is suggested according to the weekly timeframe, though daily price is seen halting at its 50-day SMA function. H4 price, on the other hand, is toying with 1.23, appearing somewhat indecisive at the moment.
Irrespective of the direction one selects, opposing structure is evident. On these grounds, opting to remain on the side lines may be the better path to take until clearer price action is observed.
AUD/USD:
Early hours Tuesday witnessed the Reserve Bank of Australia (RBA) lower the cash rate by 25 basis points to 0.75%. The decision was in line with market consensus, though a dovish tilt in the monetary policy statement provoked vigorous selling towards the 0.67 handle applied to the H4 timeframe.
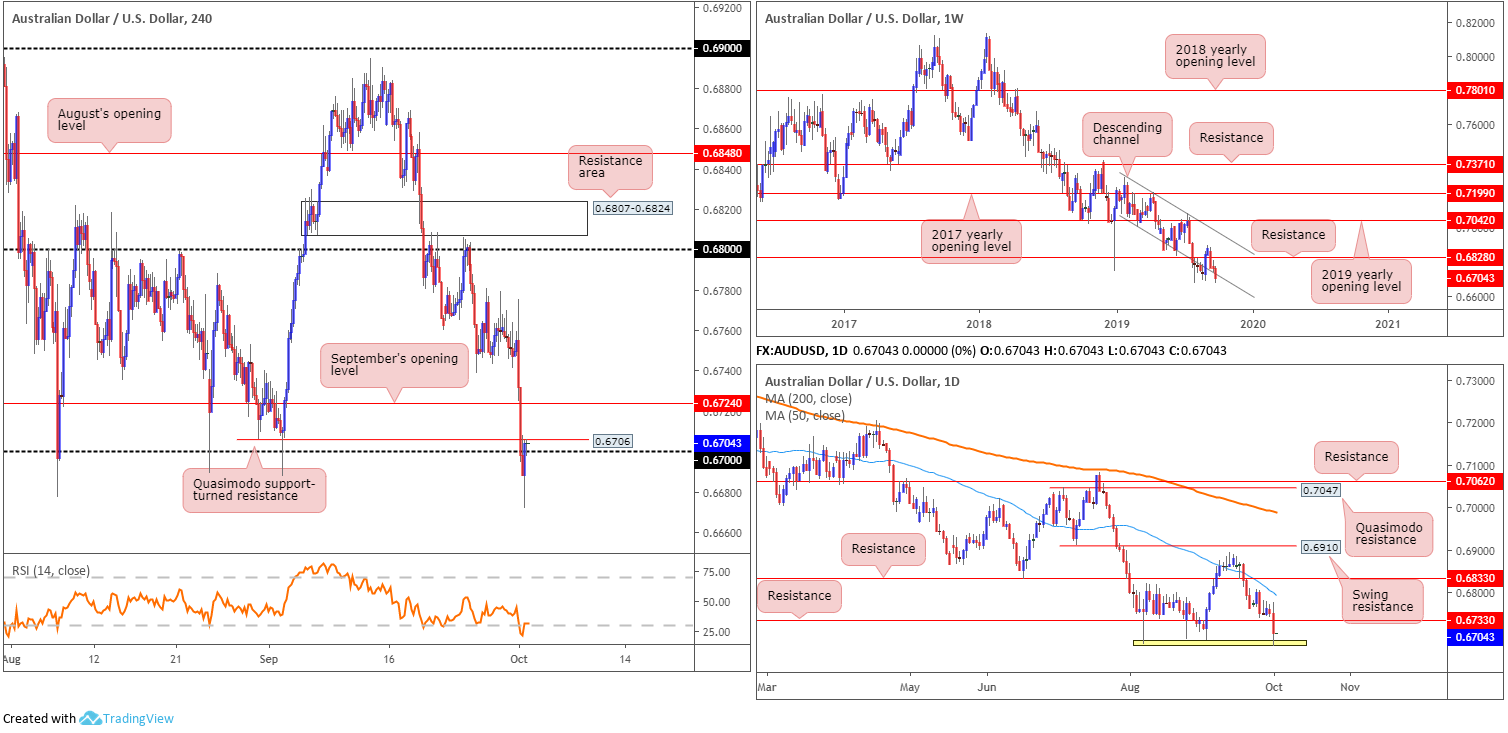
Traders long from 0.67 suffered an immense blow, with price whipsawing to a multi-year low at 0.6671, only to see the market recover marginally north of the round number into the close. Immediate resistance, however, resides at 0.6706, a Quasimodo support-turned resistance level.
As seen clearly on the daily timeframe, support at 0.6733 yielded Tuesday (now acting resistance), permitting a test of a bottom formation around 0.6687 (yellow). Beyond here, limited support is visible until reaching 0.6301 (not visible on the screen). Adding to the downbeat tone, weekly movement recently crossed back below a channel support etched from the low 0.7003.
Areas of consideration:
With the commodity-linked currency recently testing multi-year lows, sellers continue to have the upper hand. The break of weekly channel support, and H4 resistance at 0.6706 in motion, adds additional weight to the current downbeat tone. For that reason, traders likely have their crosshairs fixed on the 0.67 region for selling opportunities today. Owing to the threat of buying off daily support highlighted above as a bottom formation at 0.6687, some sellers may be hesitant shorting without additional confirmation. For conservative players, this might be something as simple as a H4 bearish candlestick formation, such as a shooting star pattern or a bearish outside setting. Entry and risk can then be set based on this structure, targeting lows beyond 0.6671.
USD/JPY:
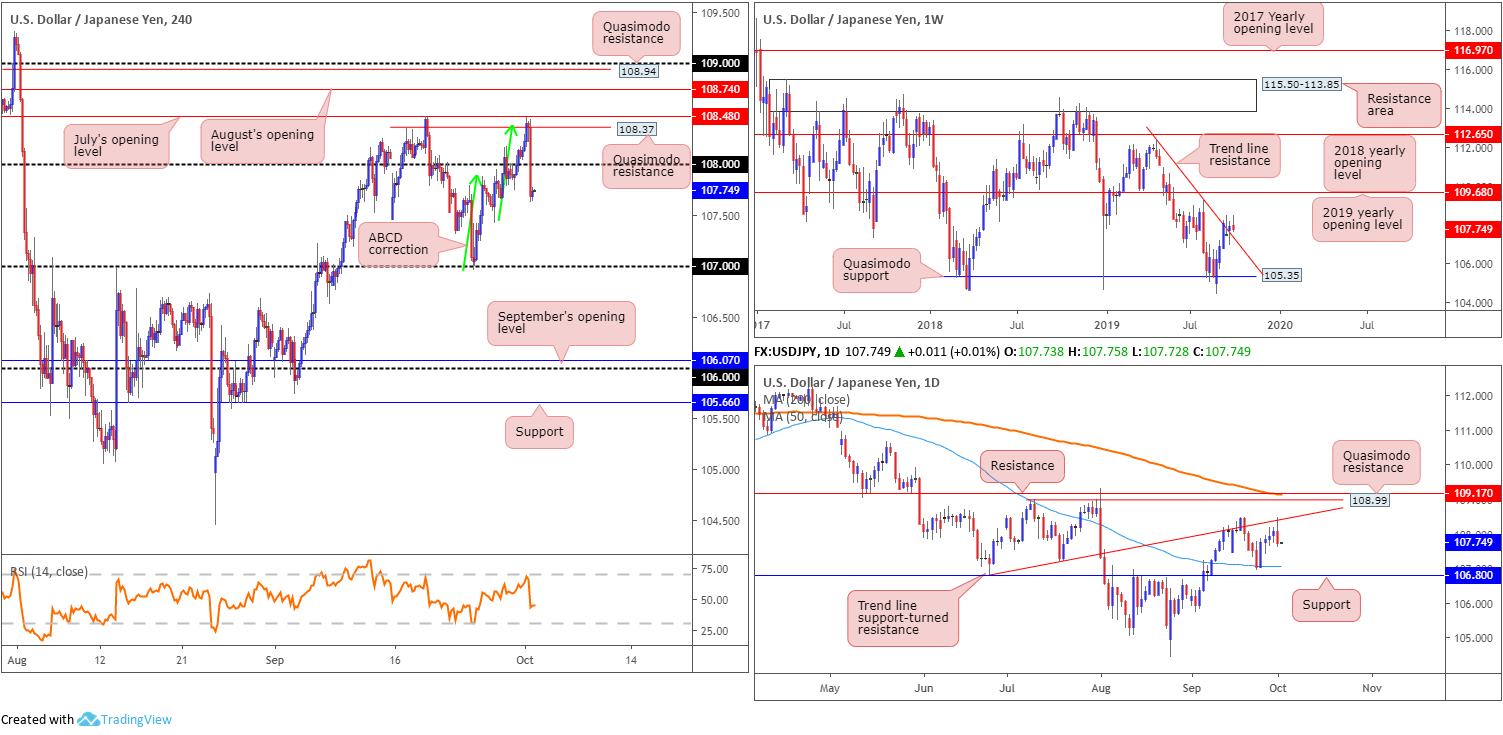
As emphasised within the EUR/USD analysis, US manufacturing contracted in September as the PMI registered 47.8%, a decrease of 1.3 percentage points from the August reading of 49.1%, according to the Institute for Supply Management. This heavily weighed on the USD/JPY in the early hours of US trade, falling sharply from H4 Quasimodo resistance plotted at 108.37.
Traders who read Tuesday’s technical briefing may recall the following pieces:
Buy stops above 108, both from traders attempting to short the figure and those bidding a breakout, are likely of interest for a possible short off H4 Quasimodo resistance at 108.37. 108.37 also boasts a clear connection to the daily trend line support-turned resistance (taken from the low 106.78) and a potential H4 ABCD correction (green arrows).
Entry at 108.37 is an option, with a protective stop-loss order positioned either above July or August’s opening levels at 108.48 and 108.74, respectively, dependent on risk appetite. Downside expectation falls on a break back beneath 108: a cue to think about reducing risk to breakeven and liquidating a portion of the position.
Well done to any of our readers who managed to jump onboard this move, as price cleared the 108 boundary and formed a daily bearish outside day pattern.
Areas of consideration:
Further downside is likely on the cards, according to the chart studies. However, before pulling the trigger, the possibility of a retest emerging off the underside of 108 is a reasonable possibility, followed by a potential run to the 107s. This region not only marks a round number, it also holds the 50-day SMA function (blue – 107.06), closely trailed by daily support at 106.80.
USD/CAD:
Following four months of growth, real gross domestic product for Canada was essentially unchanged in July as a decline in goods-producing industries was offset by an increase in services-producing industries, according to Statistics Canada on Tuesday. This set the USD/CAD on a northerly trajectory, though was a short-lived move, topping at 1.3289 on the back of dismal US manufacturing data.
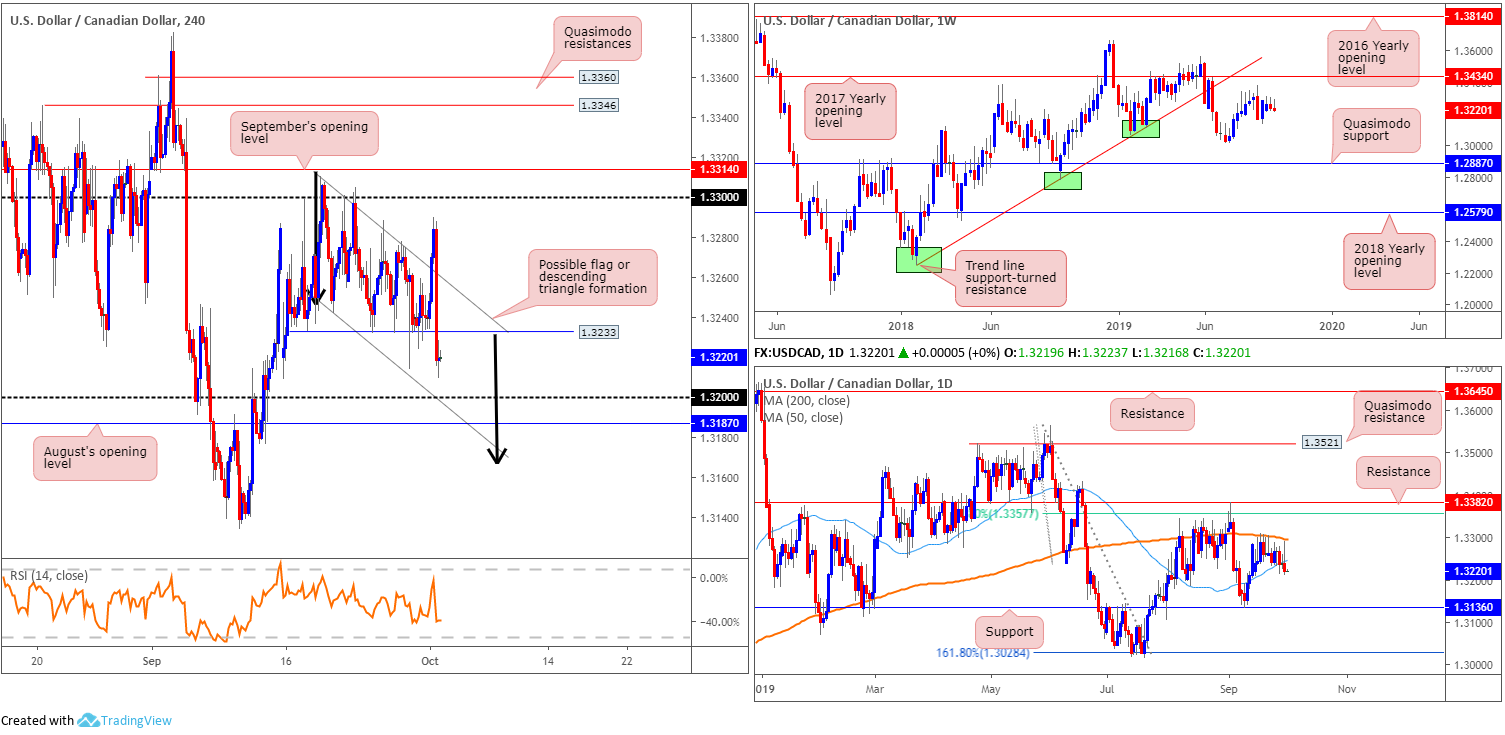
H4 technical structure has the candles trading beneath an important level of support at 1.3233. As reported in recent technical research, since September 19, the H4 candles have been carving out either a bullish flag (1.3310/1.3242) or a potential descending triangle formation, with support sited at 1.3233. H4 supports to be aware of beyond the said ranges can be seen at the 1.32 handle and nearby August’s opening level at 1.3187. Overhead, we have the 1.33 handle and September’s opening level at 1.3314 to contend with.
Looking at weekly price, the pair trades around the lower limits of last week’s range, which formed an inside bearish candle formation. Resistance is fixed at the 2017 yearly opening level drawn from 1.3434, closely lagged by trend line support-turned resistance extended from the low 1.2247. To the downside, the 1.3016 July 15 low represents potential support, followed by a Quasimodo formation at 1.2887. Daily action extended its presence beneath the 50-day SMA (blue – 1.3246), likely drawing eyes to support coming in at 1.3136.
Areas of consideration:
Having seen price action on the H4 timeframe close beneath support at 1.3233, the lower boundary of a descending triangle formation, this is considered a bearish signal to short the pattern, targeting 1.3168 (black arrows), implying a move beyond 1.32/1.3187.
A sell at current price is an idea, with protective stop-loss orders plotted above the upper limit of the descending triangle. This is a large stop and limits risk/reward considerably. An alternative is to wait and see if the H4 candles retest 1.3233 and attempt to fade the level, preferably on the back of a bearish candlestick formation (entry and risk can be decided according to this pattern).
USD/CHF:
Broad-based USD selling on the back of less-than-stellar US manufacturing data had the USD strongly lower against the Swiss franc Tuesday, down 0.47%.
Based on Tuesday’s technical research, the piece highlighted the following:
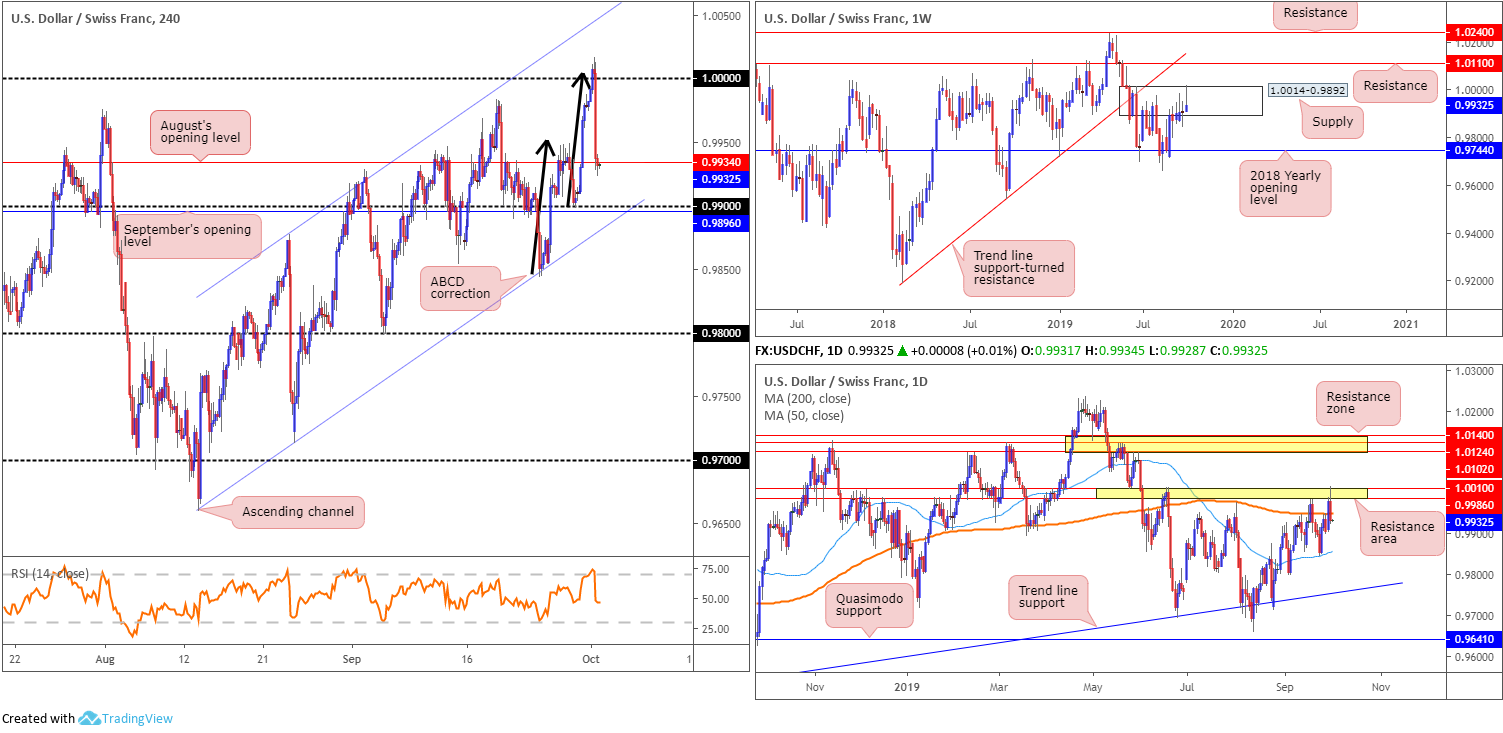
The next upside target (on the H4) lies at the key figure 1.0000 (parity), which, as you can see, unites closely with a potential ABCD formation (black arrows) at 1.0006. Against the backdrop of medium-term activity, weekly price remains confined within the upper boundary of supply at 1.0014-0.9892, while daily price is seen shaking hands with a resistance area coming in at 1.0010/0.9986 (yellow).
Many traders likely have 1.0000 on the radar this morning for probable shorts. Entry is possibly eyed at 1.0000, with stops set above weekly supply at 1.0014 (this then also covers the top edge of the daily resistance area as well [1.0010]). Conservative traders, nevertheless, may feel inclined to wait for additional candlestick confirmation before pulling the trigger. As a consequence, this will help identify seller intent and deliver entry/risk levels to trade.
As evident from the H4 timeframe this morning, price action turned lower a touch above 1.0000 yesterday, drawing the unit marginally south of August’s opening level at 0.9934. This potentially sets the stage for an approach towards 0.99, which aligns with channel support extended from the low 0.9659 and September’s opening level at 0.9896. Also of interest is daily price responding from its resistance area at 1.0010/0.9986 and closing beneath the 200-day SMA (orange – 0.9949).
Areas of consideration:
Well done to any of our readers who managed to jump aboard yesterday’s move.
Going forward, the 0.99 handle falls in as strong support on the H4 timeframe, given its surrounding confluence. However, entering long from this region places the order against potential higher-timeframe selling. For that reason, research does not expect much more than an intraday pullback to 0.9934. A H4 close beyond 0.99, therefore, is the more likely price route, which is a strong bearish indicator for a run toward 0.9856 – the 50-day SMA, followed by the 0.98 handle on the H4 timeframe.
Dow Jones Industrial Average:
Across the board, US equities wrapped up Tuesday in negative territory, following disappointing US manufacturing figures. According to the Institute for Supply Management, manufacturing contracted in September as the PMI registered 47.8%, a decrease of 1.3 percentage points from the August reading of 49.1%.The Dow Jones Industrial Average shed 343.79 points, or 1.28%; the S&P 500 also fell 36.49 points, or 1.23% and the tech-heavy Nasdaq 100 declined 65.31 points, or 0.84%.
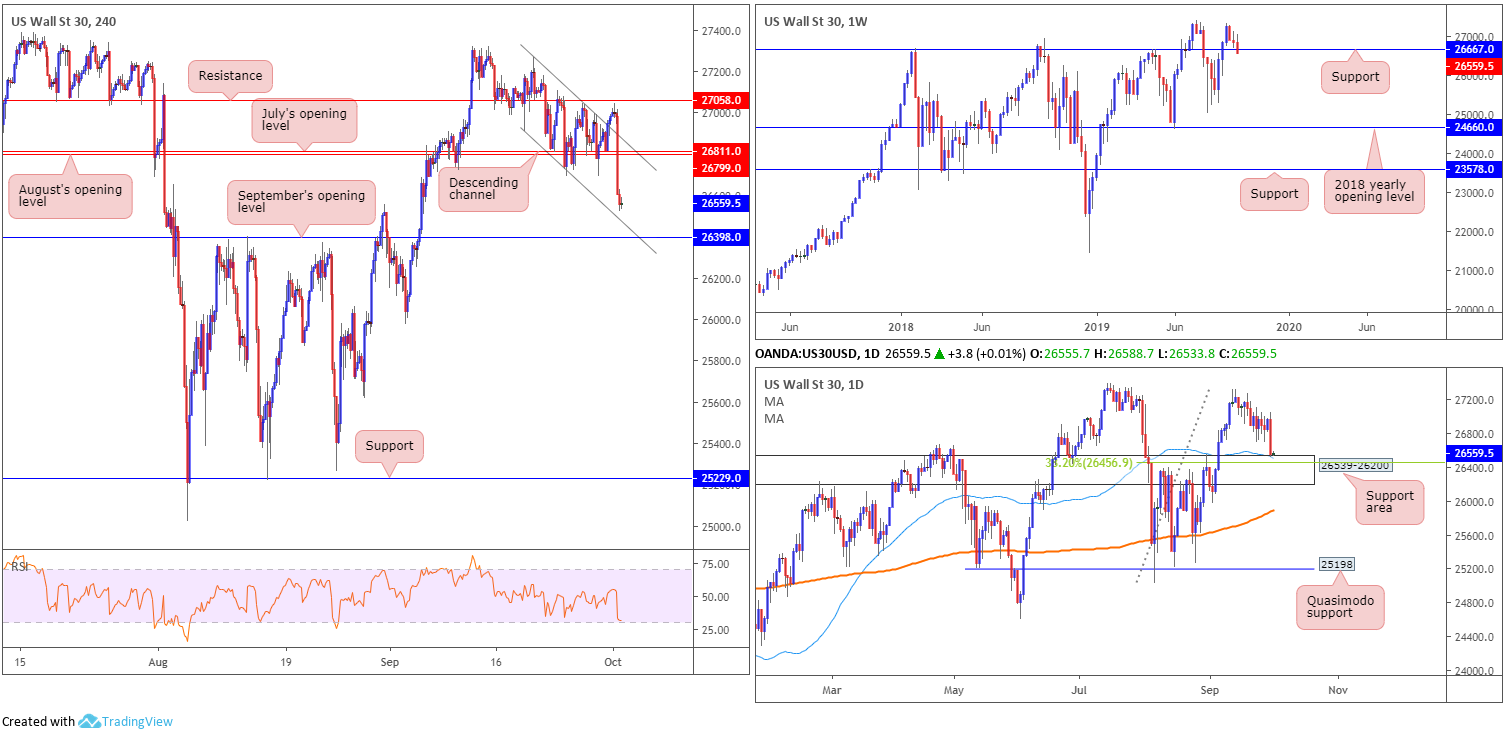
Technically, we now have weekly price a touch beneath support at 26667, yet until a decisive close forms, the support remains a valid border. Reinforcing weekly price is a daily support area at 26539-26200, which aligns with the 50-day SMA (blue – 26510) and a neighbouring 38.2% Fibonacci ratio at 26456. In terms of H4 movement, the index trades just ahead of September’s opening level at 26398 and a closely converging channel support (taken from the low 26908), following a break of July and August’s opening levels at 26811 and 26799, respectively.
Areas of consideration:
The H4 support priced in the shape of September’s opening level at 26398 is a prominent level in today’s analysis, largely due to its position within the daily support area mentioned above at 26539-26200. Although countless entry techniques exist, traders can simply choose to enter at market off 26398 and position protective stop-loss orders beneath the daily zone (26200). Alternatively, waiting and seeing if H4 action chalks up a bullish candlestick signal might be a safer approach. Selecting the latter will help identify buyer intent before pulling the trigger. The candle pattern also provides additional entry and risk levels to consider.
XAU/USD (GOLD):
Snapping a two-day losing streak, the yellow metal turned higher against the buck Tuesday, influenced by less-than-expected US manufacturing numbers.
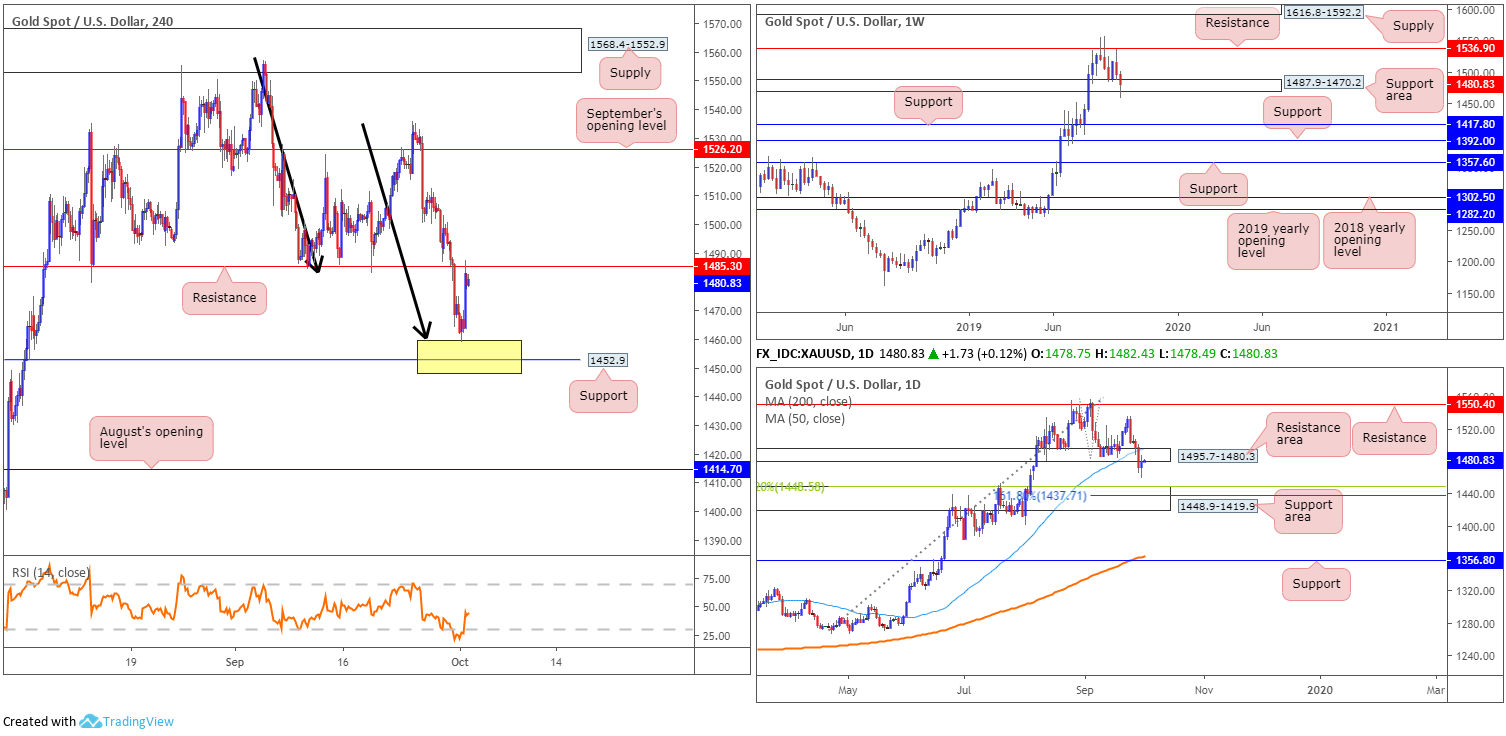
Interestingly, price action rebounded to-the-point off the top edge of a noted area of support between 1448.9/1460.2 in Tuesday’s technical briefing (comprised of the top limit of a daily support area at 1448.9-1419.9, a H4 support level at 1452.9 and a H4 AB=CD completion point at 1460.2 [black arrows]). The recovery off this zone brought the unit towards H4 resistance at 1485.3 (the noted first take-profit target), which, as you can see, is holding firm. Well done to any of our readers who took advantage of the latest move.
Thanks to recent trading, the weekly support area at 1487.9-1470.2 had its lower edge torn through, but appears to have stabilised for the time being. A run north from here has resistance at 1536.9 to target. A little lower on the curve, daily price is seen retesting the underside of a recently broken support area at 1495.7-1480.3 (now a serving resistance area). Note the 50-day SMA (blue – 1496.7) also intersects with this zone. To the downside, it is also worth noting a move lower could bring in the support area at 1448.9-1419.9, which aligns with a 38.2% Fibonacci ratio at 1448.5 and a 61.8% Fibonacci ratio at 1437.7.
Areas of consideration:
In the event we climb above H4 resistance today at 1485.3, this suggests strength out of the weekly support area at 1487.9-1470.2, and feeble sellers on the daily timeframe from the current resistance area. A decisive H4 close above 1485.3, preferably followed up with a retest motion, is, therefore, worthy of attention for possible longs, targeting September’s opening level at 1526.2.
Continued rejection off the said H4 resistance, on the other hand, likely means a revisit to the H4 support zone at 1448.9/1460.2, and a possible selling opportunity. The recent break of the weekly support area and price retesting the underside of a daily resistance area certainly adds weight to a downside move occurring.
The accuracy, completeness and timeliness of the information contained on this site cannot be guaranteed. IC Markets does not warranty, guarantee or make any representations, or assume any liability regarding financial results based on the use of the information in the site.
News, views, opinions, recommendations and other information obtained from sources outside of www.icmarkets.com.au, used in this site are believed to be reliable, but we cannot guarantee their accuracy or completeness. All such information is subject to change at any time without notice. IC Markets assumes no responsibility for the content of any linked site.
The fact that such links may exist does not indicate approval or endorsement of any material contained on any linked site. IC Markets is not liable for any harm caused by the transmission, through accessing the services or information on this site, of a computer virus, or other computer code or programming device that might be used to access, delete, damage, disable, disrupt or otherwise impede in any manner, the operation of the site or of any user’s software, hardware, data or property.


