
Key risk events today:
RBA Gov. Low Speaks; Australia GDP q/q; US ADP Non-Farm Employment Change; Fed Chair Powell Testifies.
(Previous analysis as well as outside sources – italics).
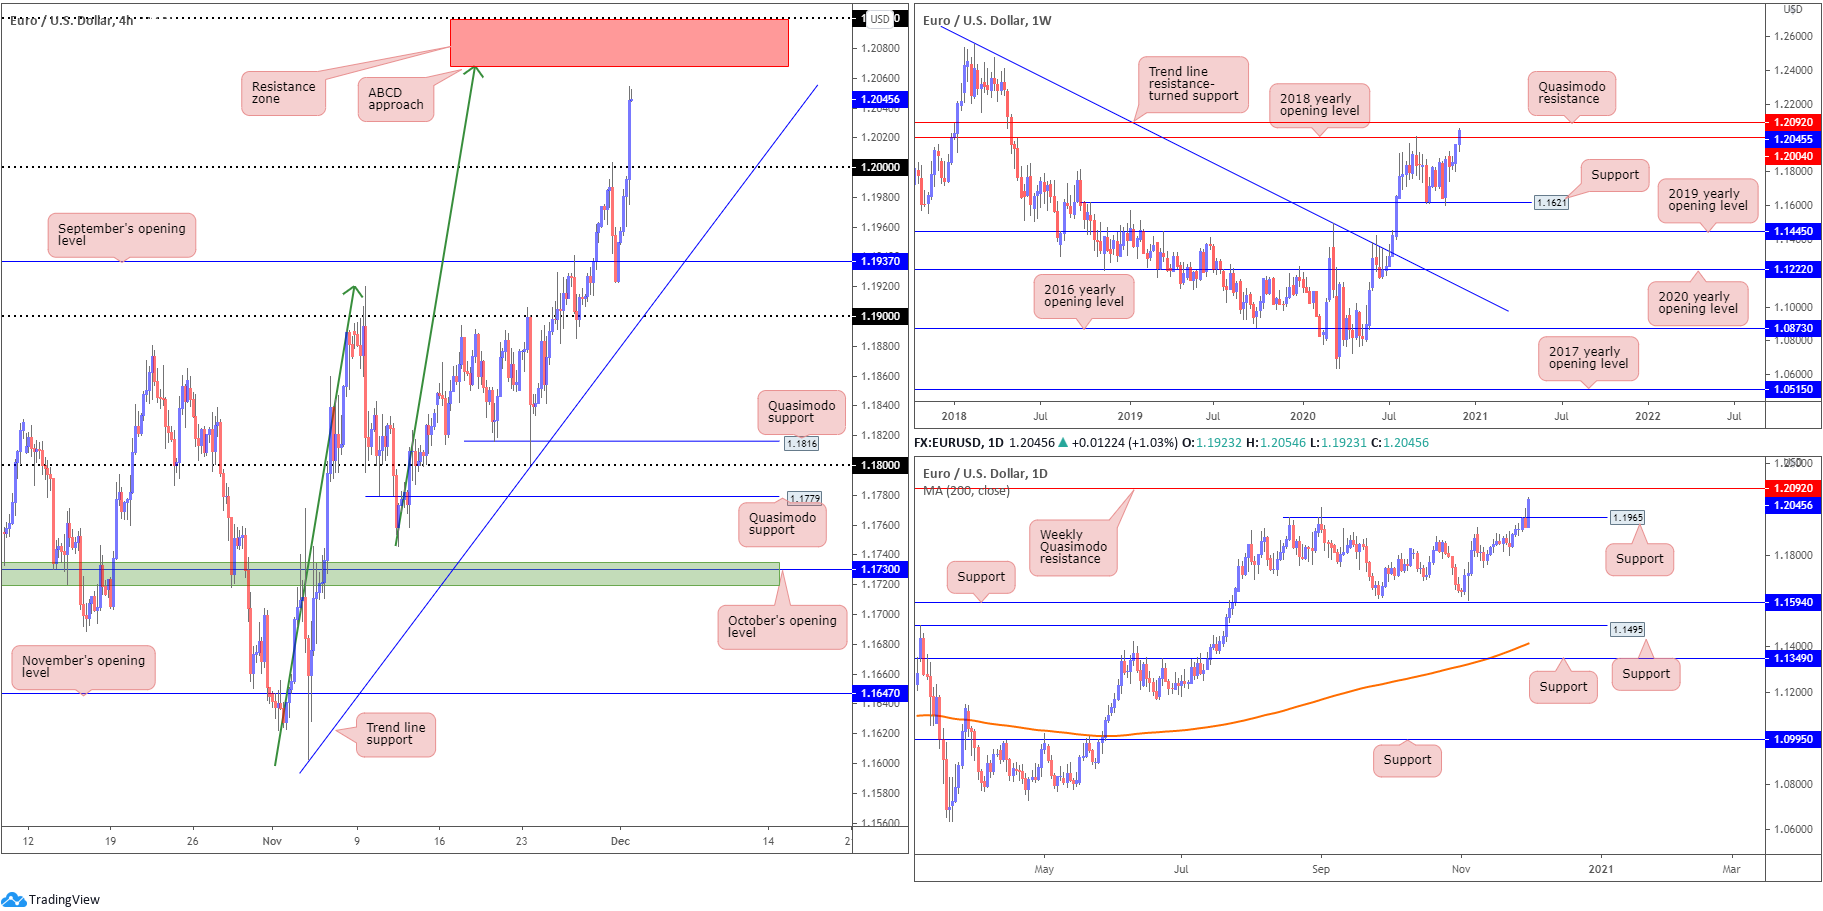
EUR/USD:
Europe’s single currency advanced to fresh YTD peaks against a broadly softer US dollar on Tuesday, with H4 surpassing the key figure 1.20 and shining the spotlight on a resistance area at 1.21/1.2068 (red), composed of the 1.21 handle, resistance on the weekly timeframe at 1.2092 (a Quasimodo formation) and a H4 ABCD approach (green arrows) at 1.2068.
Meanwhile, on the weekly timeframe we can see price action dislodged the 2018 yearly opening value at 1.2004 yesterday, with Quasimodo resistance at 1.2092 standing out as the next upside objective on this chart. A similar picture is visible on the daily scale, following the removal of Quasimodo resistance at 1.1965 (now possible support).
Areas of consideration:
- The trend, seen clearly from the daily timeframe since 2020, was confirmed yesterday, following a retest off September’s opening value at 1.1937 on the H4. Resistance at 21/1.2068 is now likely a watched zone by countertrend traders and also those long this market as a take-profit zone.
- Should price retreat prior to testing 1.21/1.2068, a retest at 1.20 is a scenario to be aware of.
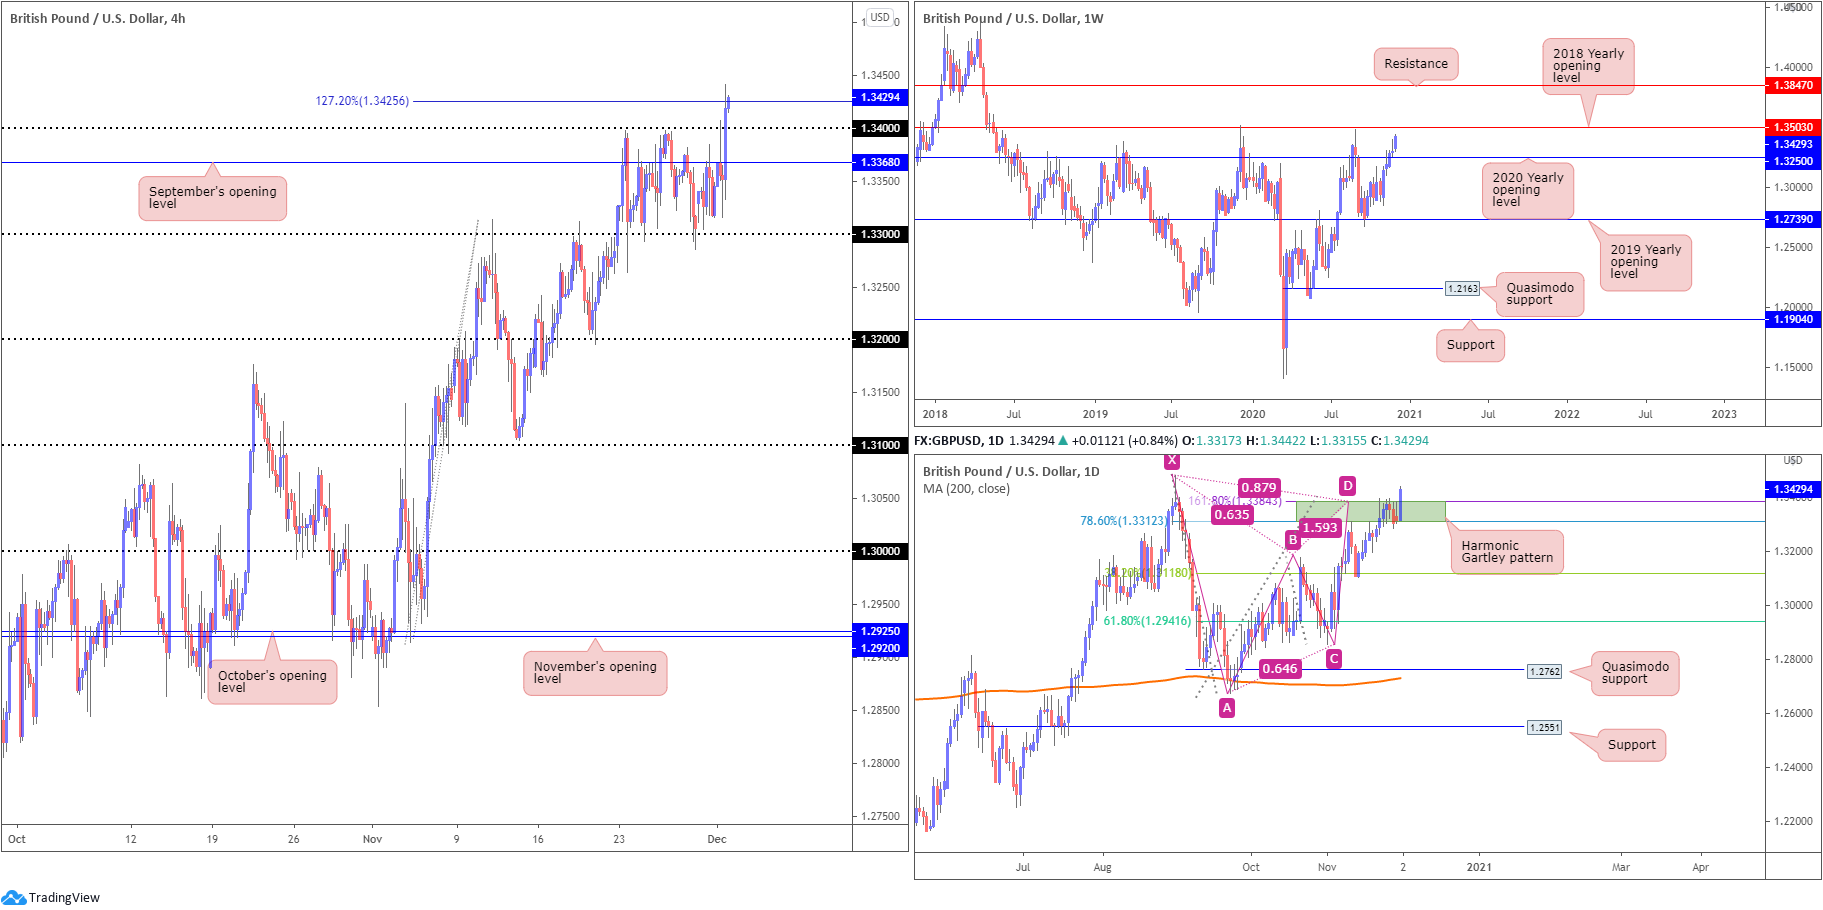
GBP/USD:
GBP/USD bulls entered a strong offensive phase Tuesday on the back of the US dollar index nosediving through 91.50.
H4 cleared September’s opening value at 1.3368 and also mustered enough strength to overthrow the 1.34 region. The 127.2% Fibonacci projection point at 1.3425, as you can see, was also recently brought into the picture. A violation of this resistance throws the 1.3483 September peak into the mix.
Interestingly, 1.3483 also represents the X point of a daily bearish harmonic Gartley pattern. Note the pattern’s PRZ at 1.3384/1.3312 was taken as a result of yesterday’s bullish flow. While price already tested the 38.2% Fibonacci retracement ratio at 1.3118 (arranged from legs A-D [common take-profit target) out of the harmonic zone, the Gartley remains active until the X point is consumed.
Higher up on the curve, weekly price continues voyaging north of the 2020 yearly opening value at 1.3250, with further buying to draw in the 2018 yearly opening value at 1.3503 (conveniently sited around the 1.3483 September peak).
Areas of consideration:
- Outdoing the 1.34 handle on the H4 potentially sets the stage for a continuation move towards 1.35 and, by extension, the weekly resistance level at 1.3503 (2018 yearly opening value). Conservative buyers will likely be watching for a 1.34 retest to form to secure an entry.
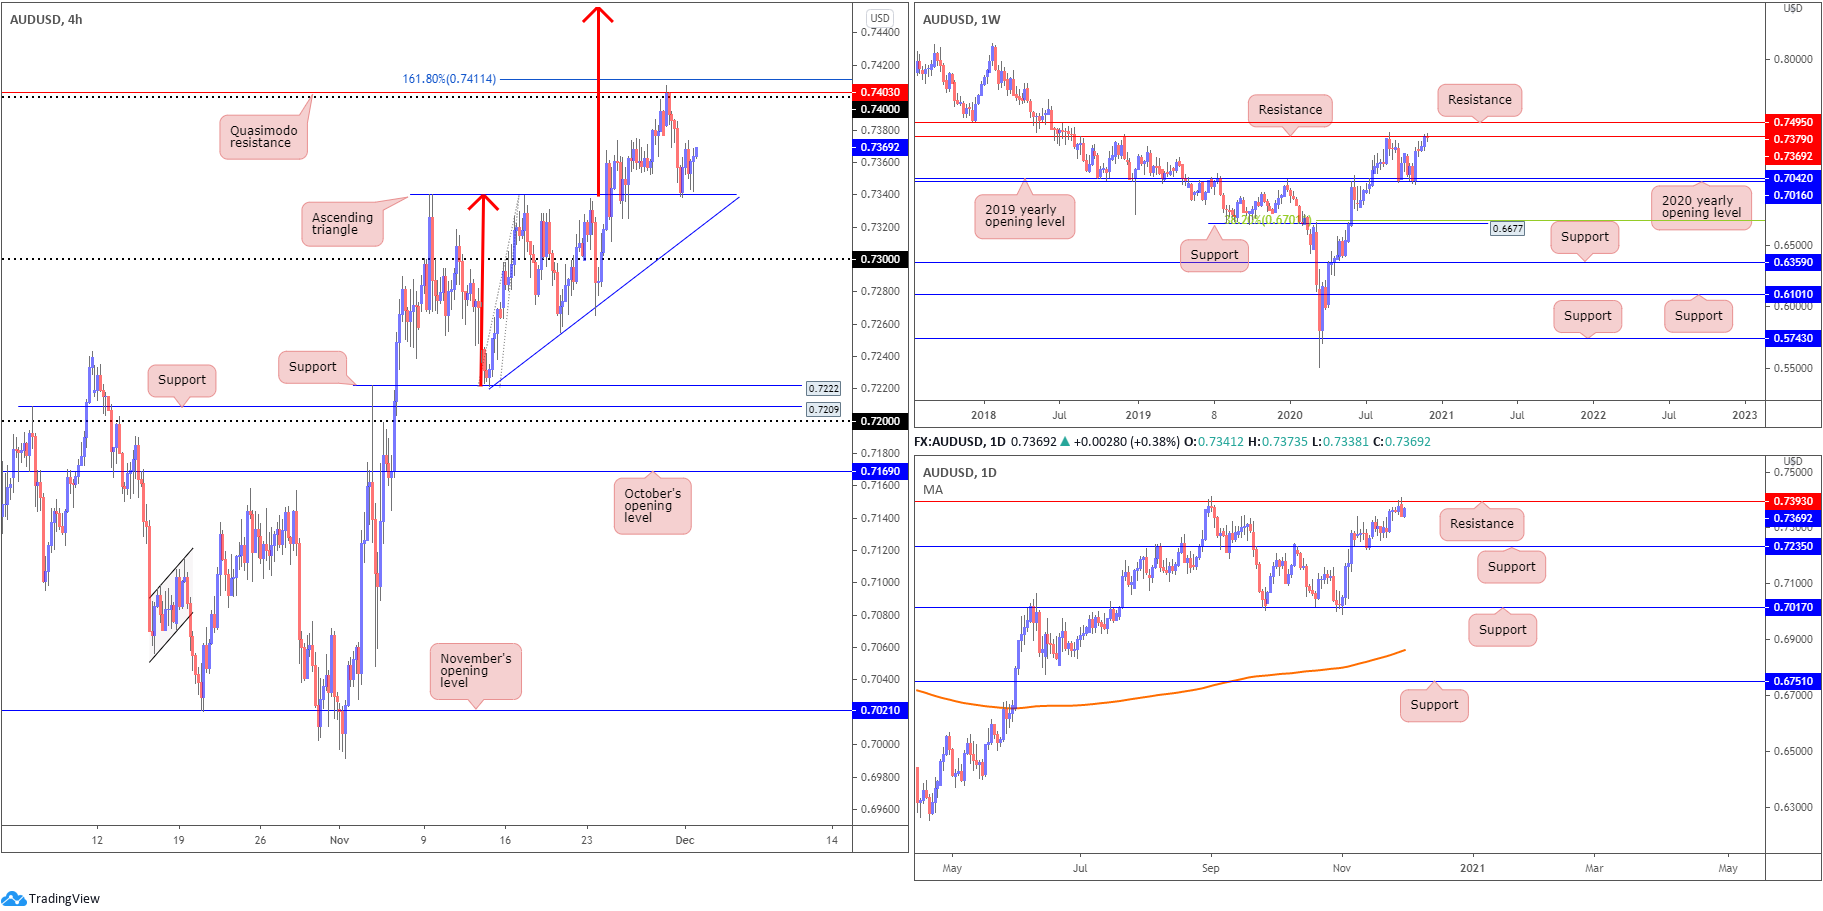
AUD/USD:
Although the Australian dollar managed to eke out marginal gains vs. the buck Tuesday, AUD/USD’s performance was somewhat thin in comparison to some of its G10 peers.
Recent trading on the H4 timeframe reveals technical movement breached the top side of a H4 ascending triangle pattern (0.7340), leading to a test of the 0.74 handle, as well as Quasimodo resistance at 0.7403 and the nearby 161.8% Fibonacci projection point at 0.7411. This witnessed Monday retreat and test ascending triangle support at 0.7340, which modestly encouraged buying Tuesday.
The weekly timeframe shows resistance in play at 0.7379, a level brought into play following a strong showing off the 2020 (0.7016) and 2019 (0.7042) yearly opening values (supports) in early November. In view of this market trending higher since early 2020, buyers may also be eyeballing resistance parked at 0.7495.
Following November 13 retest of support at 0.7235, buyers eventually found some grip and crossed swords with resistance at 0.7393 on Friday (positioned above weekly resistance) and stirred sellers Monday. This represents a level that has capped upside since December 2018. Given the lack of downside pressure witnessed Tuesday, buyers may be looking to clear 0.7393, fuelling the prospect of a rally to weekly resistance mentioned above at 0.7495.
Areas of consideration:
- Buyers holding ascending triangle support at 0.7340, together with the current uptrend since March of this year, could attract additional buyers to eventually overrun 0.74 and corresponding higher timeframe resistances.
- 73 may offer possible support should 0.7340 give way.
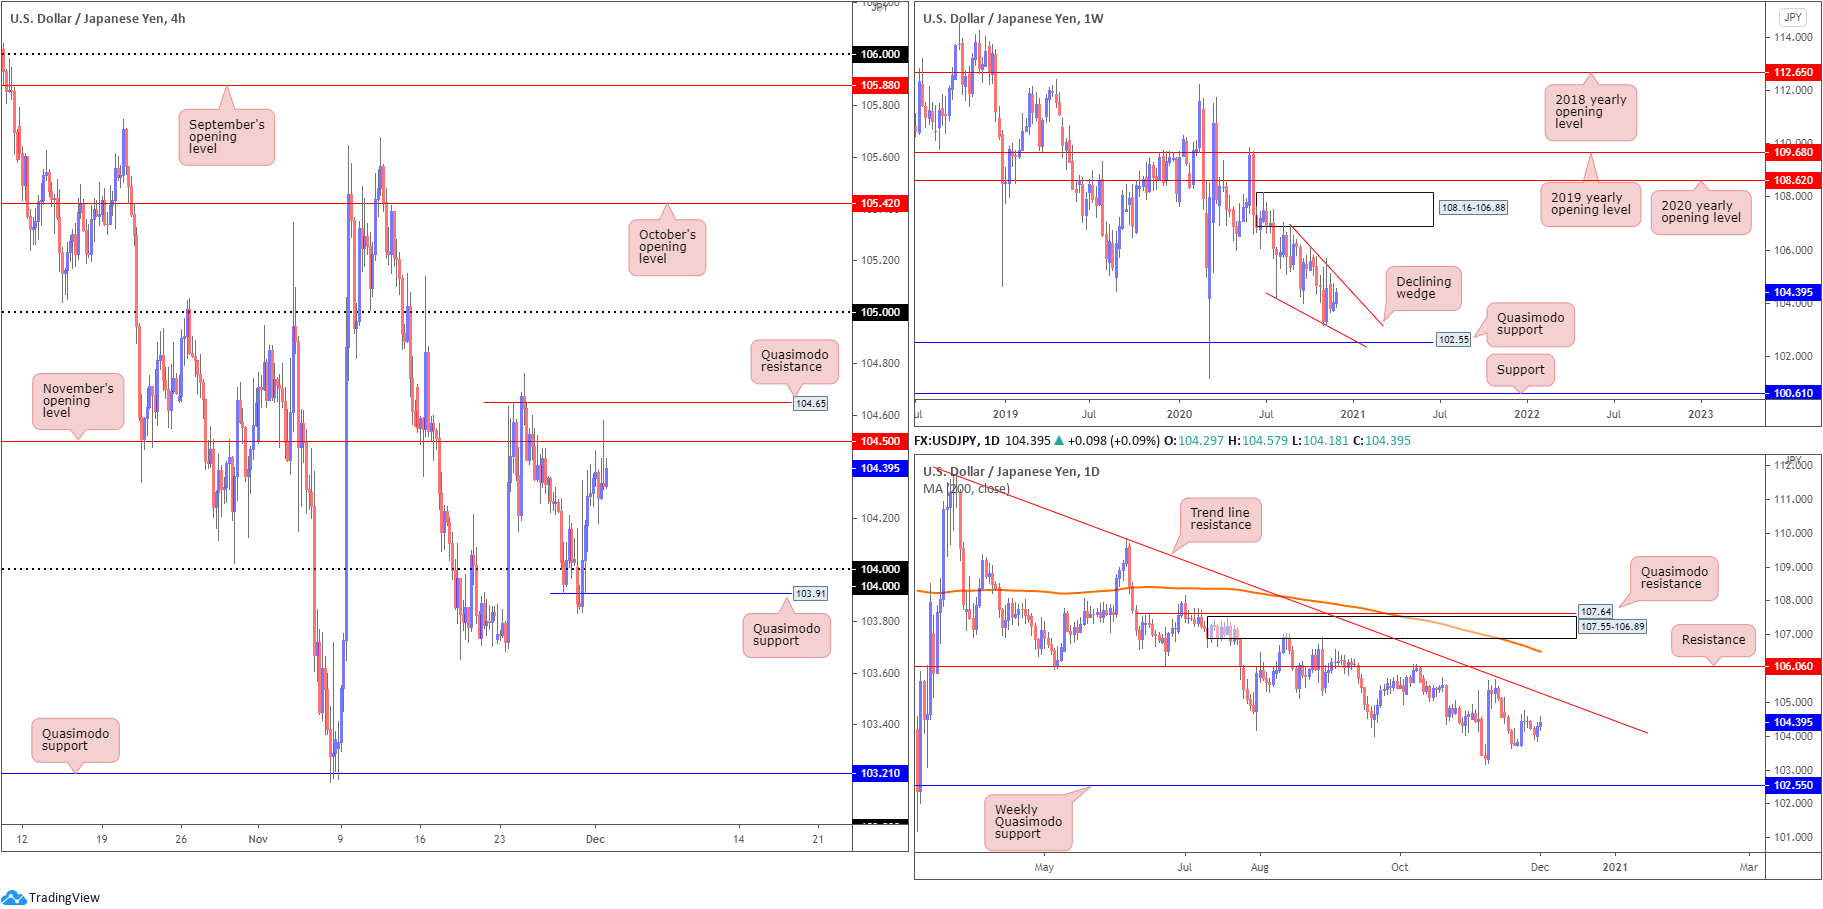
USD/JPY:
USD/JPY finished the session mostly unmoved, despite treasury yields soaring and the US dollar index refreshing YTD troughs.
November’s opening value at 104.50 on the H4 timeframe served as resistance on Tuesday, as price faded session highs at 104.57. Quasimodo resistance is also plotted nearby at 104.65. Note also there’s a reasonably clear runway visible north of 104.65 towards the 105 region. Lower, traders will also acknowledge the 104 handle and Quasimodo support at 103.91.
Higher timeframe technical action is also unchanged.
From the weekly timeframe (italics):
Since connecting with the underside of supply at 108.16-106.88 in August, price has gradually shifted lower and developed a declining wedge (106.94/104.18).
Quasimodo support at 102.55 is in the picture this week, with a break revealing support plotted at 100.61. A strong bounce from 102.55 may provide enough impetus for buyers to attempt a breakout above the current declining wedge.
Daily timeframe (italics):
The technical landscape from the daily timeframe reveals scope to close in on trend line resistance, extended from the high 111.71.
Sellers taking over, however, could lead price to the 103.17 November 6 low, followed by the noted weekly Quasimodo support at 102.55.
Areas of consideration:
Outlook mostly unchanged.
- H4 Quasimodo resistance at 104.65 and November’s opening value at 104.50 offers an area of possible resistance to work with. The lack of higher timeframe confluence here, however, may trigger a cautious bearish tone. Breaking 104.65, therefore, highlights intraday space to reach 105.
- Newly formed Quasimodo support at 103.91 on the H4 is also noteworthy, posted just under the 104 handle – this area also lacks a higher timeframe connection.
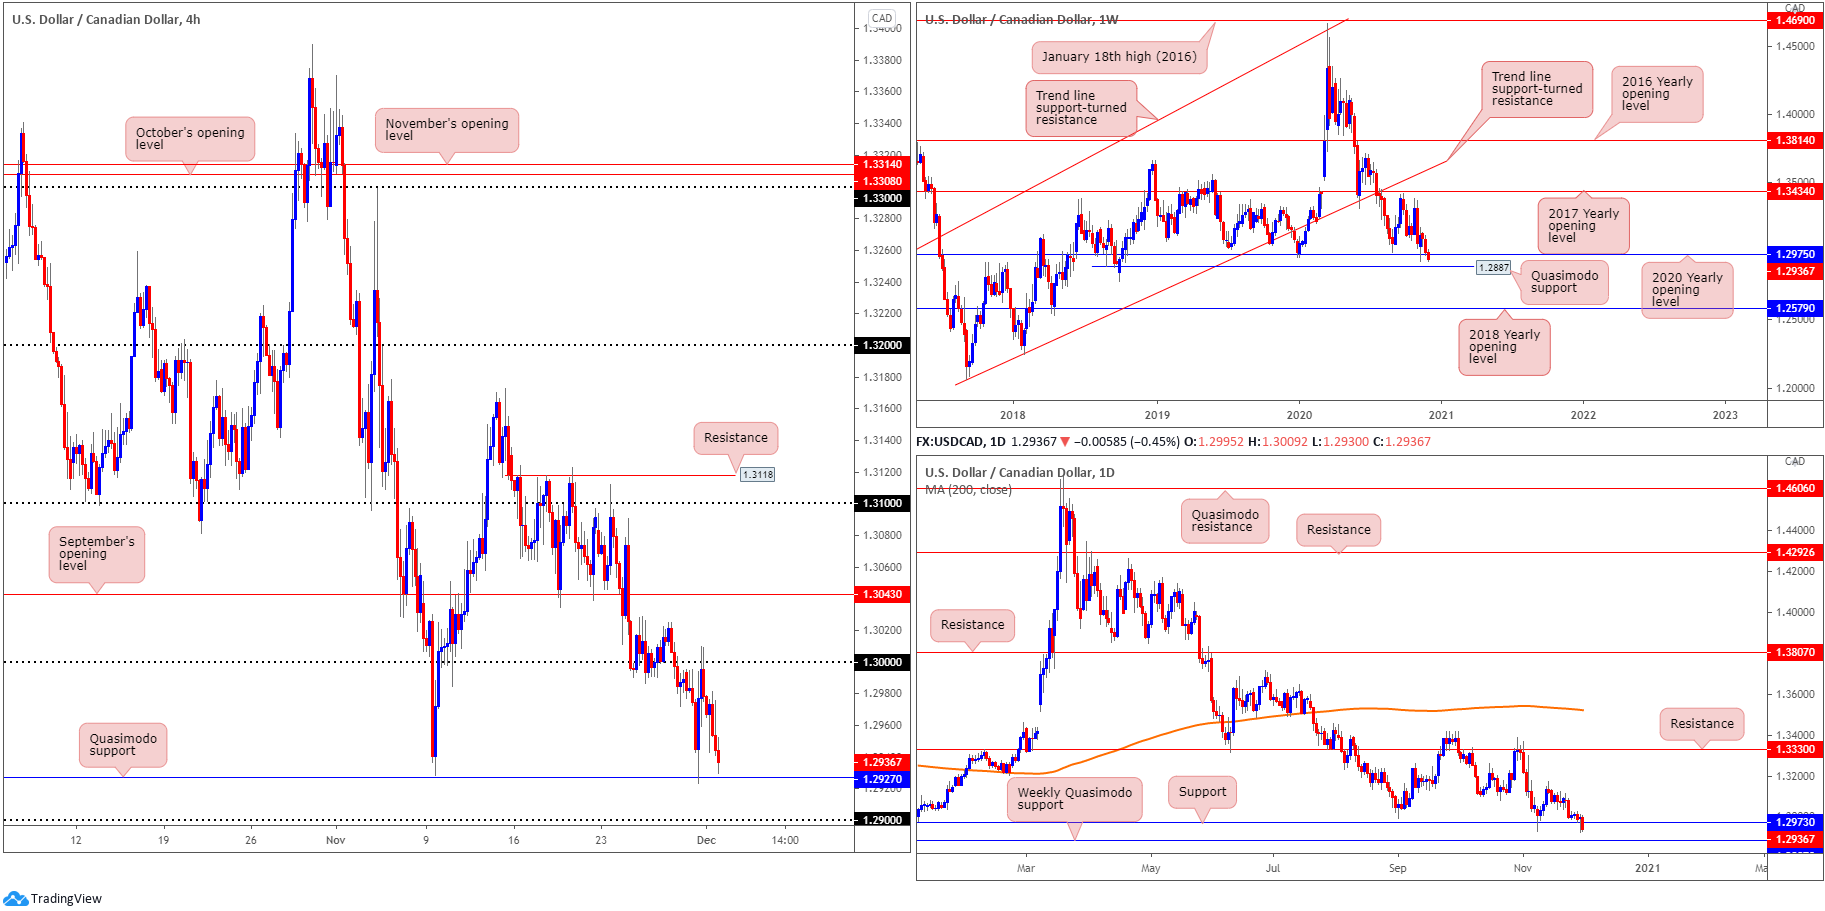
USD/CAD:
USD/CAD traders shrugged off less-than-stellar Canadian growth data and waning oil prices Tuesday, fading 1.30 resistance, a key level in this market. Tracking the US dollar index, USD/CAD travelled to lows just ahead of H4 Quasimodo support at 1.2927, located just north of the 1.29 handle.
Of particular interest in this market are the higher timeframes. Weekly support, the 2020 yearly opening value, at 1.2975 remains under fire, shedding light on Quasimodo support priced in at 1.2887.
Monday’s weekly technical briefing had the following to report on the weekly scale (italics):
Breaking 1.2975 remains an option. Not only did the 1.2975 bullish rejection in early November fail to attract follow-through interest, this market has traded lower since topping at 1.4667 in early 2020. So, while buyers could still make an appearance, technical evidence favours a dip to Quasimodo support at 1.2887, according to chart structure.
By the same token, the daily timeframe also reveals support at 1.2973 (essentially the same area as weekly support) is also under pressure, suggesting weekly Quasimodo support mentioned above at 1.2887 is likely to make a show.
Areas of consideration:
- The current downtrend, along with higher timeframe supports giving way, suggest H4 Quasimodo support at 1.2927 may be soft.
- 29 calls for attention should 1.2927 yield. 1.29, technically speaking, shapes strong support confluence in light of its close connection with higher timeframe supports around 1.2887.
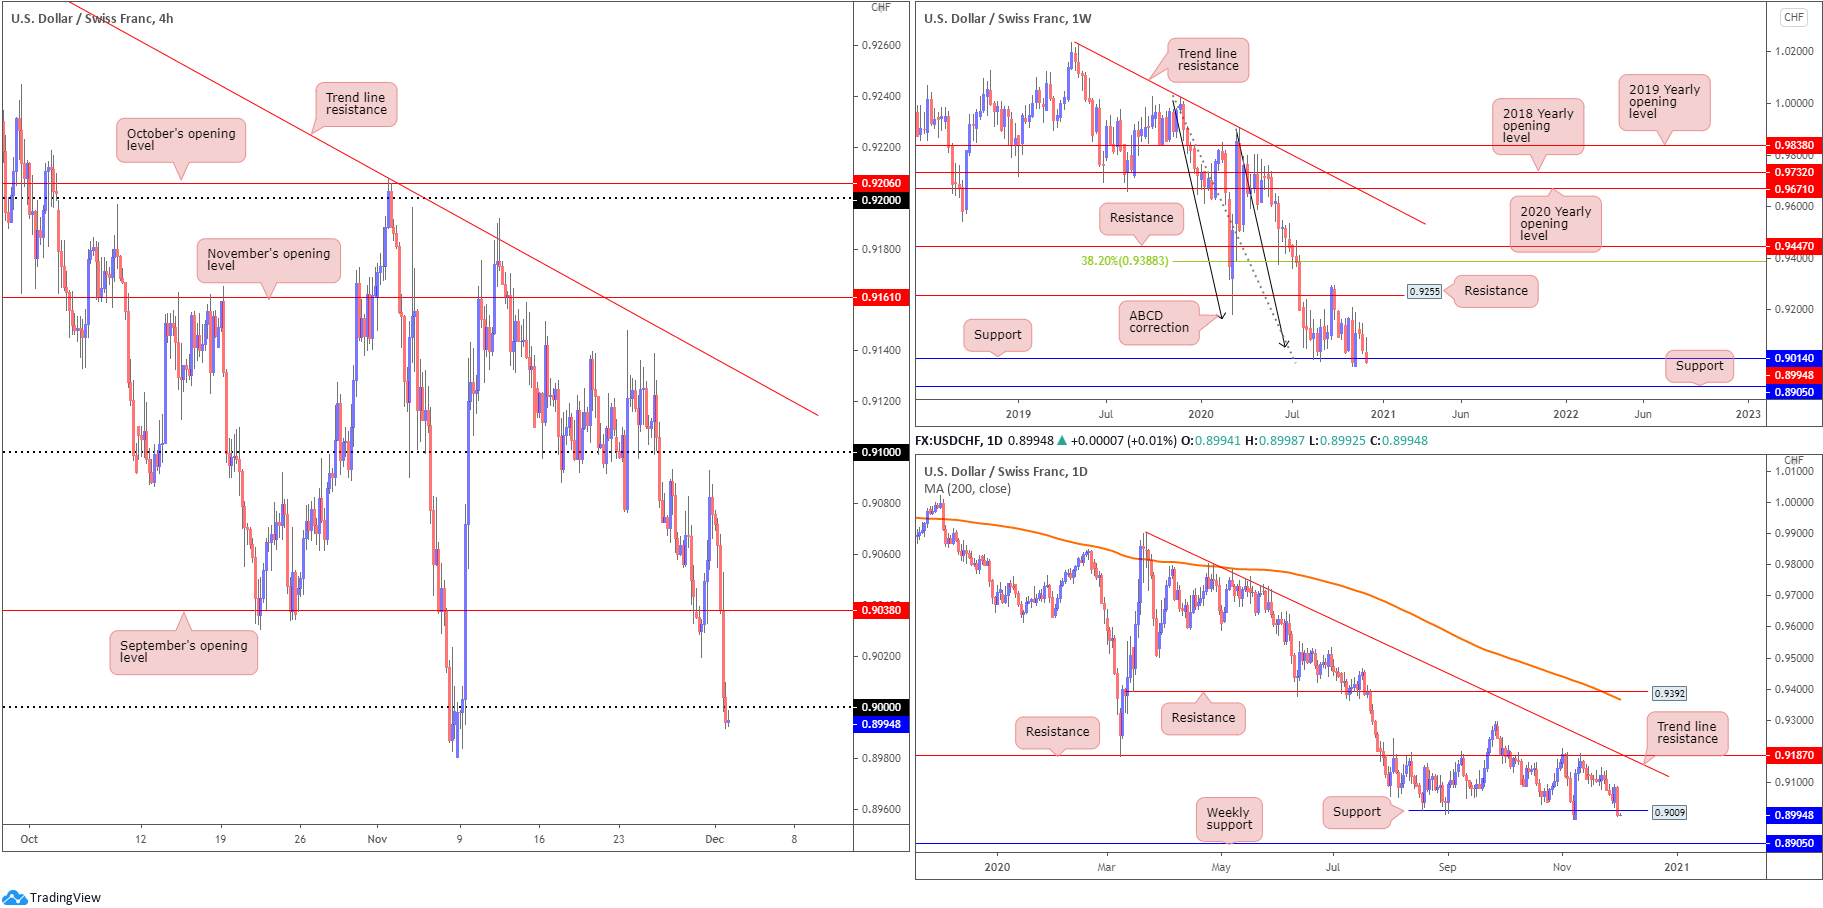
USD/CHF:
Despite Monday’s daily bullish engulfing candle, USD/CHF slumped to multi-week lows during US hours on Tuesday. Down nearly 1%, this led H4 candles through September’s opening value at 0.9038 as well as the key figure 0.90, just north of YTD troughs at 0.8980.
From the weekly timeframe, price is seen trading around support at 0.9014 (dovetailing closely with ABCD support at 0.9051 [black arrows]). A recovery points to 0.9255 resistance (a prior Quasimodo support). Clearance of 0.9014, however, exposes support at 0.8905. It should also be noted this market has been trending lower since April 2019.
Daily movement took on support at 0.9009 during Tuesday’s session. Assuming sellers hold south of 0.9009, weekly support mentioned above at 0.8905 is in view.
Areas of consideration:
- 90 giving way in recent hours is considered a bearish cue, though with YTD troughs lingering close by at 0.8980, sellers could struggle. This twenty-pip area, therefore, will be an interesting watch. Pushing through 0.8980 signals sellers may take things to the 0.89 handle, clipped together with weekly support at 0.8905. Reclaiming 0.90, on the other hand, suggests buyers may attempt to defend weekly and daily supports.
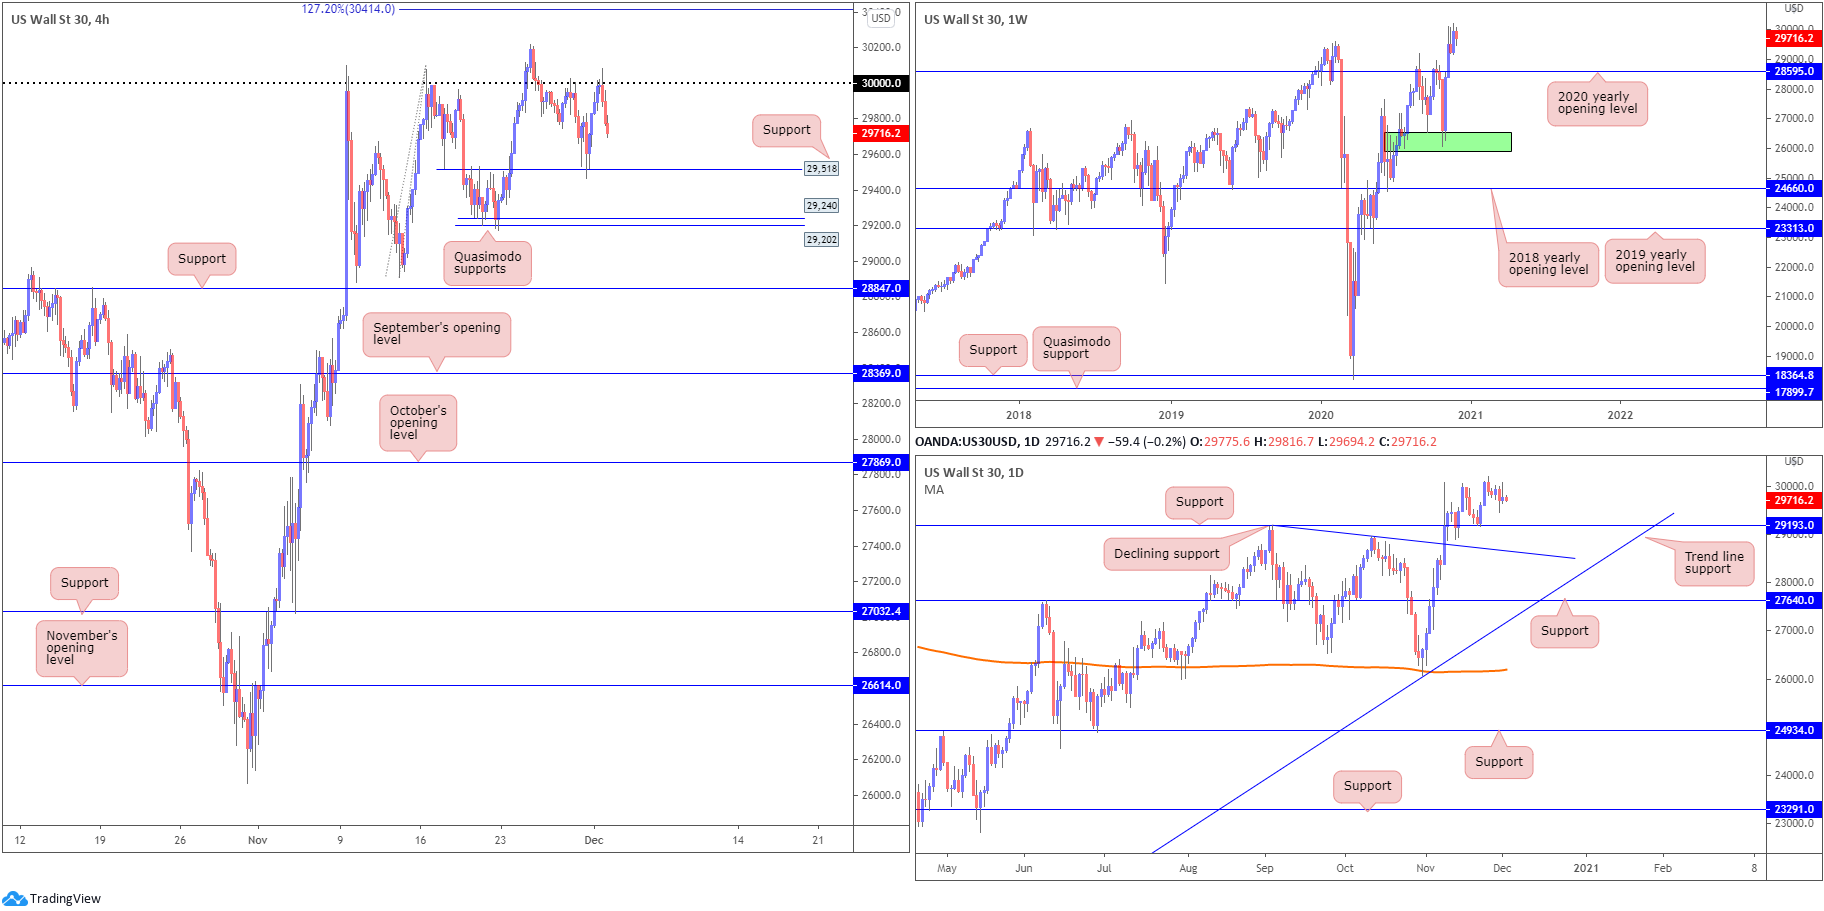
Dow Jones Industrial Average:
US equities firmed Tuesday amid month-end flow and renewed stimulus hopes. The Dow Jones Industrial Average added 185.28 points, or 0.63%; the S&P 500 traded higher by 40.82 points, or 1.13% and the Nasdaq finished higher by 156.37 points, or 1.28%.
The widely watched 30,000 figure on the H4 capped upside once again on Tuesday, following a decisive recovery off support at 29,518. Quasimodo supports at 29,202 and 29,240 call for attention should buyers give up on 29,518.
The weekly timeframe remains lingering around all-time peaks at 30,217. In the event a correction materialises, the 2020 yearly opening value from 28595 could be an area dip-buyers find interest in. According to the daily timeframe, however, support is seen at 29,193, positioned above a declining support, taken from the high 29,193 (merges closely with 28595 on the weekly scale).
Areas of consideration:
Outlook unchanged.
- Having recently witnessed fresh all-time highs, dip-buyers may seek bullish scenarios off H4 support at 29,518 again today should the level enter play. Failure to respond, focus will then likely shift to H4 Quasimodo supports at 29,202 and 29,240.
- Crossing back above 30,000 may also ignite breakout strategies.
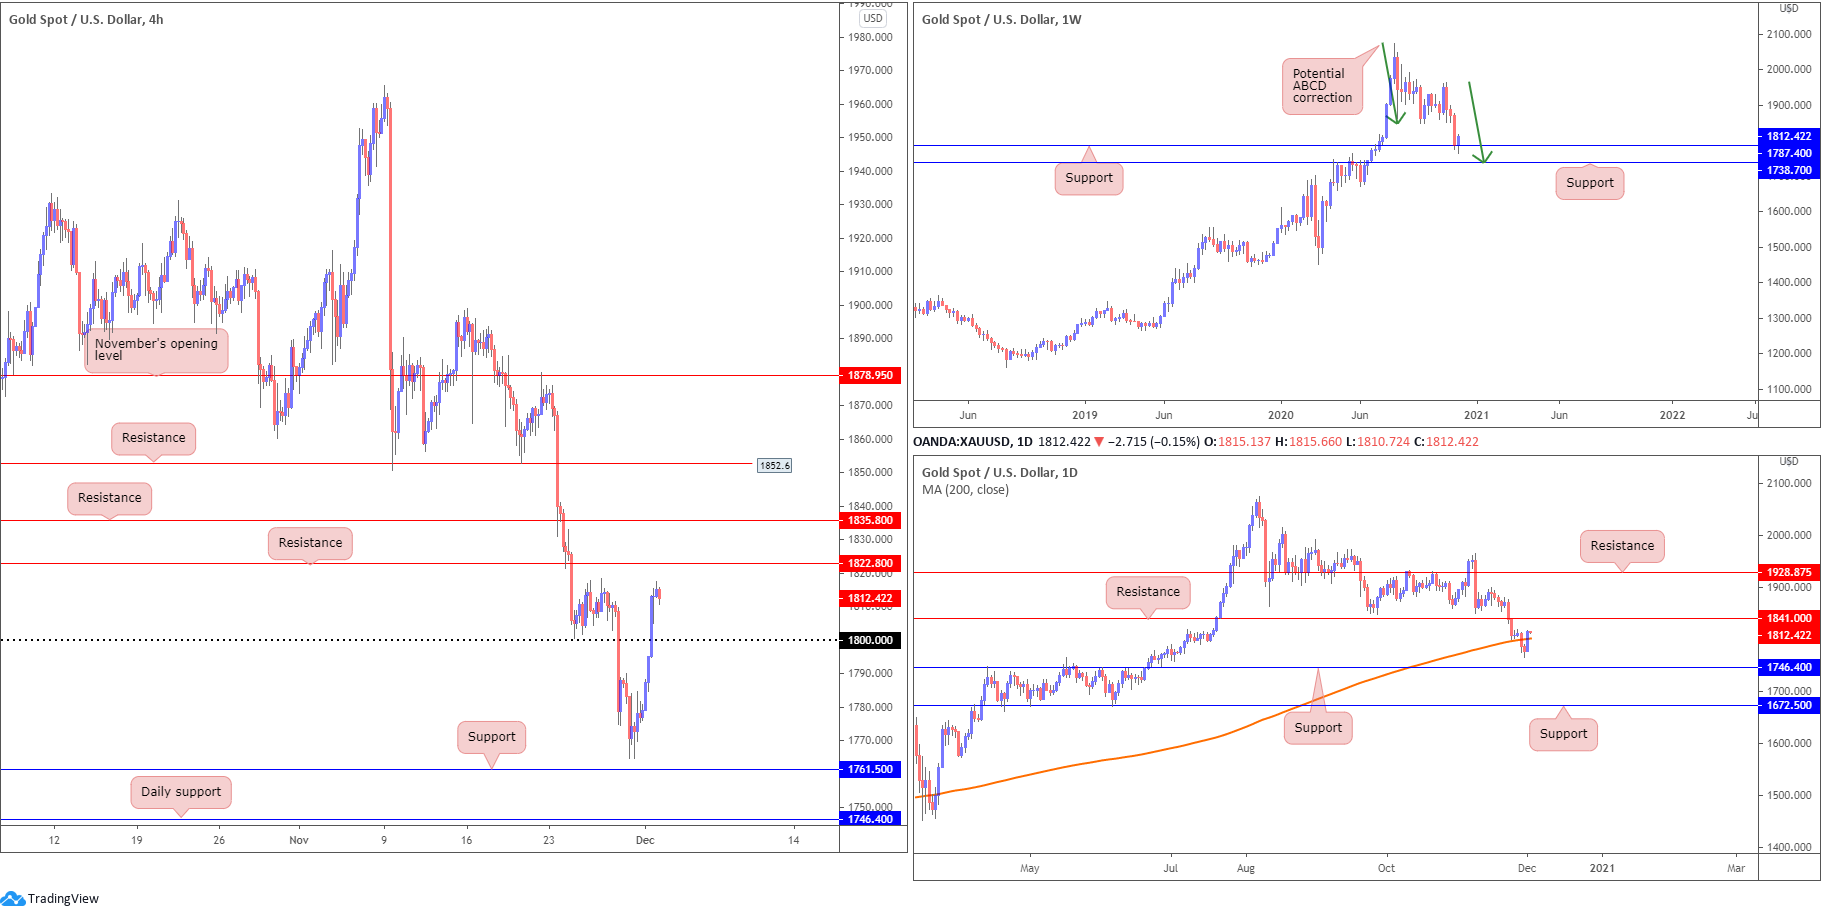
XAU/USD (GOLD):
As the US dollar index collapsed through 91.50, consequently refreshing YTD troughs, spot gold made its way back above $1,800. Aside from local tops around $1,817, resistance at $1,822 is seen, with subsequent upside to perhaps close in on another layer of resistance at $1,835.
Further out, technicians will observe weekly price adopting a bullish stance off support coming in at $1,787, a level situated just north of another support at $1,738 and a potential ABCD correction (green arrows). Helping to authenticate bullish interest, we can see daily price crossed back above its 200-day SMA (orange – $1,801) and positioned resistance at $1,841 in the line of fire.
Areas of consideration:
- Uptrend remains strong (check weekly timeframe).
- $1,800 support, given its connection with the 200-day SMA and weekly price bouncing from $1,787 support.
- Resistance between $1,835 and $1,822 is interesting, though in direct opposition with weekly buyers off support. Therefore, a bearish reaction, if any, may be short-lived.
The accuracy, completeness and timeliness of the information contained on this site cannot be guaranteed. IC Markets does not warranty, guarantee or make any representations, or assume any liability regarding financial results based on the use of the information in the site.
News, views, opinions, recommendations and other information obtained from sources outside of www.icmarkets.com.au, used in this site are believed to be reliable, but we cannot guarantee their accuracy or completeness. All such information is subject to change at any time without notice. IC Markets assumes no responsibility for the content of any linked site.
The fact that such links may exist does not indicate approval or endorsement of any material contained on any linked site. IC Markets is not liable for any harm caused by the transmission, through accessing the services or information on this site, of a computer virus, or other computer code or programming device that might be used to access, delete, damage, disable, disrupt or otherwise impede in any manner, the operation of the site or of any user’s software, hardware, data or property


