
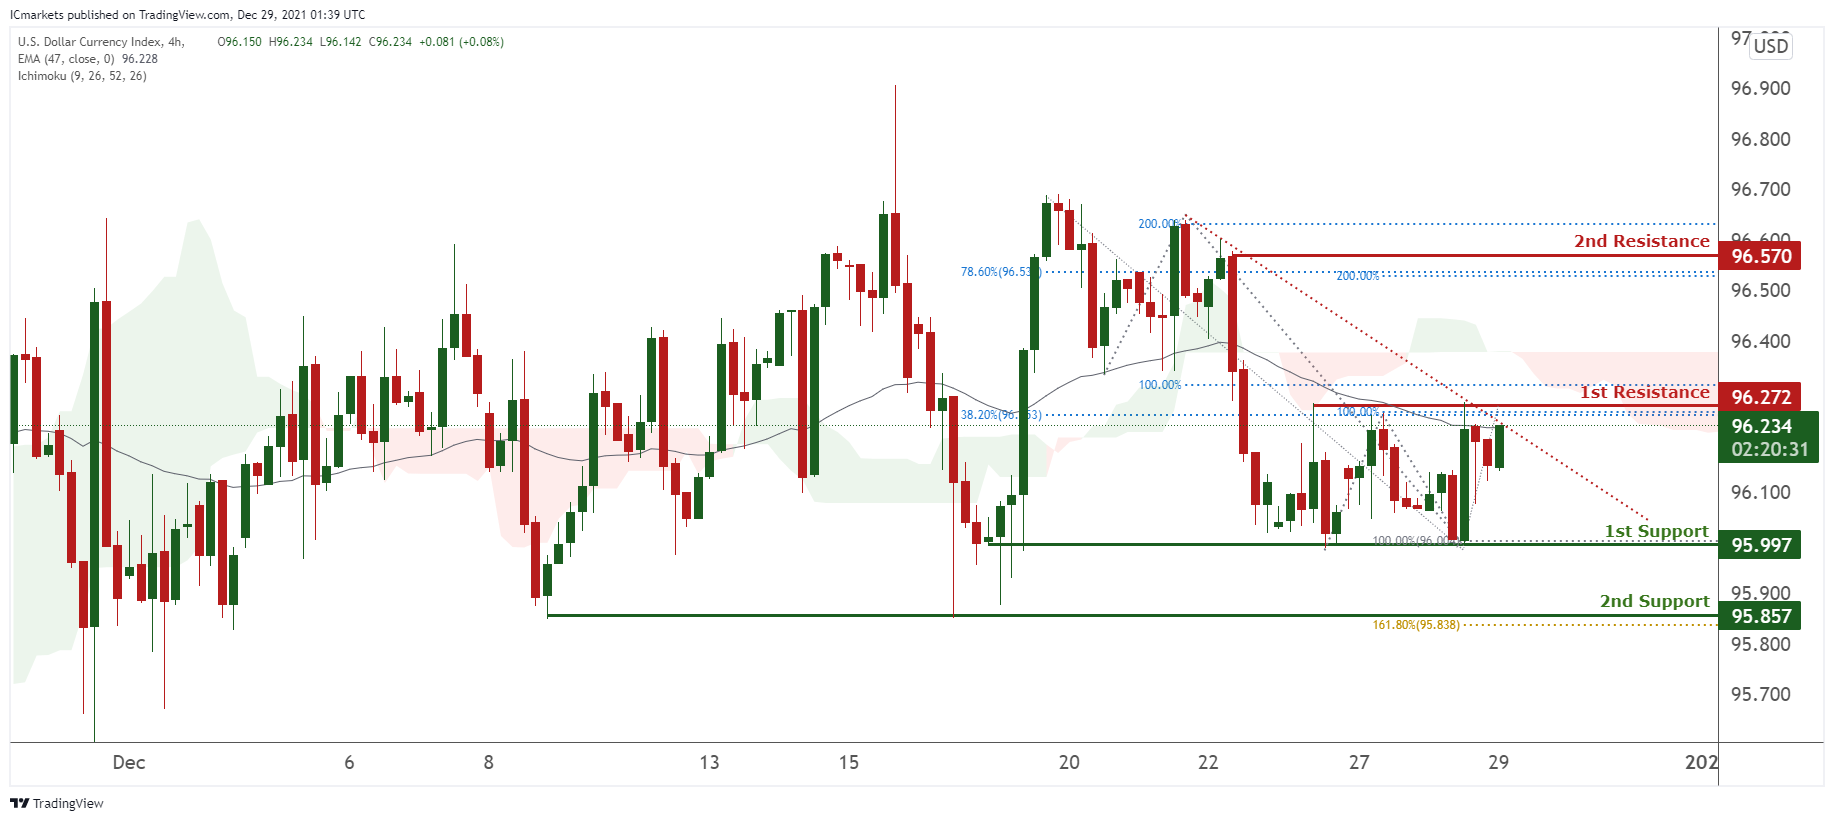
DXY:
On the H4 timeframe, prices are on bearish momentum and abiding to our descending trendline. We would expect a dip from our 1st resistance at 96.272 in line which is an area of fibonacci confluences towards our 1st support at 95.997 in line with 100% Fibonacci retracement. Ichimoku is supporting our bearish bias.
Areas of consideration:
- H4 time frame, 1st resistance at 96.272
- H4 time frame, 1st support at 95.997
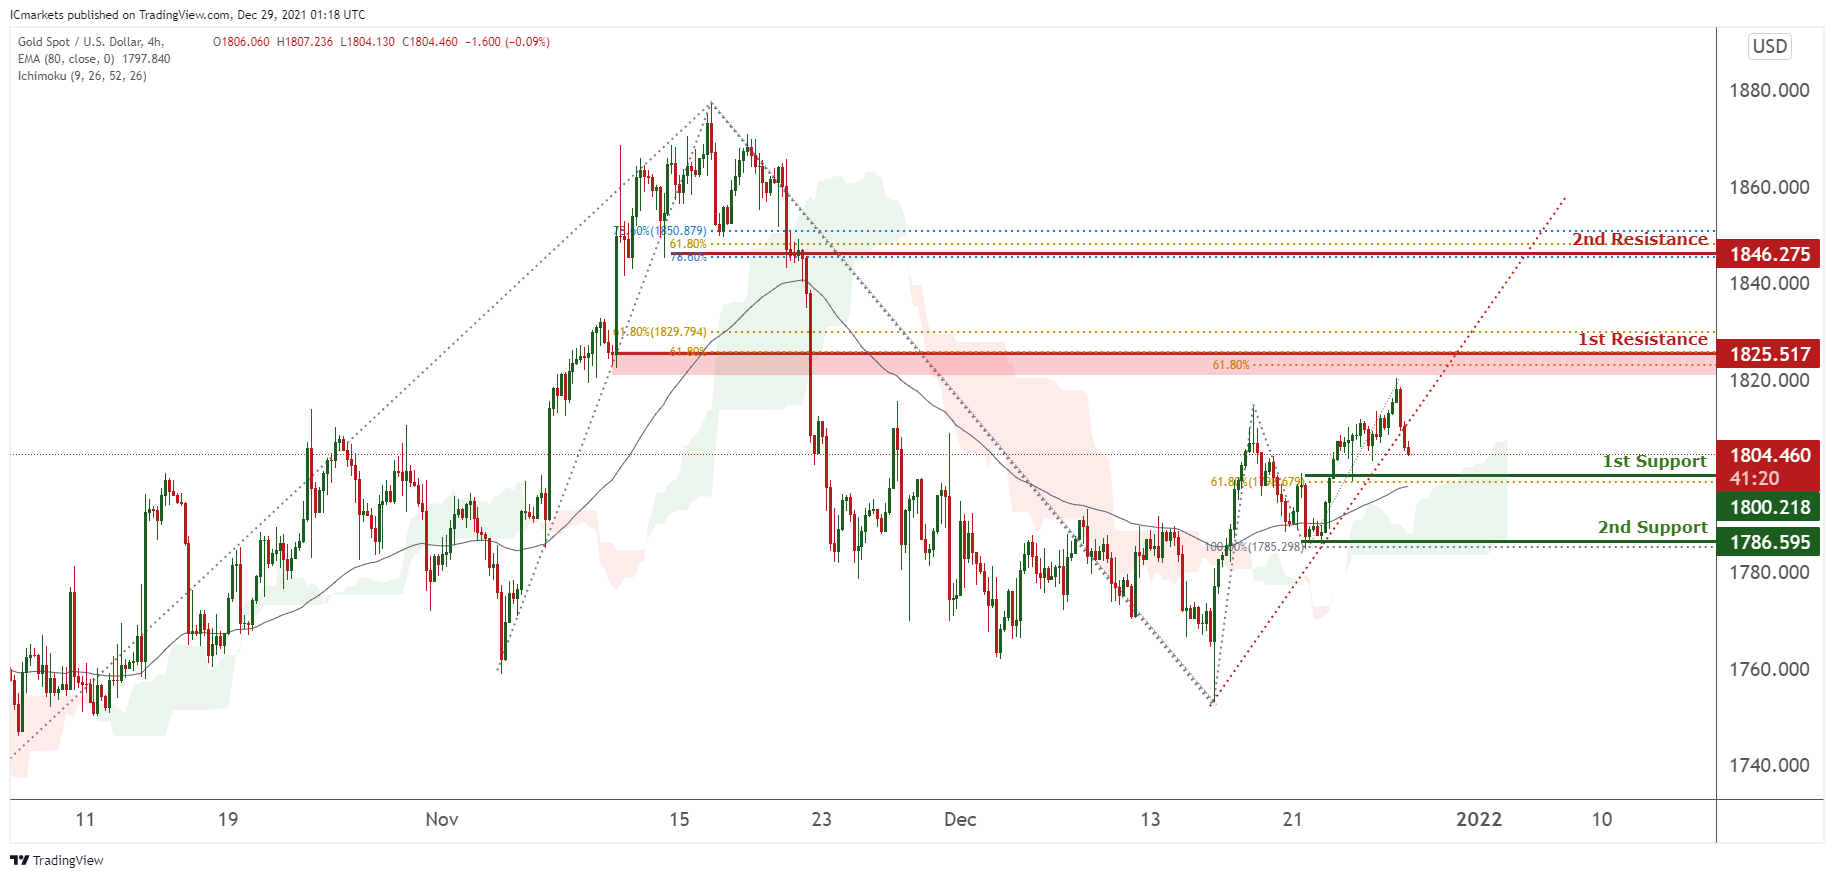
XAU/USD (GOLD):
On the H4 chart, prices have recently broken out of our ascending trendline support. We would watch for a potential reversal at 1st support 1800.28 in line with 61.8% FIbonacci retracement towards our 1st resistance at 1825.517 which is an area of Fibonacci confluences. Technical indicators are showing bullish momentum. Alternatively, prices may climb higher towards our 2nd resistance at 1846.275 which is the next area of Fibonacci confluences.
Areas of consideration:
- 4h 1st support at 1804.460
- 4h 1st resistance at 1825.517
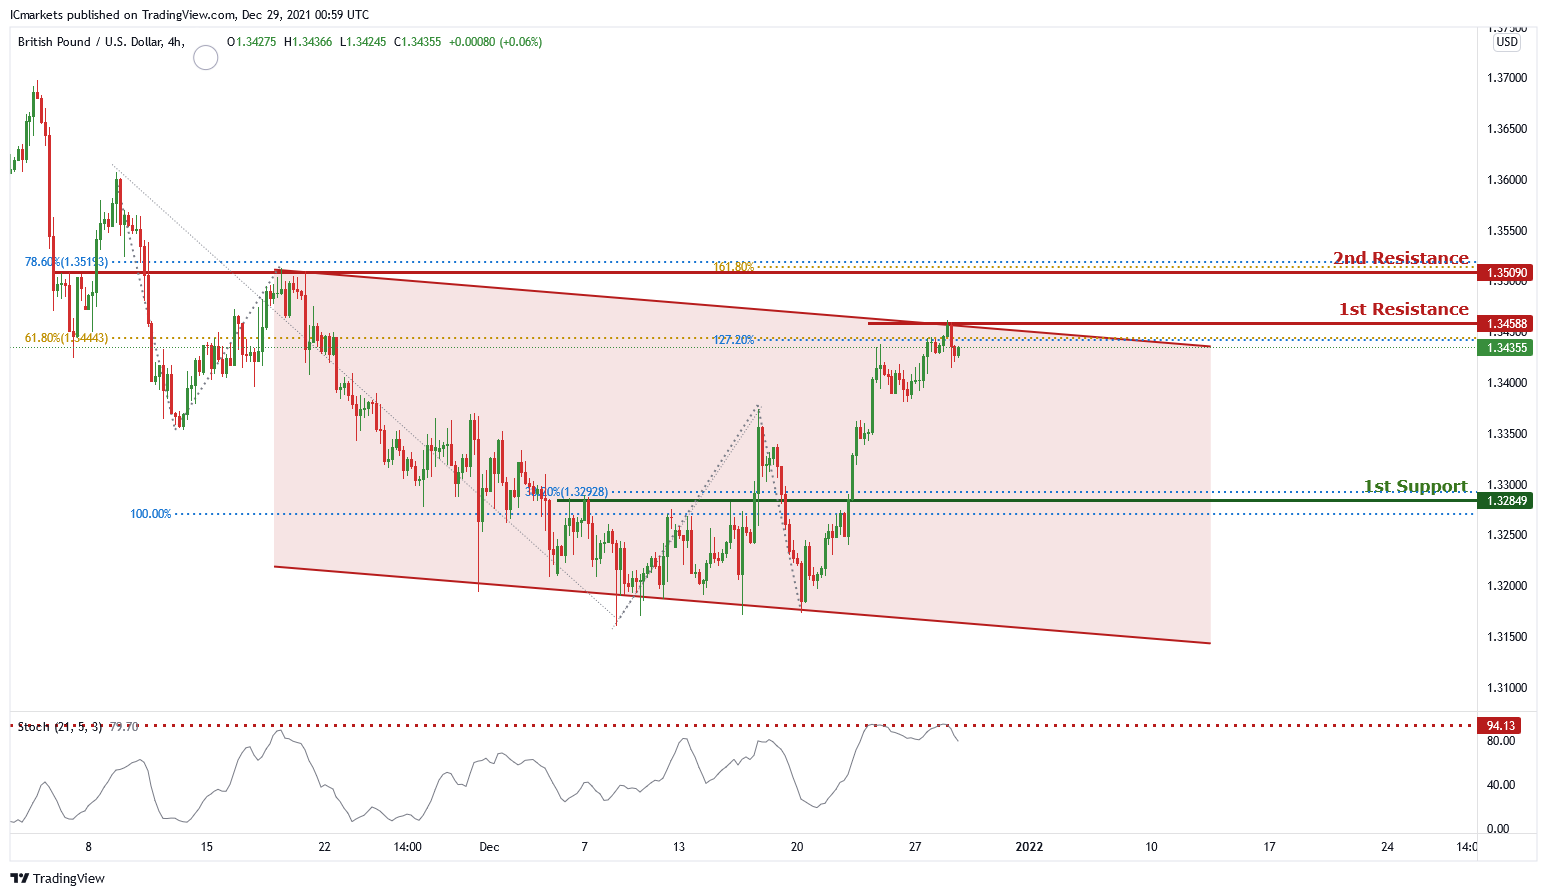
GBP/USD
On the H4 chart, price is trading in a descending channel and near 1st resistance level of 1.34588 which is also 127.2% Fibonacci projection and 61.8% Fibonacci retracement. Price can potentially dip to the 1st support level of 1.32849 which is 100% Fibonacci projection and 38.2% Fibonacci retracement. Our bearish bias is supported by the stochastic indicator as it is near resistance.
Areas of consideration :
- H4 1st resistance at 1.34588
- H4 1st support at 1.32489
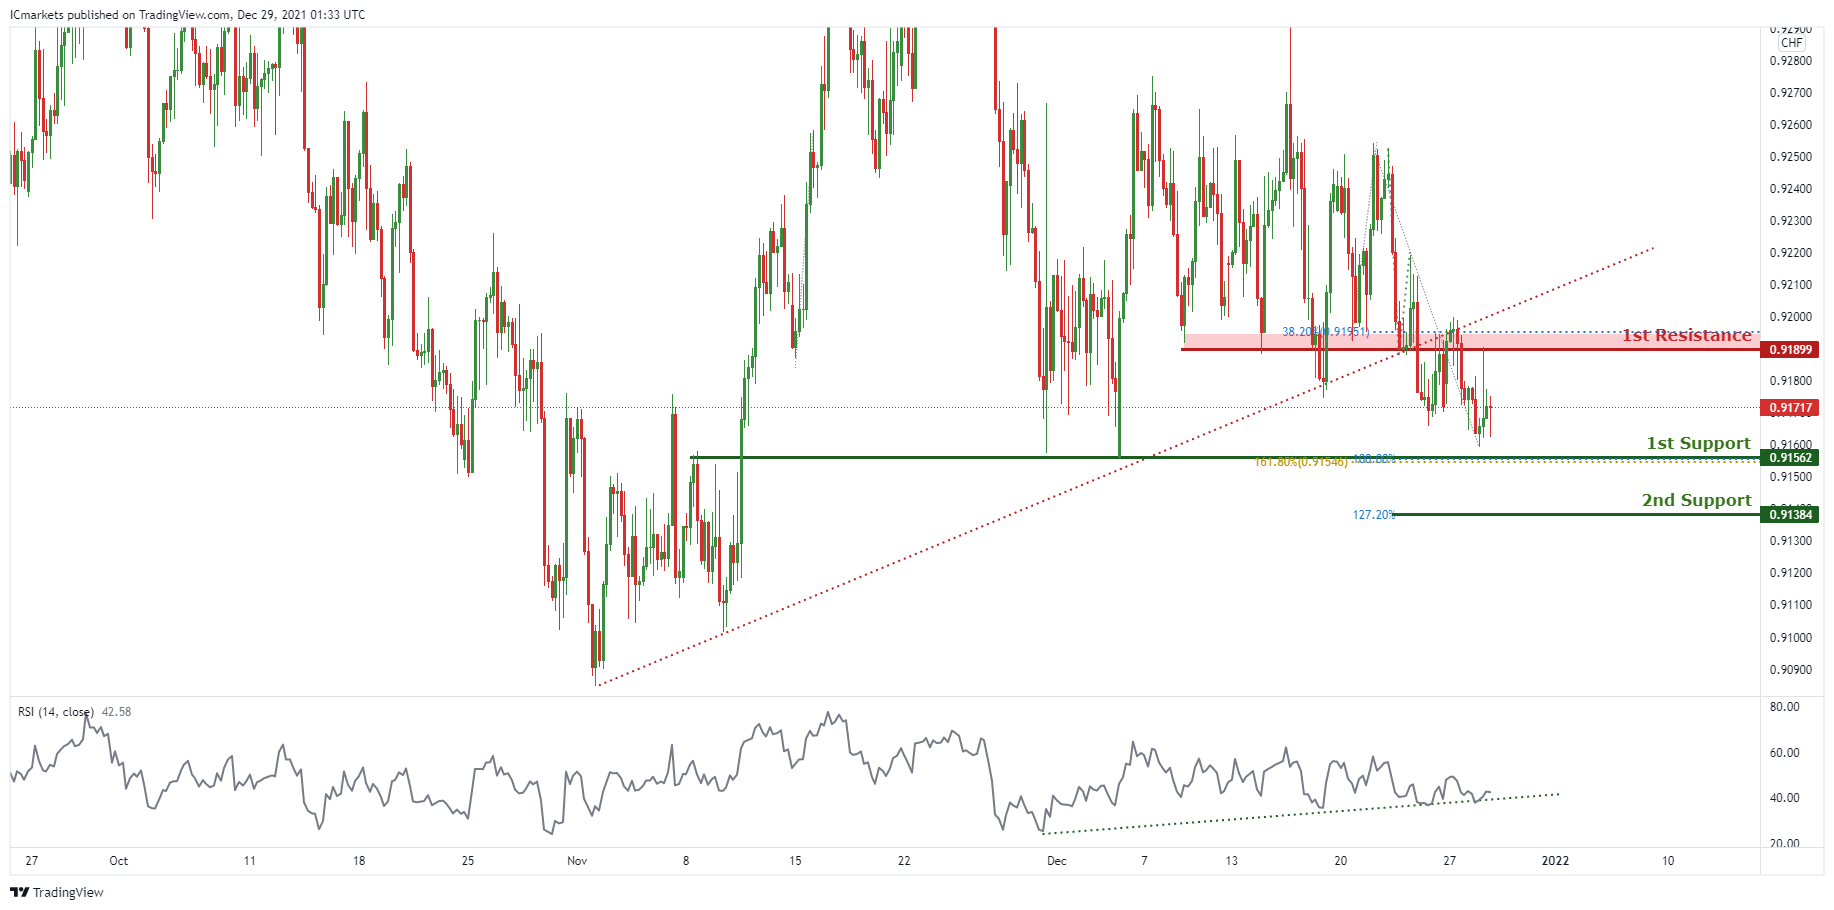
USD/CHF
In reference to yesterday’s analysis, price indeed dropped from the 1st Resistance and moving towards 1st Support. On the H4 timeframe, price broke out of the ascending trendline support, signifying potential bearish momentum. Despite the bearish momentum, we can expect price to make a short-term bullish bounce from 1st Support in line with 161.8% Fibonacci extension, 100% Fibonacci projection and graphical overlap support towards 1st Resistance in line with graphical overlap resistance and 38.2% Fibonacci retracement. Our short-term bullish bias is further supported by the RSI indicator abiding to the ascending trendline support.
Areas of consideration:
- Watch 1st Support at 0.91562
- Watch 1st Resistance at 0.91899
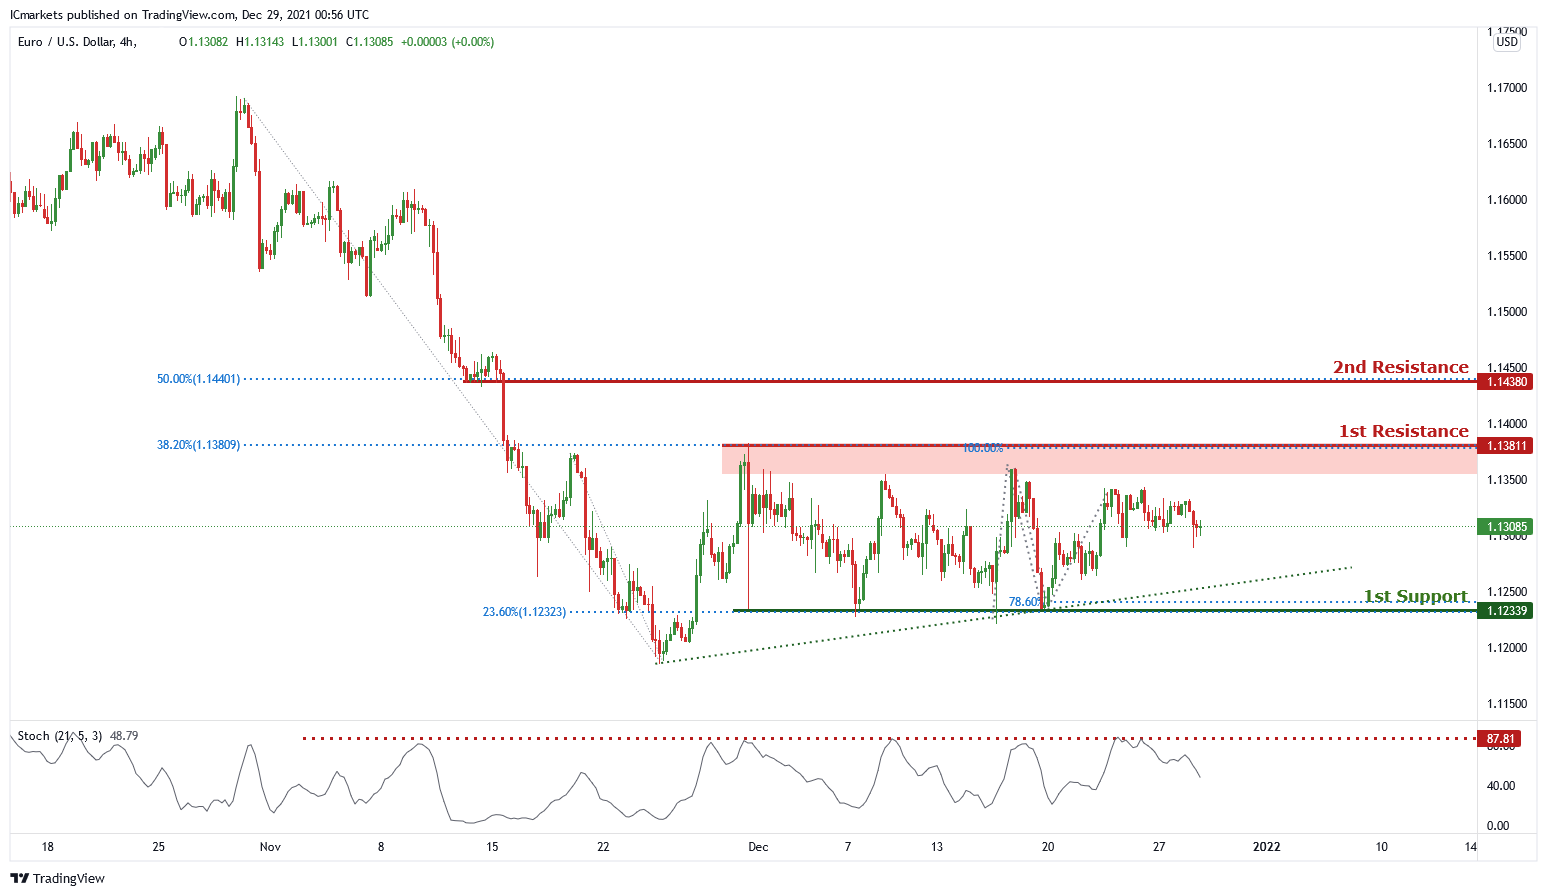
EUR/USD :
On the H4 chart, price is abiding by the ascending trendline and near the first resistance level of 1.13811 which is also 100% Fibonacci projection and 38.2% Fibonacci retracement. Price can potentially dip to the 1st support level of 1.12339 which is also 78.6% Fibonacci projection. Our bearish bias is supported by the ichimoku cloud indicator as price is trading under the cloud
Areas of consideration :
- H4 1st resistance at 1.13811
- H4 1st support at 1.12339
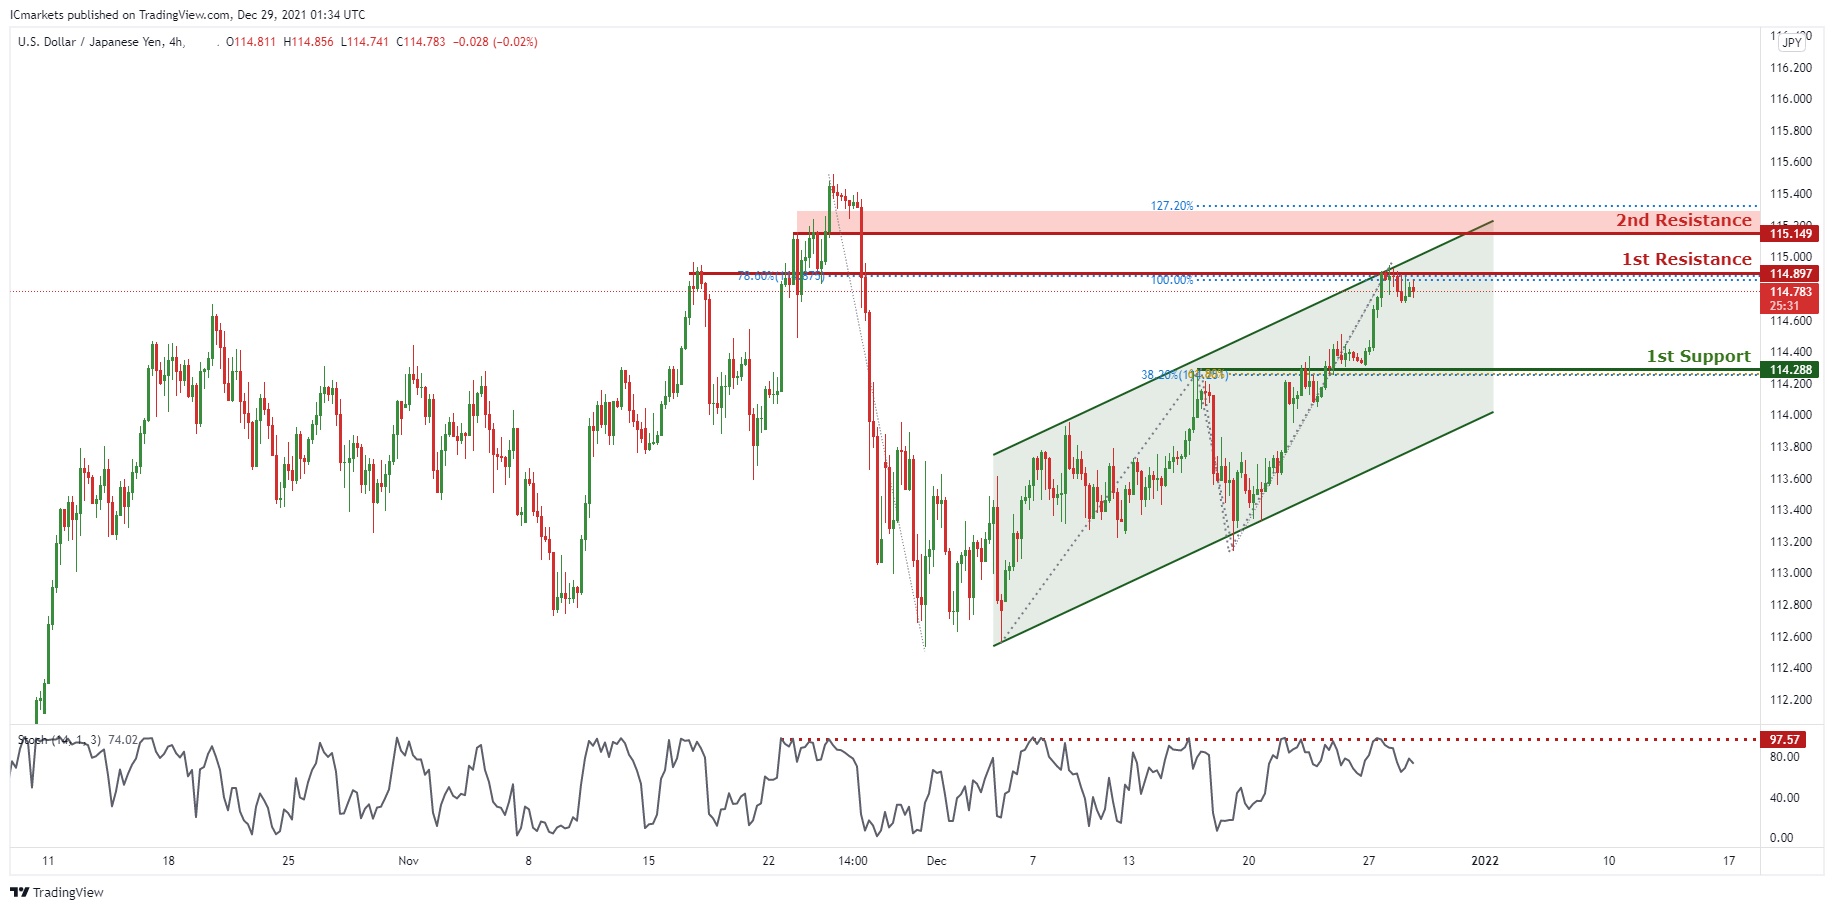
USD/JPY:
On the H4 timeframe, price is abiding to the ascending channel, showing an overall bullish momentum. However, we can expect a short term bearish momentum and drop from 1st resistance in line with graphical overlap resistance ,100% Fibonacci projection and 78.6% Fibonacci retracement towards 1st Support in line with graphical overlap support, 61.8% Fibonacci projection and 38.2% Fibonacci retracement. Our bearish bias is further supported by stochastic where the %K line dropped from the resistance.
Areas of consideration:
- H4 1st resistance level 114.897
- H4 1st support level 114.288
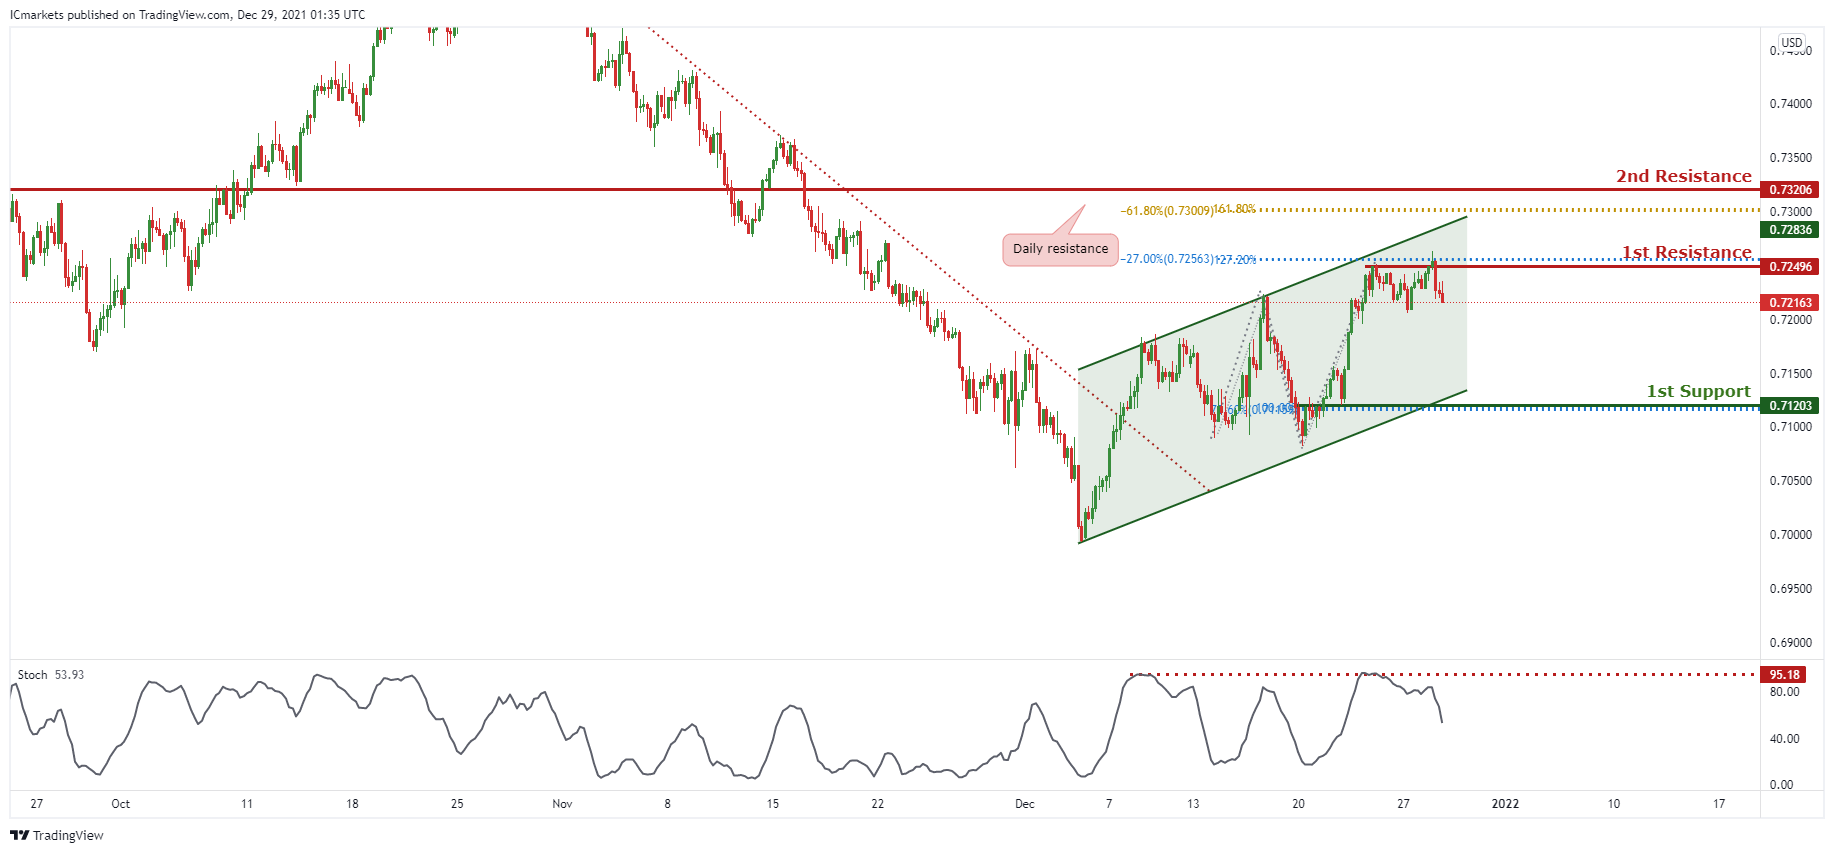
AUD/USD:
On the H4, price is reacting in an ascending channel, signifying bullish momentum. However, price is currently at a resistance, we can expect price to drop from 1st Resistance in line with 127.2% Fibonacci projection and -27.2% Fibonacci Extension towards 1st Support in line with 100% Fibonacci projection and 78.6% Fibonacci retracement. Our short-term bearish bias is further supported by the stochastic indicator where the %K line is at the resistance level.
Areas of consideration:
- H4 1st Support level 0.71203
- H4 1st resistance level 0.72496
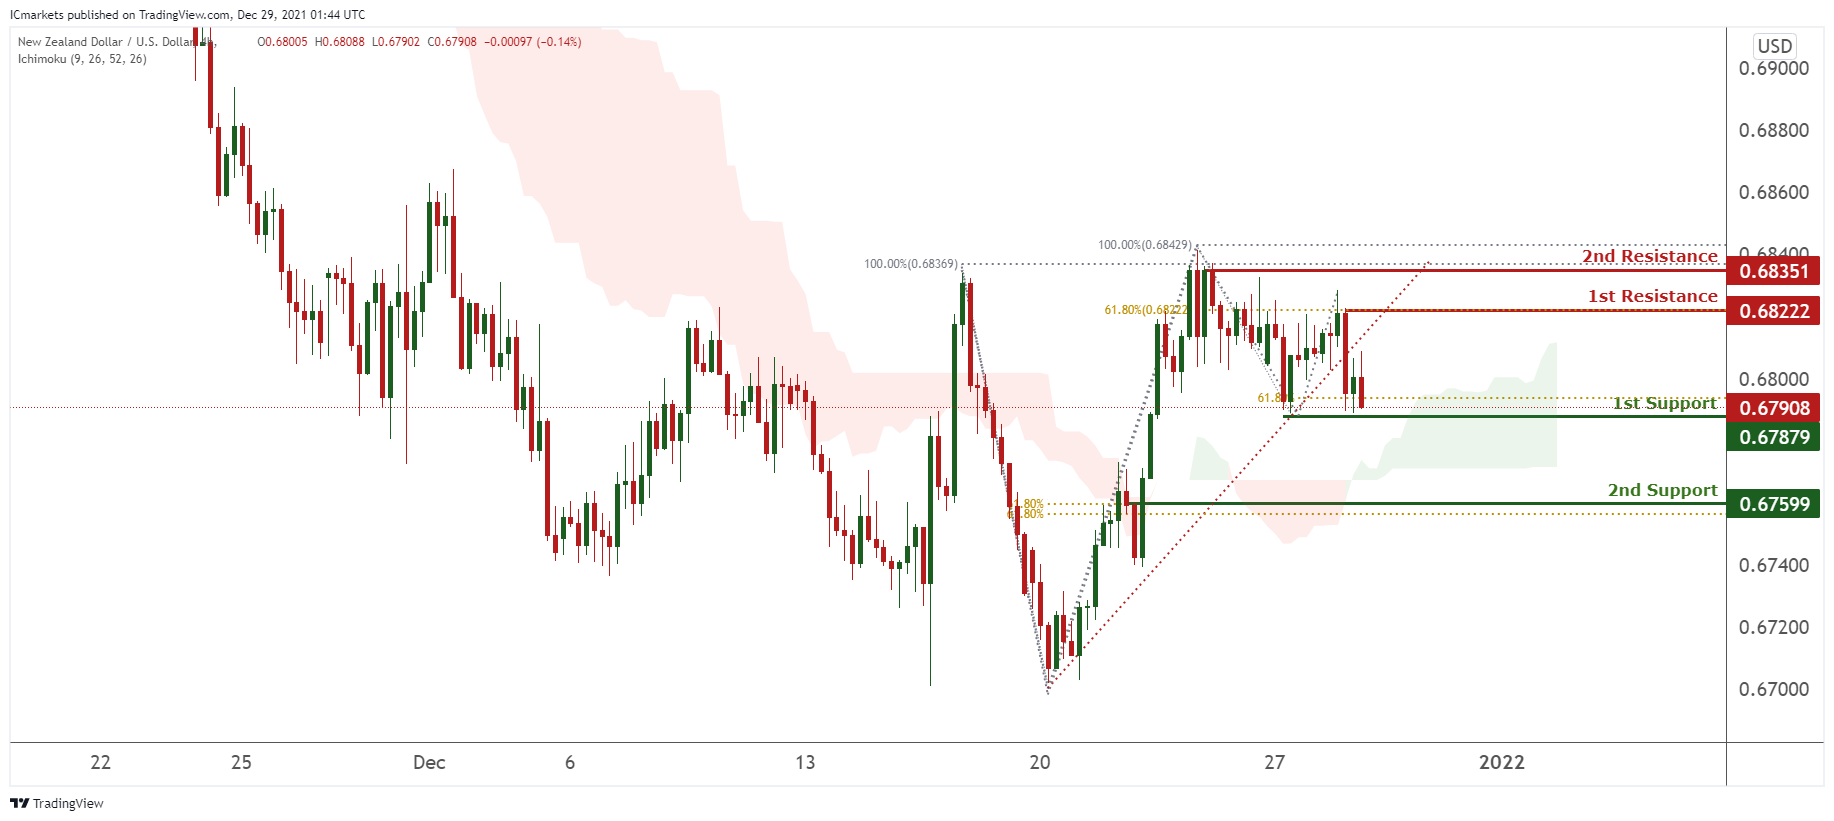
NZD/USD:
On the H4 timeframe, prices have recently broken out of our ascending trendline. We see the potential for a bounce from our 1st support at 0.67879 in line with 61.8% Fibonacci retracement towards our 1st resistance at 0.68222 in line with 61.8% Fibonacci extension. Prices are still trading above ichimoku clouds, further supporting our bias.
Areas of consideration:
- H4 time frame, 1st resistance at 0.68222
- H4 time frame, 1st support at 0.67879
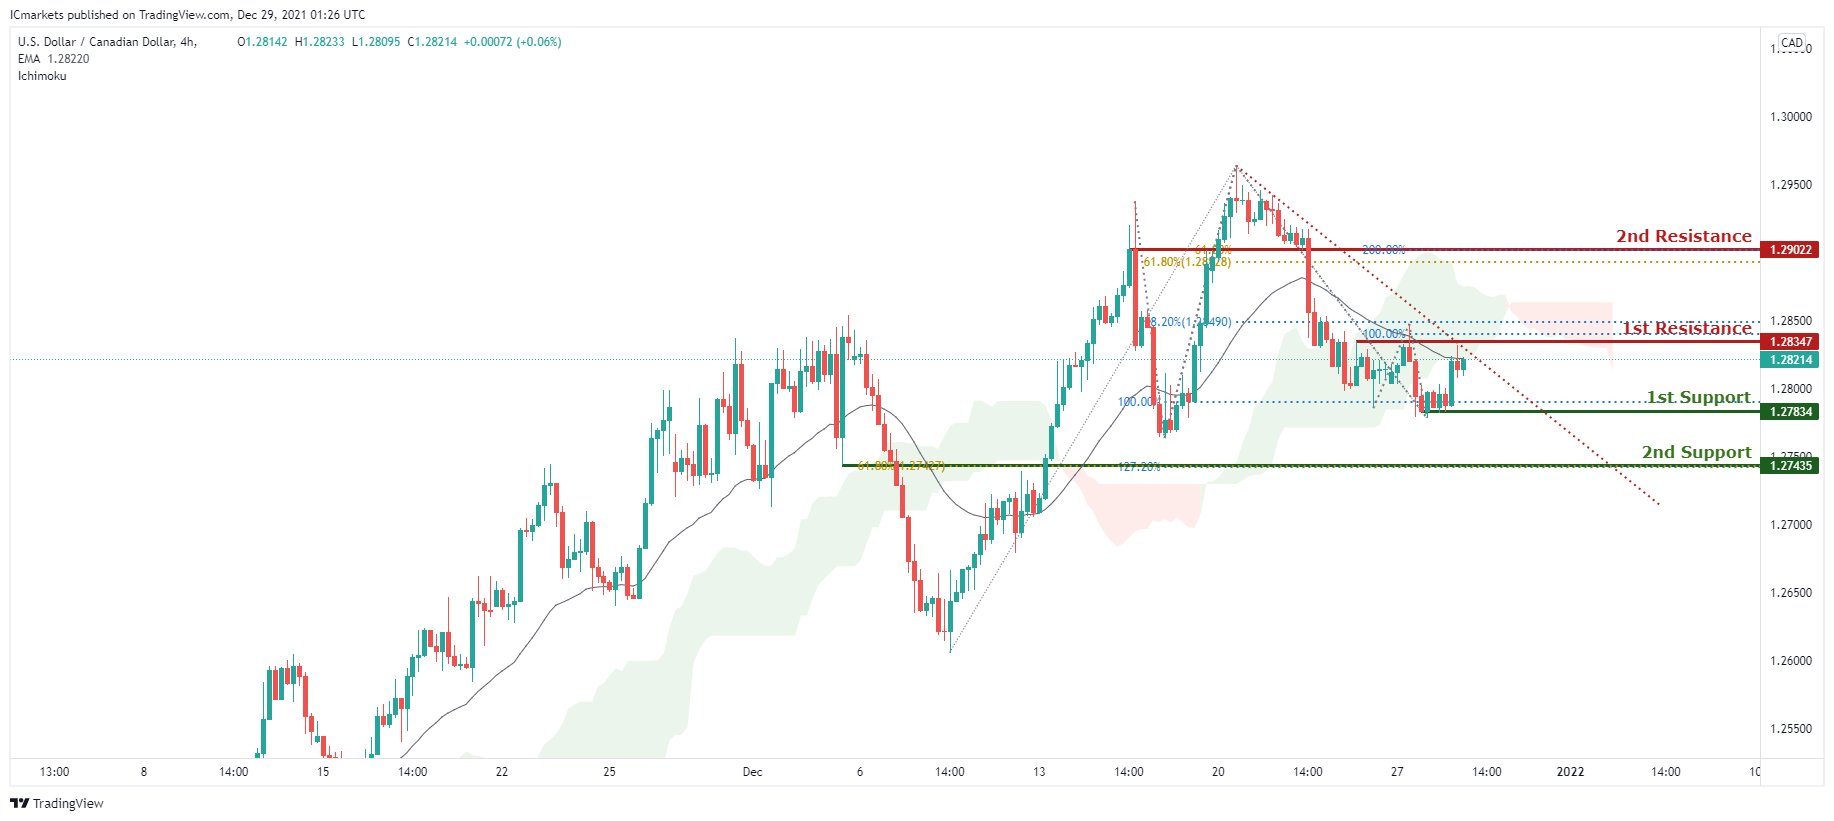
USD/CAD:
On the H4 timeframe, prices are on bearish momentum and abiding to our descending trendline. We see the potential for a dip from our 1st resistance at 1.28347 which is an area of Fibonacci confluences towards our 1st support at 1.27834 in line with 100% Fibonacci retracement. Prices are trading below the ichimoku clouds and also below our EMA, further supporting our bearish bias.
Areas of consideration:
- H4 time frame, support at 1.27834
- H4 time frame, resistance at 1.28347
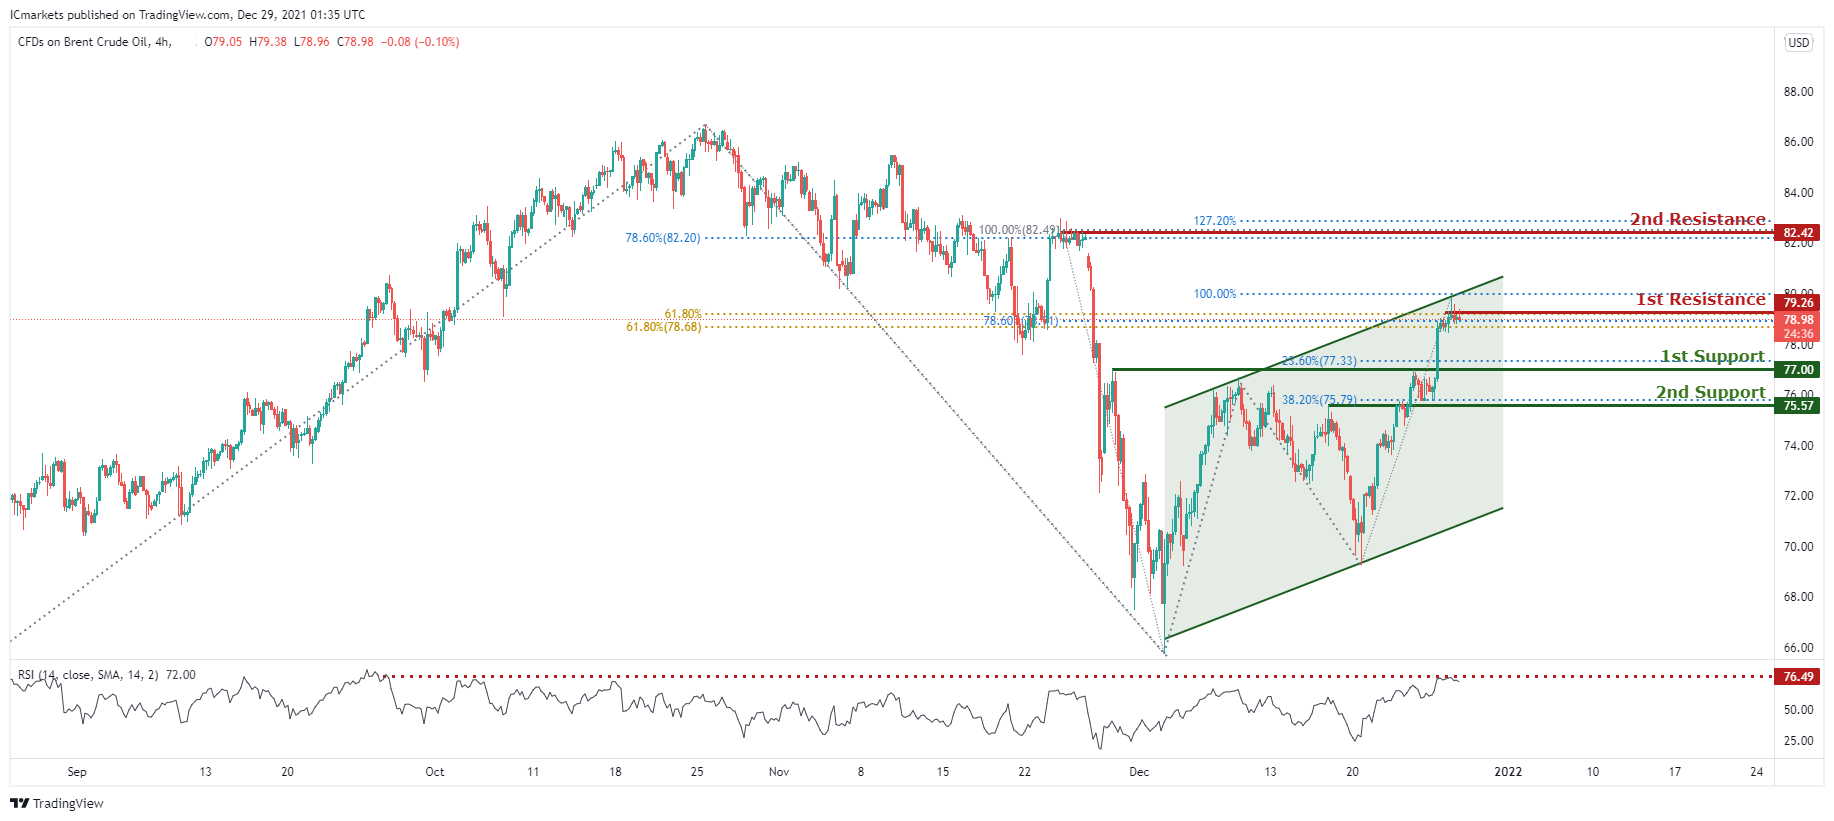
OIL:
On the H4 timeframe, prices were on bullish momentum and consolidating in a bullish channel. With RSI at strong overbought levels, we see the potential for a small pullback from our 1st resistance at 78.98 which is an area of Fibonacci confluences towards our 1st support at 77 in line with 23.6% Fibonacci retracement. Alternatively, breaking our 1st resistance may find prices climbing higher towards our 2nd resistance at 82.42 in line with 100% Fibonacci retracement, 78.6% FIbonacci extension and 127.2% Fibonacci extension.
Areas of consideration:
- H4 time frame, 1st resistance of 26
- H4 time frame, 1st support of 77
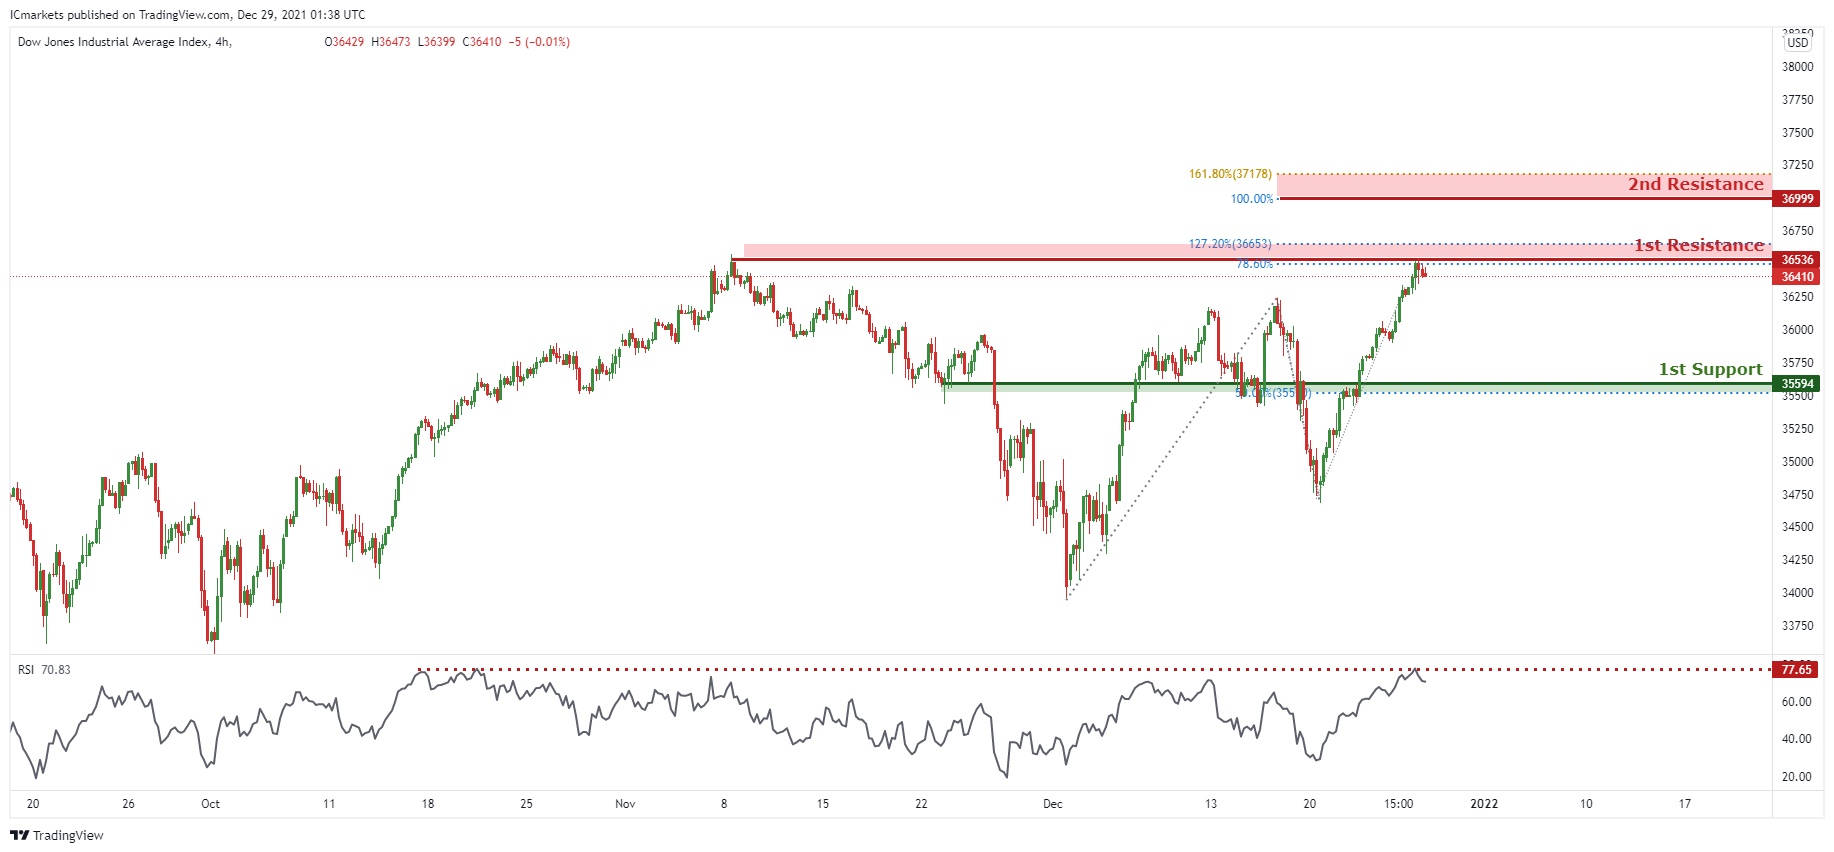
Dow Jones Industrial Average:
On the H4 timeframe,with price approaching the resistance of the stochastics indicator, we have a bearish bias that price will drop to 1st support at 35594 in line with the graphical overlap support and 50% Fibonacci retracement from 1st resistance at 36536 in line with graphical swing high resistance, 78.6% Fibonacci projection and 127.2% Fibonacci extension. Alternatively, we may see price break 1st resistance and head for 2nd resistance at 36999 in line with the horizontal 100% Fibonacci projection and 161.8% Fibonacci extension.
Area of consideration:
- 4H resistance at 36536
- 4H support at 35594
The accuracy, completeness and timeliness of the information contained on this site cannot be guaranteed. IC Markets does not warranty, guarantee or make any representations, or assume any liability regarding financial results based on the use of the information in the site.
News, views, opinions, recommendations and other information obtained from sources outside of www.icmarkets.com.au, used in this site are believed to be reliable, but we cannot guarantee their accuracy or completeness. All such information is subject to change at any time without notice. IC Markets assumes no responsibility for the content of any linked site.
The fact that such links may exist does not indicate approval or endorsement of any material contained on any linked site. IC Markets is not liable for any harm caused by the transmission, through accessing the services or information on this site, of a computer virus, or other computer code or programming device that might be used to access, delete, damage, disable, disrupt or otherwise impede in any manner, the operation of the site or of any user’s software, hardware, data or property.


