Key risk events today:
Australia Inflation (CPI q/q); FOMC Statement, Federal Funds Rate Decision and Press Conference.
(Previous analysis as well as outside sources – italics).
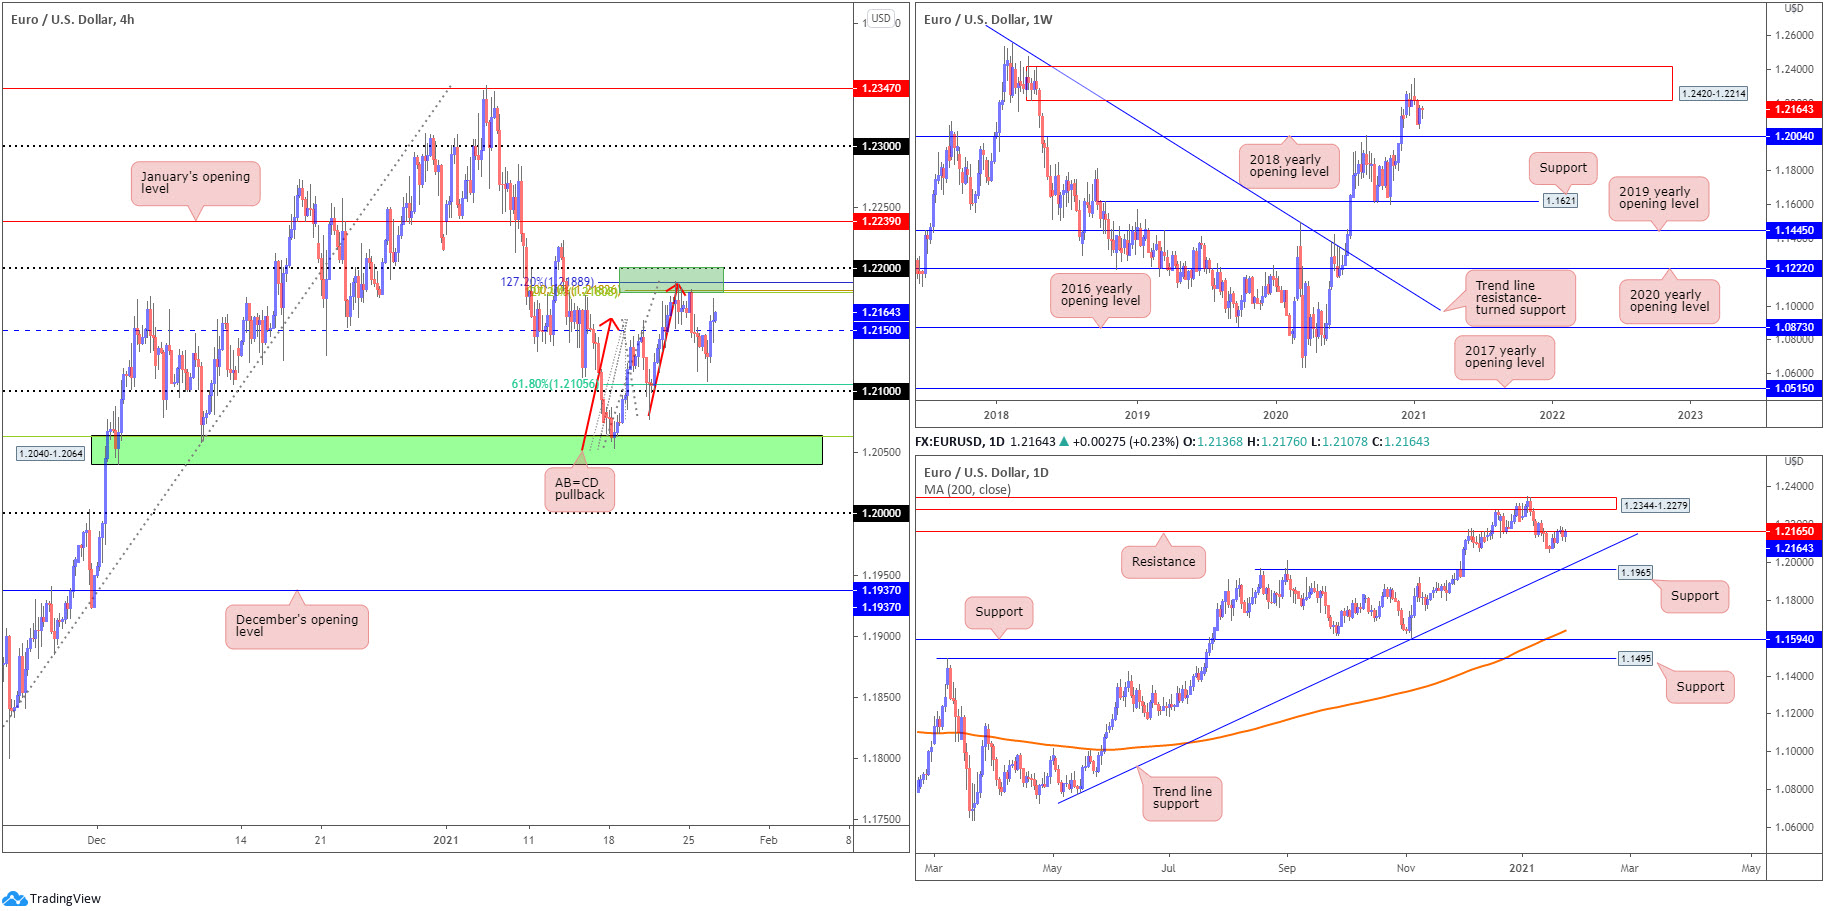
EUR/USD:
H4 resistance at 1.22/1.2180 (composed of the 1.22 figure, a collection of Fibonacci ratios and an AB=CD bearish formation [red arrows]) is back within touching distance. This is thanks to Tuesday’s advance (on the back of a DXY decline), ahead of a 61.8% H4 Fibonacci retracement ratio at 1.2105 (note the 38.2% and 61.8% Fibonacci retracement points [derived from AB=CD structure] are generally viewed as take-profit objectives out of AB=CD patterns—therefore downside targets have been mostly achieved).
In isolation, the 1.22 level is noteworthy resistance on the H4. This is due to the level fixed just south of the lower side of weekly supply at 1.2420-1.2214. Consequently, as noted in Tuesday’s technical briefing, 1.2214-1.22 is an area to be watchful of.
Daily resistance at 1.2165—an active S/R level since June 2010—is a base also in the spotlight. Downside targets on the daily timeframe are seen at trend line support, taken from the low 1.0774, plotted just north of support at 1.1965, a previous Quasimodo resistance level. North of 1.2165, supply drawn from 1.2344-1.2279 (nestled within the walls of weekly supply mentioned above at 1.2420-1.2214) could work its way back in sight.
Areas of consideration:
- H4 resistance at 1.22/1.2180.
- The round number and weekly supply combination at 1.22/1.2214.
- Daily resistance at 1.1265, though this level appears to be hanging by a thread at the moment.
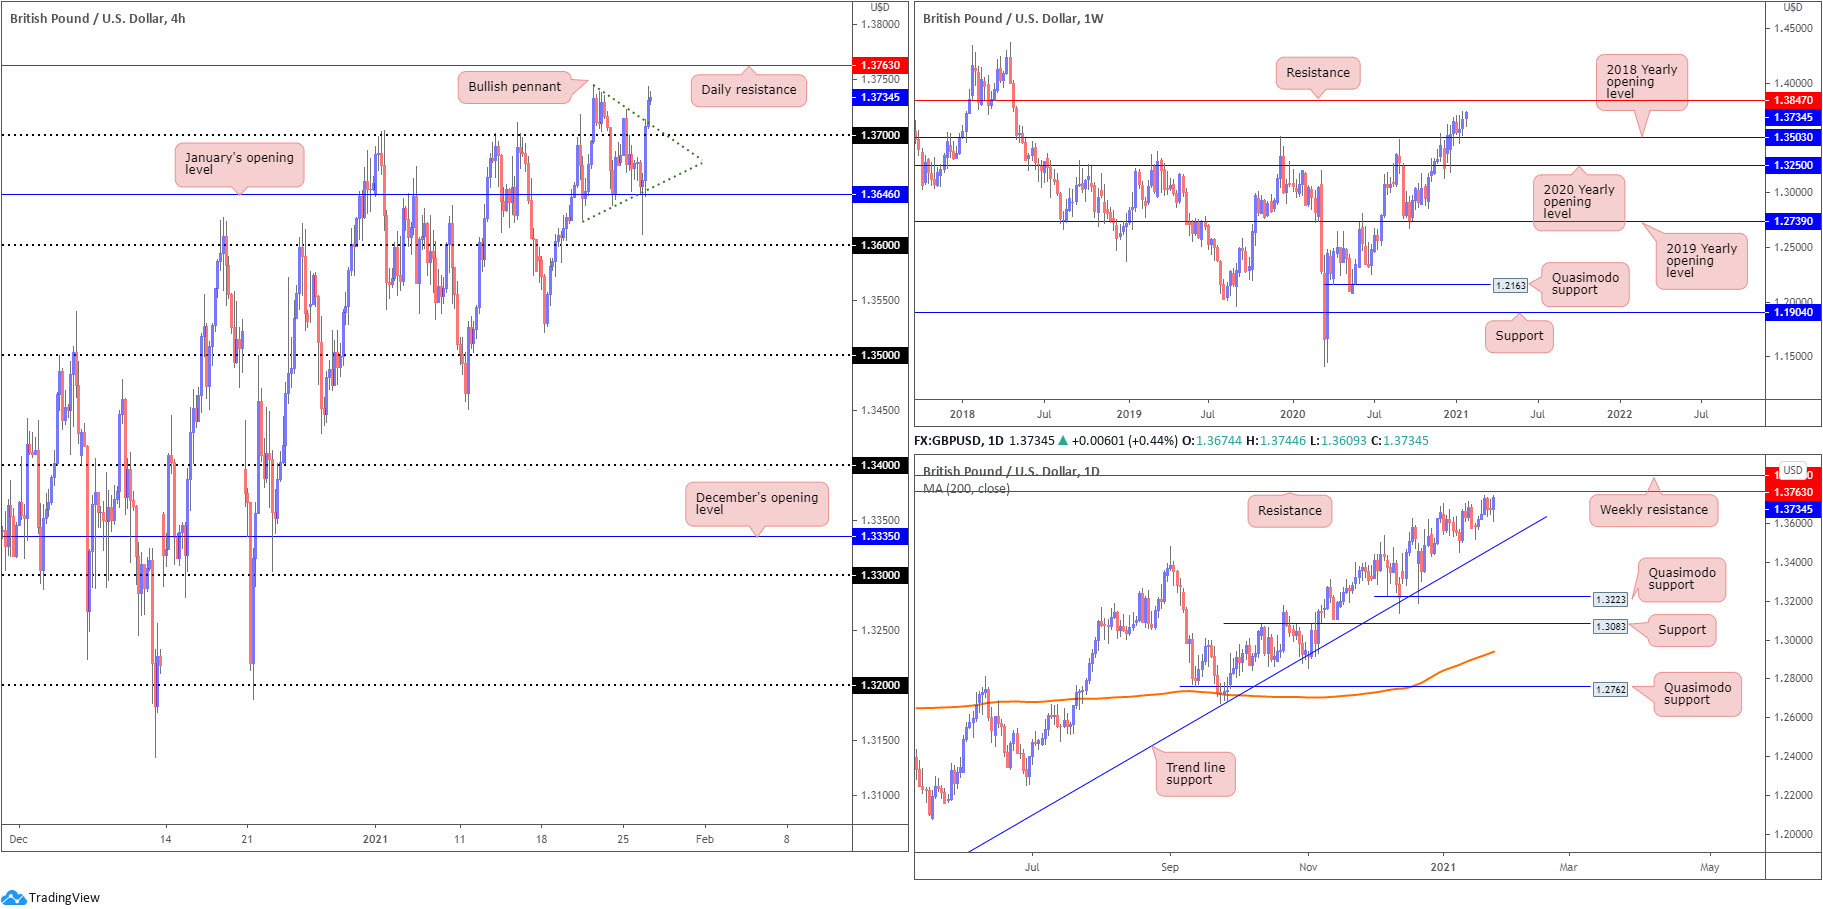
GBP/USD:
Weekly support at 1.3503 holding (2018 yearly opening value) and price recently registering fresh 2021 highs, in a market trending higher, places long-term buyers in a favourable position. With reference to higher timeframe resistance, the daily chart shows price may have trouble at 1.3763, yet a break signals weekly resistance at 1.3847 is likely on the radar.
In conjunction with higher timeframes, H4 traders will acknowledge Tuesday’s breakout above a bullish pennant pattern, established between the 2021 peak at 1.3745 and a low at 1.3623. Additionally, recent momentum higher, amidst a modest risk-on scenario, overthrew the 1.37 figure. As evident from the H4 timeframe, daily resistance at 1.3763 is the next ceiling on tap.
Areas of consideration:
- The combination of a bullish pennant breakout on the H4, alongside the prevailing uptrend and room to reach for at least daily resistance at 1.3763, could see a continuation higher emerge today.
- A retest at 1.37 on the H4 may form to attract fresh buyers.
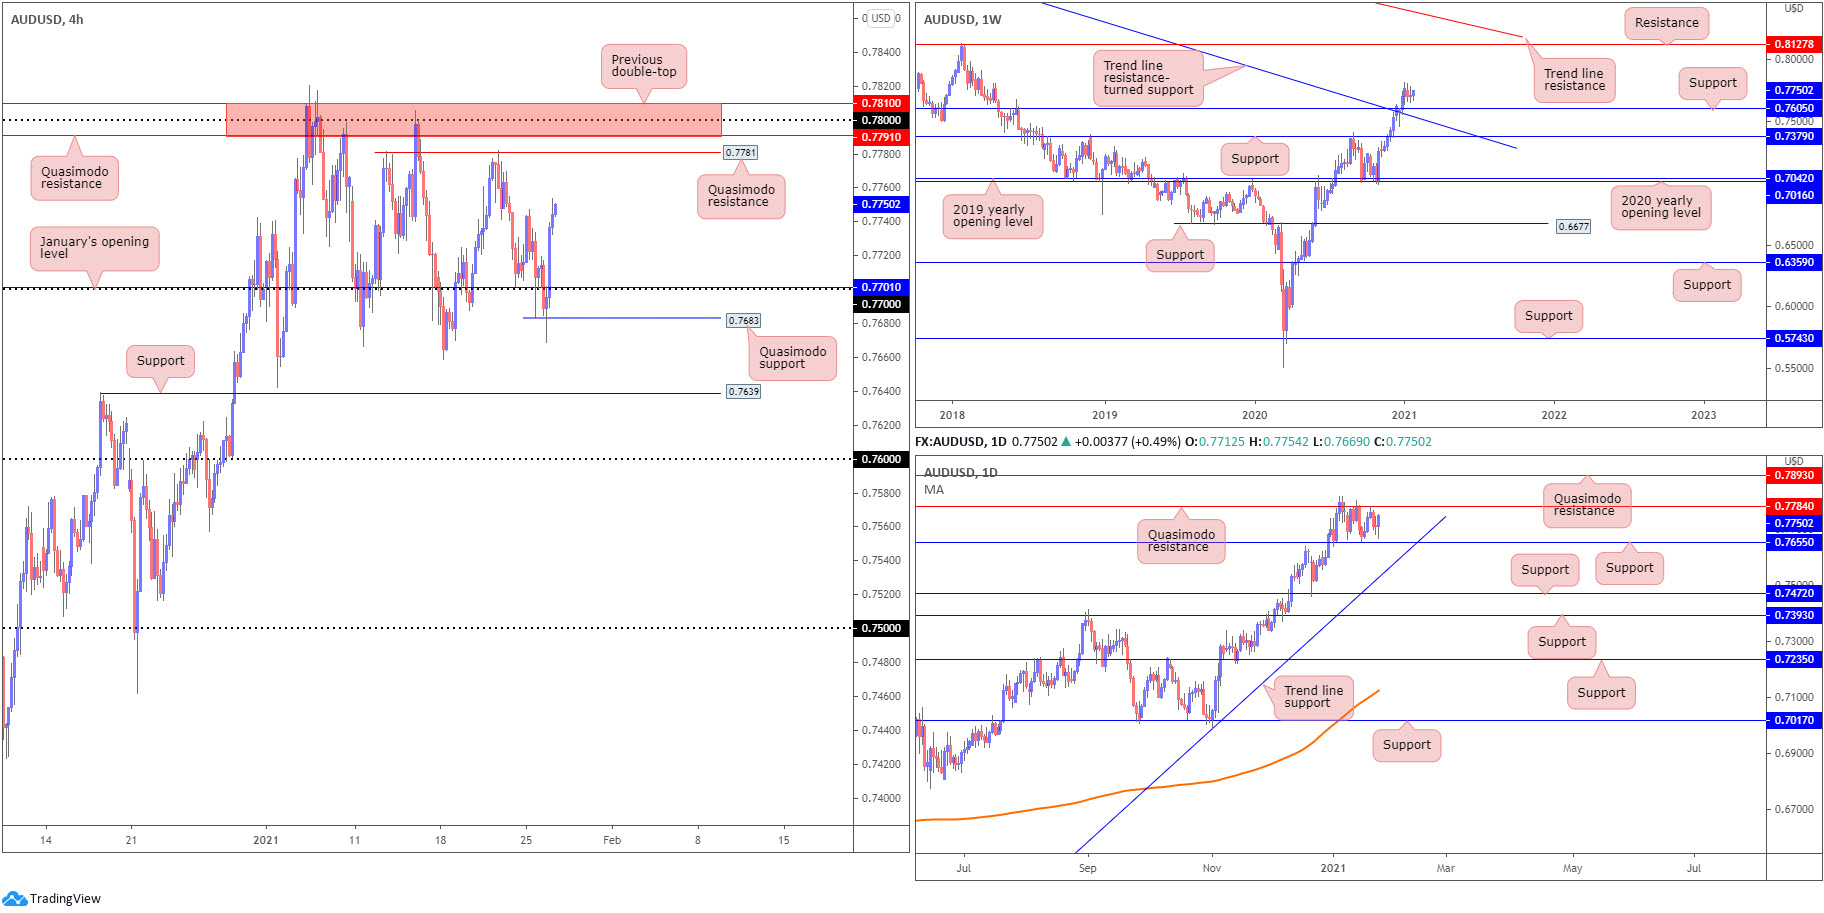
AUD/USD:
The trend has remained firmly higher since early 2020.
Despite price recently consolidating gains, the weekly timeframe shows AUD/USD has scope to reach as far north as resistance at 0.8127. In order to climb, however, daily Quasimodo resistance at 0.7784 must be conquered (shines the spotlight on another daily Quasimodo resistance at 0.7893).
Higher timeframe support levels to consider are weekly support at 0.7605, a previous Quasimodo resistance, and weekly trend line resistance-turned support, taken from the high 1.1080. Daily support at 0.7655 is also a level in the light.
A closer reading of price action on the H4 chart shows that amid renewed USD softness the AUD/USD reclaimed 0.77+ status on Tuesday, and pierced Monday’s peak at 0.7747. Absorbing offers here swings technical interest towards Quasimodo resistance at 0.7781, located near resistance at 0.7810-0.7791 (holds 0.78 figure within).
Areas of consideration:
- H4 resistance at 0.7810-0.7791 and H4 Quasimodo resistance at 0.7781 is a notable zone—even more so knowing it mixes with daily Quasimodo resistance at 0.7784. Nevertheless, with the overall trend higher, sellers could struggle to pencil in downside.
- A H4 breakout above 0.7810 may be interesting, with breakout traders possibly targeting daily Quasimodo resistance at 0.7893 and the 0.79 figure on the H4.
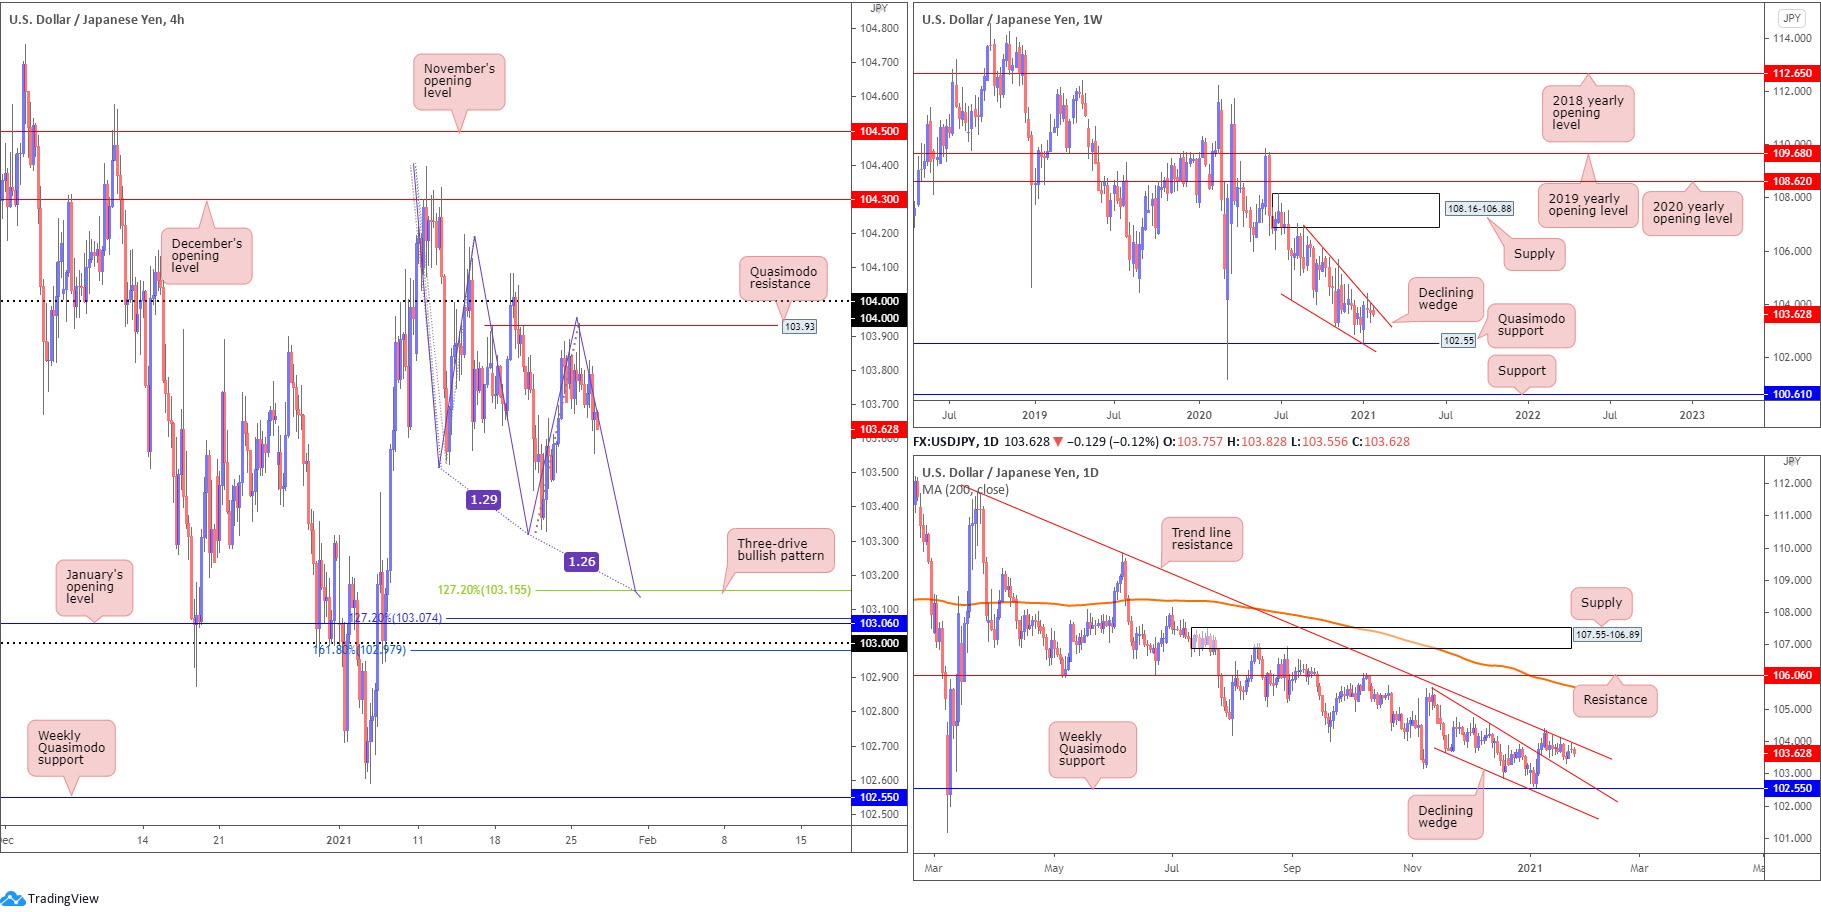
USD/JPY:
The US dollar elbowed lower against the Japanese yen on Tuesday, following Monday’s H4 Quasimodo rejection at 103.93 (sited just south of the 104 figure). Bearish focus has likely shifted towards Thursday’s low at 103.32, with a decisive break exposing a three-drive bullish pattern at 103.15, closely shadowed by the 103 figure.
103 is an interesting location, merging with the upper boundary of the penetrated declining wedge on the daily timeframe (extended from the high 105.67), January’s opening value at 103.06 and nearby Fibonacci studies at 102.97 and 103.07.
Technical vibes on the higher timeframes show price mixing with the upper edge of a weekly declining wedge (106.94/104.18), which fuses with daily trend line resistance, extended from the high 111.71. A breakout beyond these two barriers, therefore, could be meaningful.
Areas of consideration:
- The 104 figure on the H4 timeframe, alongside Quasimodo resistance at 103.93. Traders may acknowledge this area closely merges with the weekly and daily timeframe’s trend line resistances.
- H4 three-drive bullish pattern at 103.15.
- 97-103.07 support zone on the H4 timeframe (composed of a number of technical levels from the H4 and daily timeframes).
USD/CAD:
From the weekly timeframe, three back-to-back long-legged doji candles recently took shape just north of the 2018 yearly opening value at 1.2579, shortly after the retest of resistance at 1.2887 in late December (a previous Quasimodo support level). It is important to note long-term flow (trend) has been pointing lower since topping in March (2020).
On the daily timeframe, the upper edge of the declining wedge (1.2957/1.2688) is in play, forming between weekly support and resistance levels mentioned above. A breakout higher, according to the pattern’s rules of engagement, is considered a reversal signal, given it forming within a downtrend.
Leaving the 1.28 figure unchallenged, Tuesday, aided by a broad USD depreciation, spun off into a phase of selling and reclaimed 1.27 and January’s opening value at 1.2713. Any sustained move below 1.27 today may be viewed as a green light to attack the 1.26 figure, a psychological level plotted just north of weekly support mentioned above at 1.2579 (the 2018 yearly opening value).
Areas of consideration:
- Off the lower edge of the daily declining wedge, a bearish scenario could emerge south of the 1.27 figure on the H4, targeting the 1.26 neighbourhood. Conservative sellers may seek a 1.27 retest before pulling the trigger.
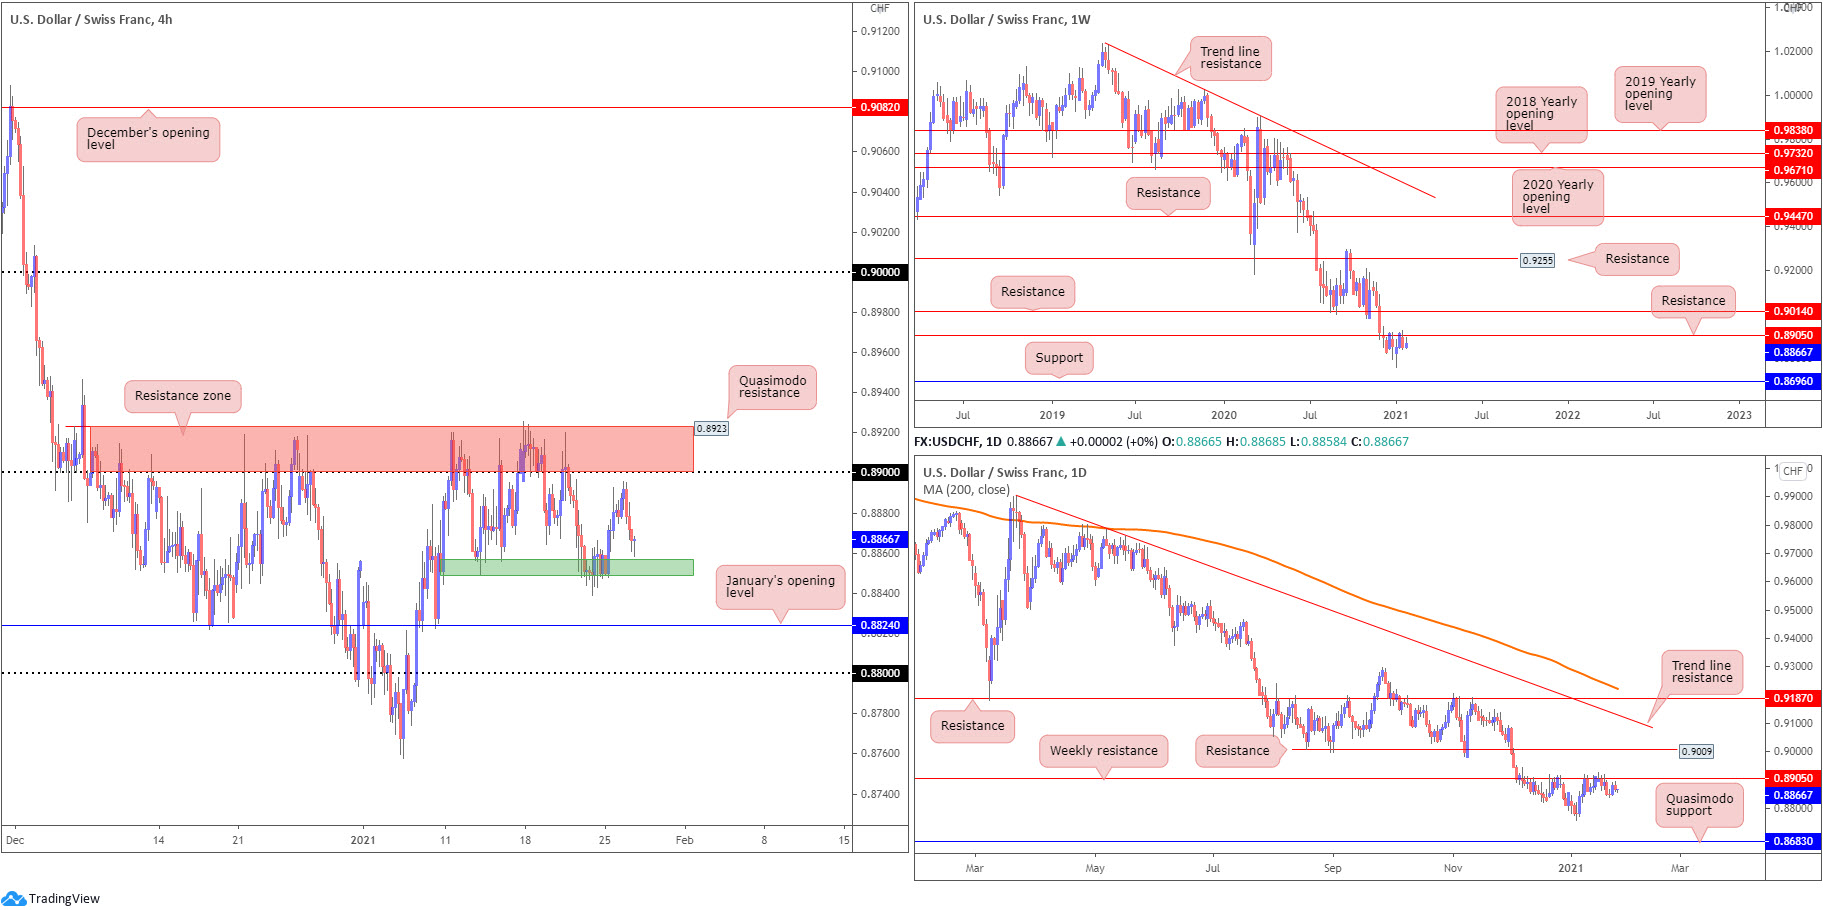
USD/CHF:
H4 resistance at 0.8923-0.89 (Quasimodo resistance and psychological resistance) was left unchallenged on Tuesday, as price rotated lower in lockstep with the US dollar index. The 0.8850 region (green) on the H4 provided support on Monday and, therefore, could do so again if retested today. South of 0.8850, technical eyes will note January’s opening value at 0.8824 and the 0.88 figure.
The technical picture from the weekly timeframe reveals the unit has been trending southbound since May 2019, with price action currently retesting the underside of resistance at 0.8905 (converges with the H4 resistance zone mentioned above at 0.8923-0.89).
Areas of consideration:
- Despite Monday’s relief rally, a clear bearish vibe remains.
- Retesting H4 resistance at 0.8923-0.89 could be a theme traders look for, having noted its connection with weekly resistance.
- Bearish scenarios may form should H4 close south of 0.8850. Although short-term downside targets rest between 0.8824 (January’s opening value) and the 0.88 figure, longer-term targets to be aware of are the multi-month troughs around 0.8757 (formed early January), with further selling to possibly take aim at weekly support drawn from 0.8696 and daily Quasimodo support at 0.8683.
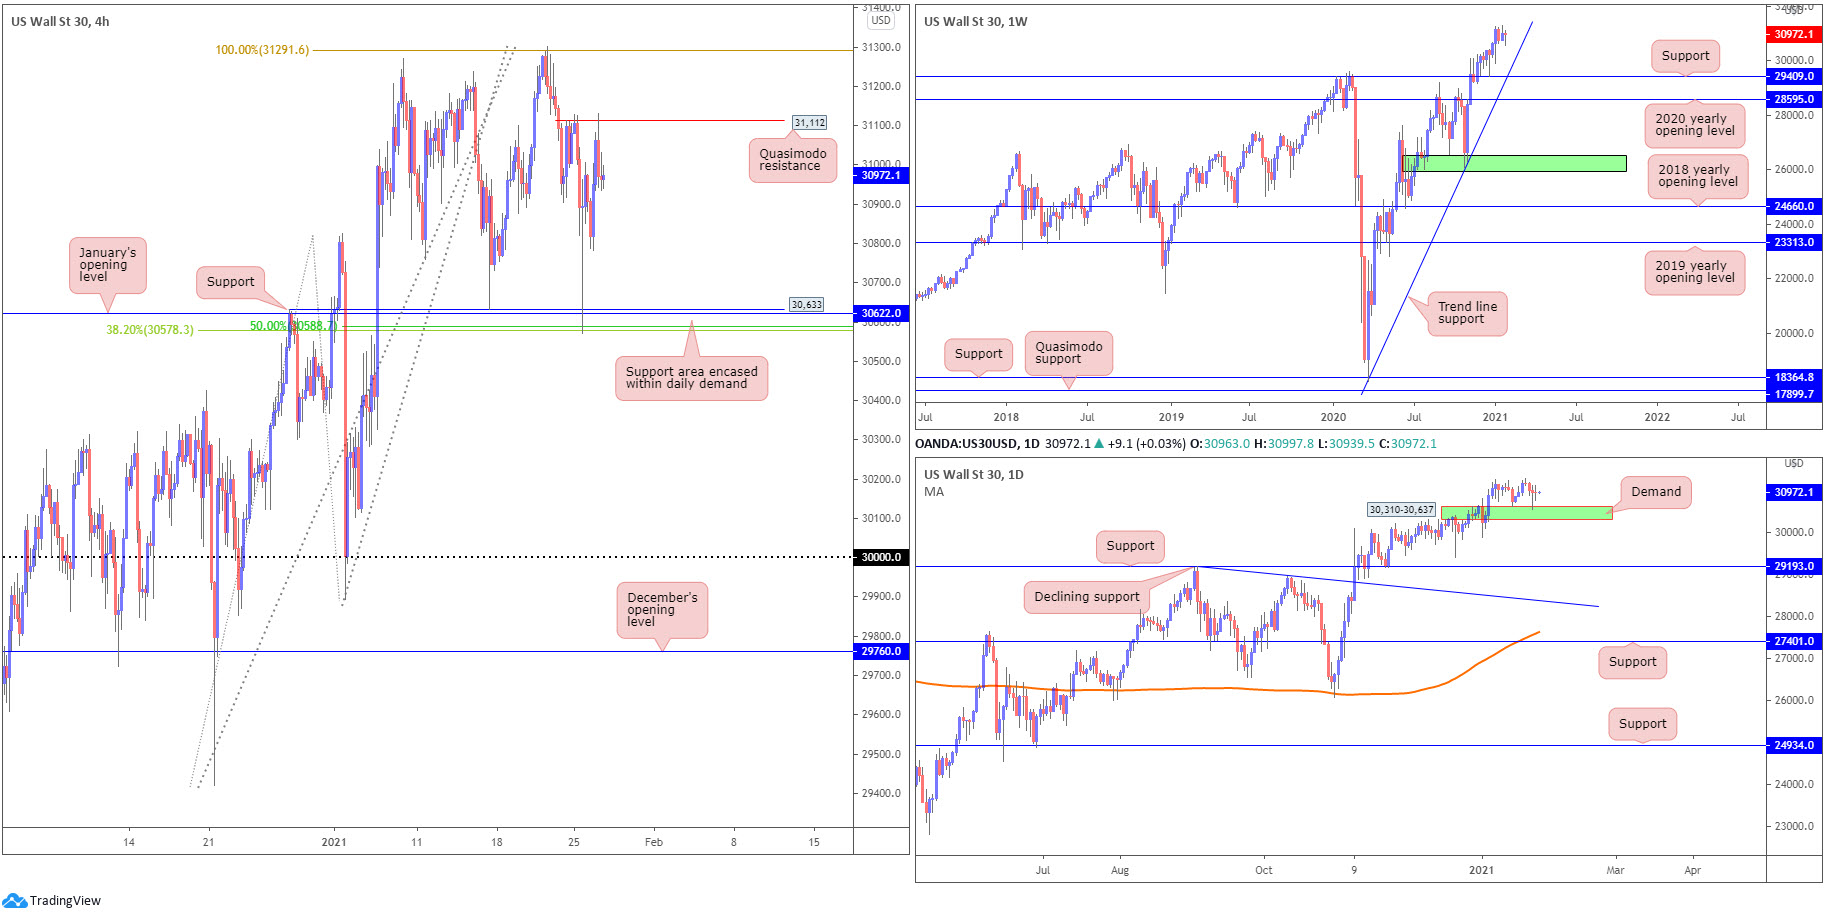
Dow Jones Industrial Average:
US equity benchmarks marginally slipped heading into the close on Tuesday. The Dow Jones Industrial Average fell 22.96 points, or 0.07%; the S&P 500 dropped 5.74 points, or 0.15% and the Nasdaq declined 9.93 points, or 0.07%.
On the technical front, we can see weekly price trades off session troughs, circling nearby all-time peaks at 31,301 forged last week. The weekly timeframe’s trend line support, extended from the low 18,213, is worth noting, though do be aware support at 29,409 could also enter the fight.
In a market trending decisively higher since the beginning of 2020, daily demand at 30,310-30,637 re-entered the frame on Monday and, as you can see, has so far held back sellers.
Note the daily demand encases H4 support between 30,578 and 30,633 (composed of support at 30,633 [a previous Quasimodo resistance level], January’s opening value at 30,622 as well as a 38.2% Fibonacci retracement ratio at 30,578 and a 50.0% retracement ratio at 30,588). Recent buying from the aforementioned supports led the DJIA to H4 Quasimodo resistance at 31,112. A break of this level throws 31,291 in the mix, a 100% Fibonacci extension point.
Areas of consideration:
- Those long from daily demand at 30,310-30,637 or the H4 support zone at 30,578-30,633 (both areas were noted in Monday’s technical briefing) have likely taken additional profits at H4 Quasimodo resistance drawn from 31,112.
- A subsequent H4 breakout above 31,291 could fuel a bullish breakout theme to refresh all-time peaks.
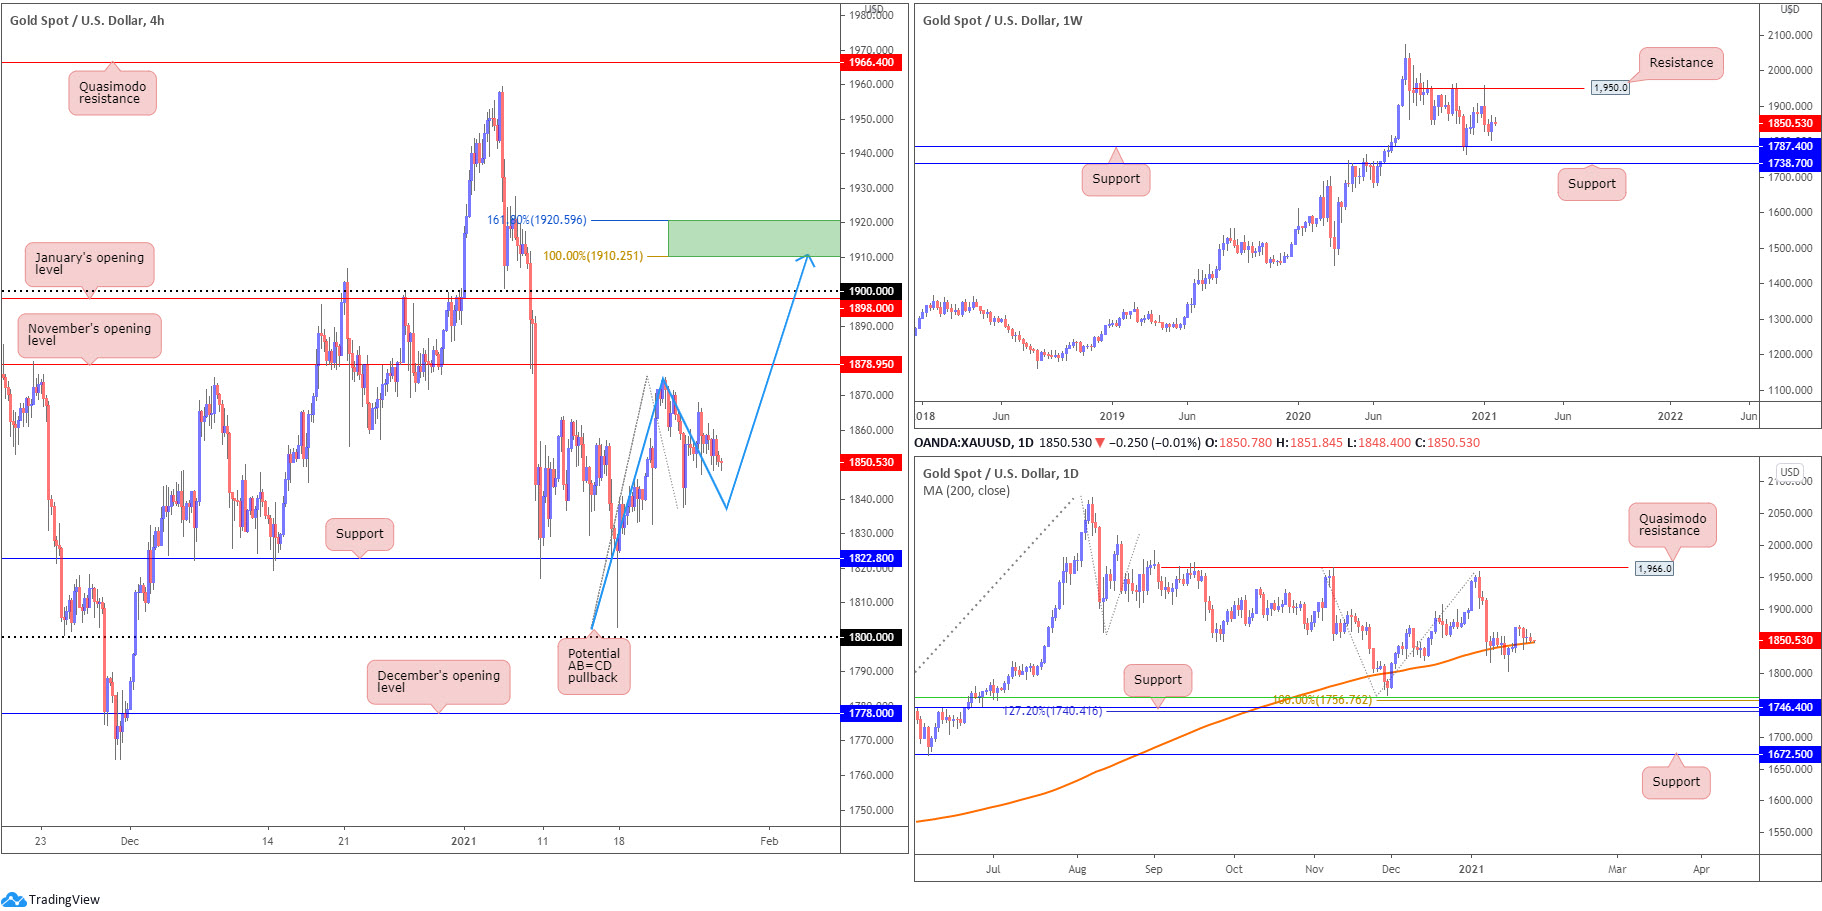
XAU/USD (GOLD):
Overall, the price of gold versus the US dollar concluded another session mostly unmoved on Tuesday.
The weekly timeframe, thanks to last week’s bullish outside reversal candle, shows buyers may still enter the frame, taking aim at resistance drawn from $1,950. Traders may also want to acknowledge support is present at $1,787, set just north of another support at $1,738.
In conjunction with the weekly timeframe’s bullish outside reversal candle, price action on the daily timeframe is seen retesting the upper edge of the 200-day SMA (orange – $1,848). For the time being, though, buyers have lacked enthusiasm, establishing weak candles. Besides the $1,959 high formed in early January, any upside attempts could have buyers zero in on Quasimodo resistance taken from $1,966. Below the noted SMA, support is arranged around $1,746, sited south of a 100% Fibonacci extension point at $1,756, a 50.0% retracement ratio at $1,762 and above a 127.2% Fibonacci extension point at $1,740.
Across the page on the H4 timeframe, based on the higher timeframe’s position, buyers may approach November’s opening value at $1,878, though a dip to support at $1,822 is not out of the question to collect fresh buyers.
The H4 AB=CD pullback (blue arrows) around $1,920 and $1,910 (161.8% Fibonacci projection point/100% Fibonacci extension point) is an area sellers may also continue to watch. Although considered a high-probability pattern, the higher timeframes pointing north may limit selling pressure from the zone.
Areas of consideration:
- The 200-day SMA could attract buyers, in light of the weekly timeframe’s bullish outside reversal configuration.
- H4 support at $1,822 is in view, with November’s opening value at $1,878 seen to the upside.
- H4 AB=CD pullback around $1,920 and $1,910.
The accuracy, completeness and timeliness of the information contained on this site cannot be guaranteed. IC Markets does not warranty, guarantee or make any representations, or assume any liability regarding financial results based on the use of the information in the site.
News, views, opinions, recommendations and other information obtained from sources outside of www.icmarkets.com.au, used in this site are believed to be reliable, but we cannot guarantee their accuracy or completeness. All such information is subject to change at any time without notice. IC Markets assumes no responsibility for the content of any linked site.
The fact that such links may exist does not indicate approval or endorsement of any material contained on any linked site. IC Markets is not liable for any harm caused by the transmission, through accessing the services or information on this site, of a computer virus, or other computer code or programming device that might be used to access, delete, damage, disable, disrupt or otherwise impede in any manner, the operation of the site or of any user’s software, hardware, data or property.


