
Key risk events today:
FOMC Members Evans and George Speak; Crude Oil Inventories.
EUR/USD:
EUR/USD bulls went on the offensive Tuesday, consequently snapping a two-day losing streak and adding more than 25 points, or 0.24%. Sentiment among German executives improved slightly, according to the Institute for Economic Research. The IFO business climate index rose in September from 94.3 to 94.6 points due to a better assessment of the current situation. According to The Conference Board, consumer confidence data out of the US decreased in September, following a slight decline in August. The Index now stands at 125.1, down from 134.2 in August.
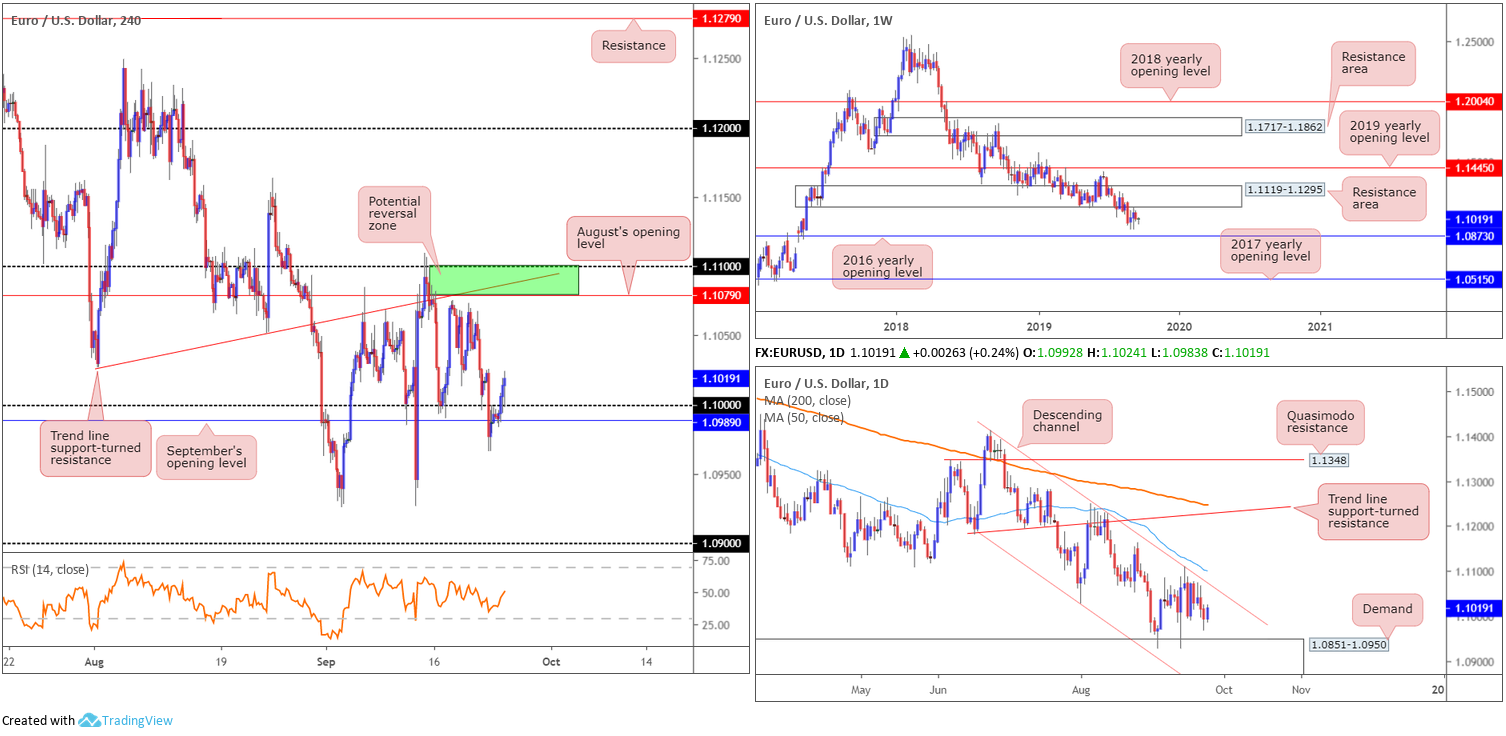
Recent buying reclaimed 1.10+ status, and (seen clearer on the H1 timeframe) retested the figure as support. Further upside on the H4 timeframe may call for a whipsaw through tops at 1.1074ish and approach to a green resistance zone formed between the 1.11 handle, trend line support-turned resistance (taken from the low 1.1026) and August’s opening level at 1.1079.
The story on the bigger picture has weekly flow languishing south of long-standing demand-turned resistance area at 1.1119-1.1295. A retest of this area may still be on the cards, though a run to the 2016 yearly opening level at 1.0873, given the trend pointing in a southerly bearing since 2018, is also a possibility. Closer analysis on the daily timeframe reveals price action has been compressing within a descending channel formation since late June, with the candles poised to potentially retest the channel resistance (etched from the high 1.1412), shadowed closely by the 50-day SMA (blue – currently stands at 1.1099).
Areas of consideration:
The recent H4 candle retest at 1.10 is interesting and could spark additional buying, targeting the H4 resistance area at 1.0000/1.1079. Entry at current price is an option, with a protective stop-loss order positioned beneath the retesting candle’s lower shadow at 1.0998.
Should the unit reach 1.0000/1.1079 (this involves a breach of a daily channel resistance, highlighted above), not only is this considered a take-profit zone for any longs off 1.10, it’s likely viewed as a sell zone, too. The surrounding H4 confluence (see above), along with the 50-day SMA on the daily timeframe, certainly has appeal. For those looking to press this bearish theme, the research team recommends waiting for additional H4 candlestick structure to form before pulling the trigger (entry/risk can be determined according to this pattern). This is largely due to the threat of a stop run materialising through 1.11 to the underside of the weekly resistance area mentioned above at 1.1119-1.1295.
GBP/USD:
Leaving 1.24 unopposed on the H4 timeframe, the GBP/USD turned higher Tuesday and reclaimed Monday’s lost ground to challenge the underside of 1.25. Aiding the advance came via the UK Supreme Court ruling PM Johnson’s prorogation of Parliament was unlawful. House of Commons Speaker Bercow subsequently announced he would recall Parliament on Wednesday at 11:30 BST.
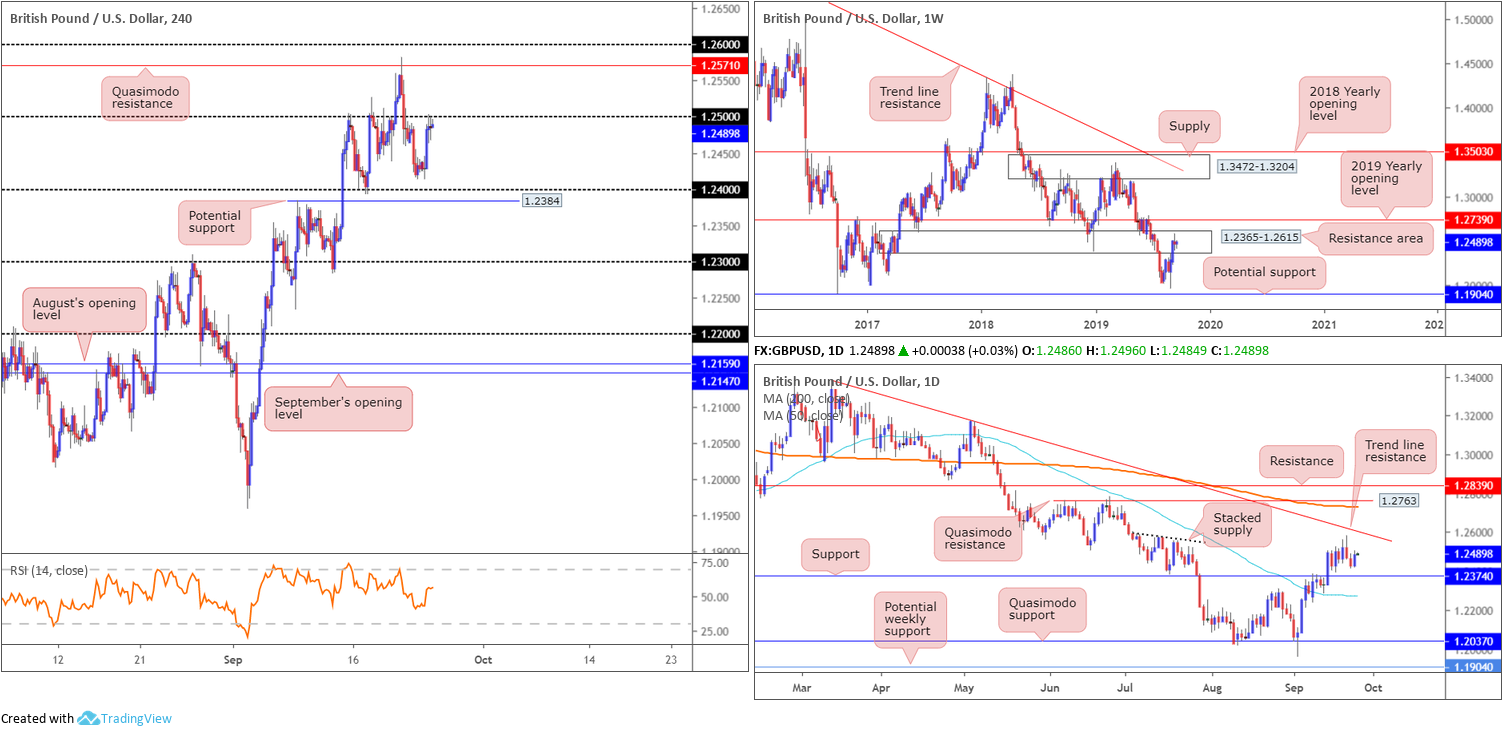
Should H4 action overthrow 1.25, the next port of call in terms of resistance, falls in at a Quasimodo formation drawn from 1.2571, followed closely by 1.26.
Technically, weekly activity remains within the parapets of a resistance area coming in at 1.2365-1.2615, though is having a difficult time chalking up anything meaningful to the downside. Support from this angle is not expected until reaching the 1.1904 neighbourhood – held price strongly higher in October 2016, while a move above the area has the 2019 yearly opening level at 1.2739 in sight. A closer reading of price action on the daily timeframe has the candles turning higher north of support at 1.2374, perhaps eyeballing trend line resistance coming in from the high 1.3380.
Areas of consideration:
With weekly price confined within a resistance area and daily flow indicating a potential run north to trend line resistance, conflicting signals make this market a difficult read.
Should we climb north of 1.25 today, this may be taken as a bullish indicator on the H4 timeframe, targeting Quasimodo resistance at 1.2571. A retest of 1.25 followed up with a H4 bullish candlestick signal (entry and risk can be determined according to this formation) may be enough to motivate buyers to long within the weekly resistance zone, though strict trade management is recommended.
AUD/USD:
In recent sessions, the Australian dollar gathered traction versus its US counterpart, aided on the back of remarks from RBA Governor Lowe.
Lowe reiterated further monetary easing may be required, though still thinks it unlikely. Lowe also cited recent evidence which has shown the economy can sustain lower rates of unemployment and underemployment than previously thought likely. He also noted the economy has reached a gentle turning point.
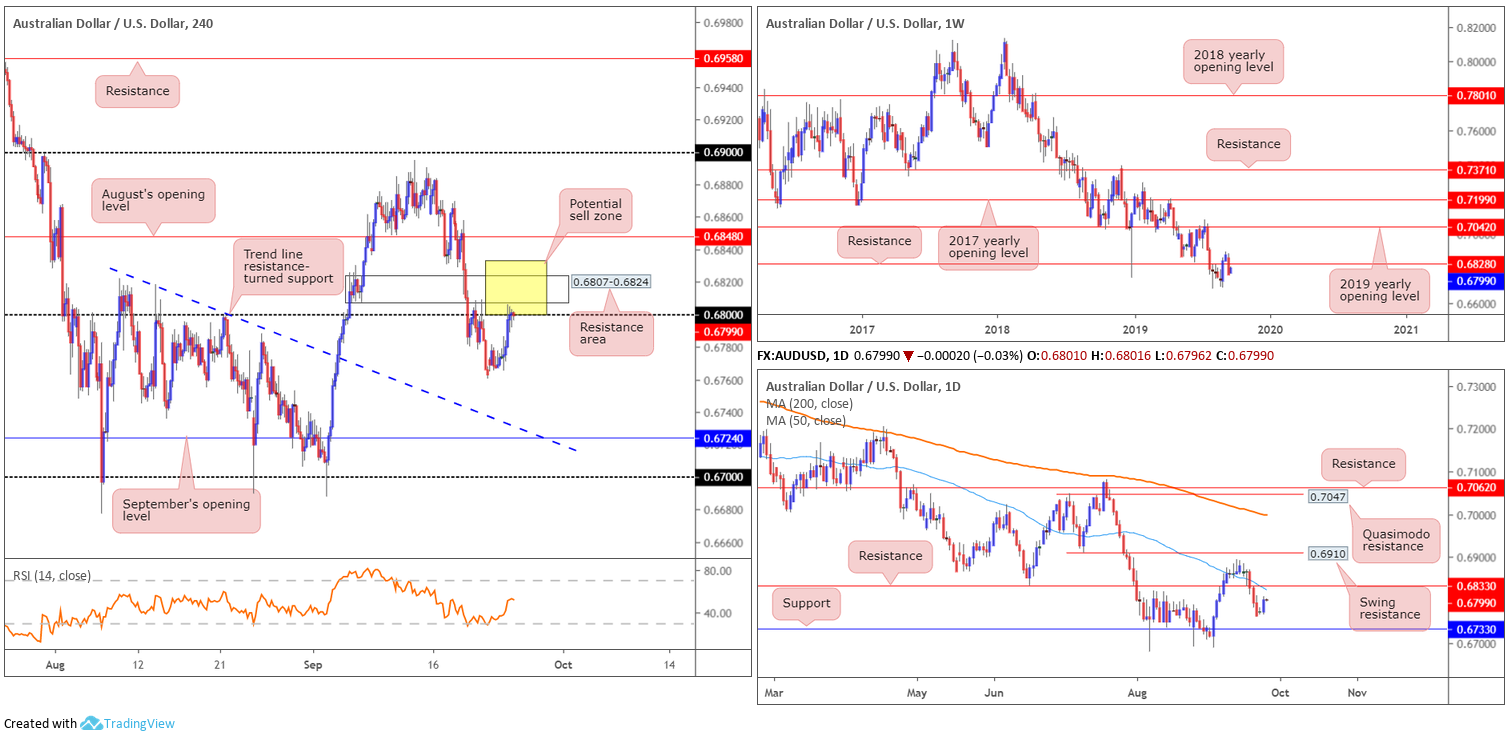
Lowe’s remarks prompted a run higher in AUD/USD prices, whipsawing through 0.68 on the H4 timeframe, though missed the nearby resistance area at 0.6807-0.6824. Beyond this zone, we have weekly resistance nearby at 0.6828, then daily resistance plotted at 0.6833 and the 50-day SMA (blue at 0.6824), followed by August’s opening level at 0.6848 on the H4. As you can see, several layers of resistance reside close by.
To the downside, weekly price has 0.6677 in sight, the YTD low. Support carved from 0.6733 is seen on the daily timeframe, while support targets on the H4 timeframe, aside from Friday’s low at 0.6760, has trend line resistance-turned support (drawn from the high 0.6818) and September’s opening level at 0.6724 in the firing range.
Areas of consideration:
With a range spanning between daily resistance at 0.6833 and the 0.68 handle on the H4, this area is comprised of a reasonably formidable combination of resistances. Therefore, the yellow H4 zone, labelled ‘potential sell zone’, is an area sellers are expected to enter the mix. Watching for a H4 bearish candlestick signal to form is a potential entry trigger, though traders are urged to follow their trading plan in terms of confirmation entry techniques.
USD/JPY:
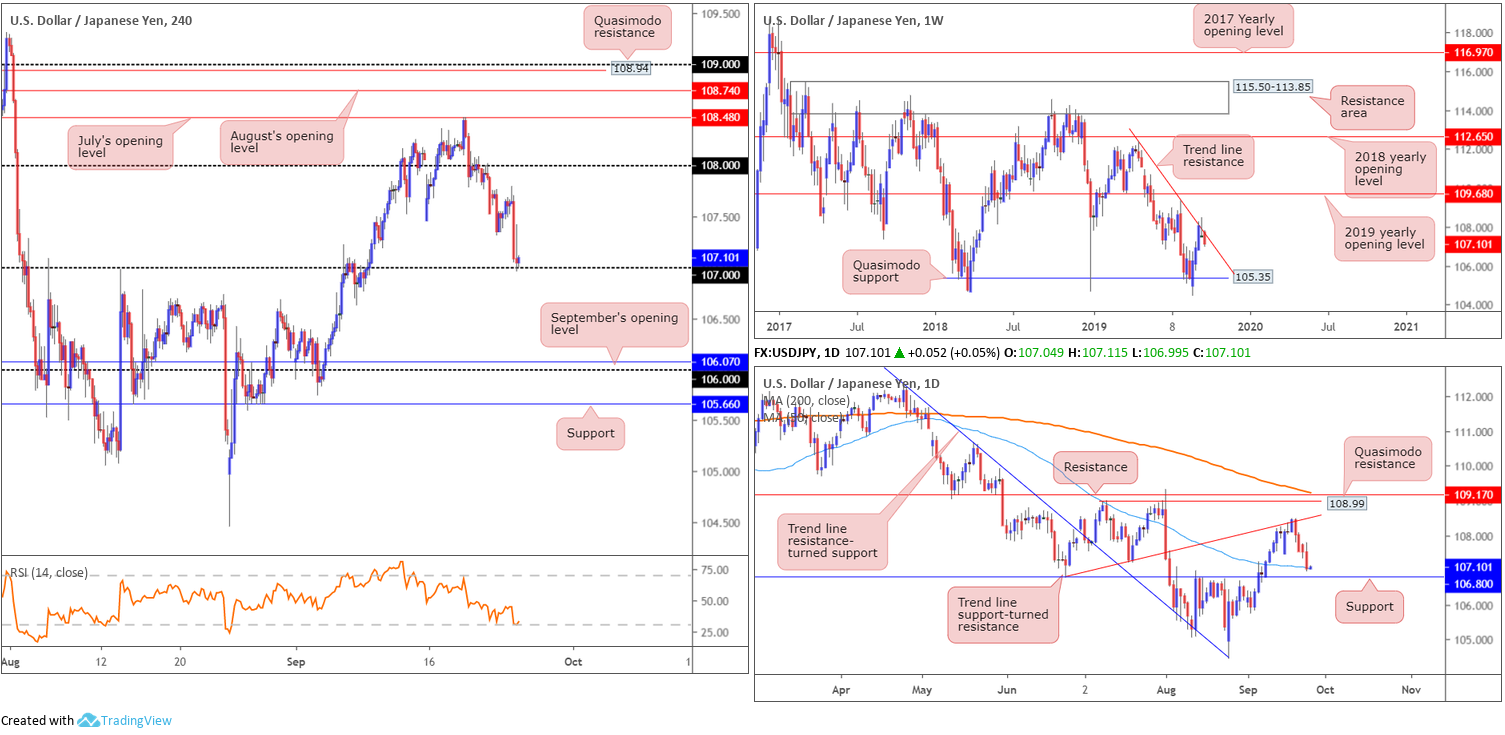
Broad-based USD selling, influenced by less-than-stellar consumer confidence data – stands at 125.1, down from 134.2 in August – weighed on the USD/JPY Tuesday. The pair settled a touch north off 107, which, by and of itself, is appealing support, having seen how well the figure served as resistance in the past.
In addition to 107, technical research on the daily timeframe reveals the 50-day SMA is now in motion (blue – 107.04), trailed closely by a well-placed support level at 106.80. Contrary to this, however, weekly price is seen rejecting trend line resistance extended from the high 112.40.
Areas of consideration:
Entering long based off 107 is likely appealing to many traders this morning, particularly as we’re also coming off the 50-day SMA on the daily timeframe along with additional support at 106.80. Waiting for additional forms of confirmation is recommended, nonetheless, due to weekly price threatening lower prices from its trend line resistance. The first upside target resides around the 107.50 threshold.
USD/CAD:
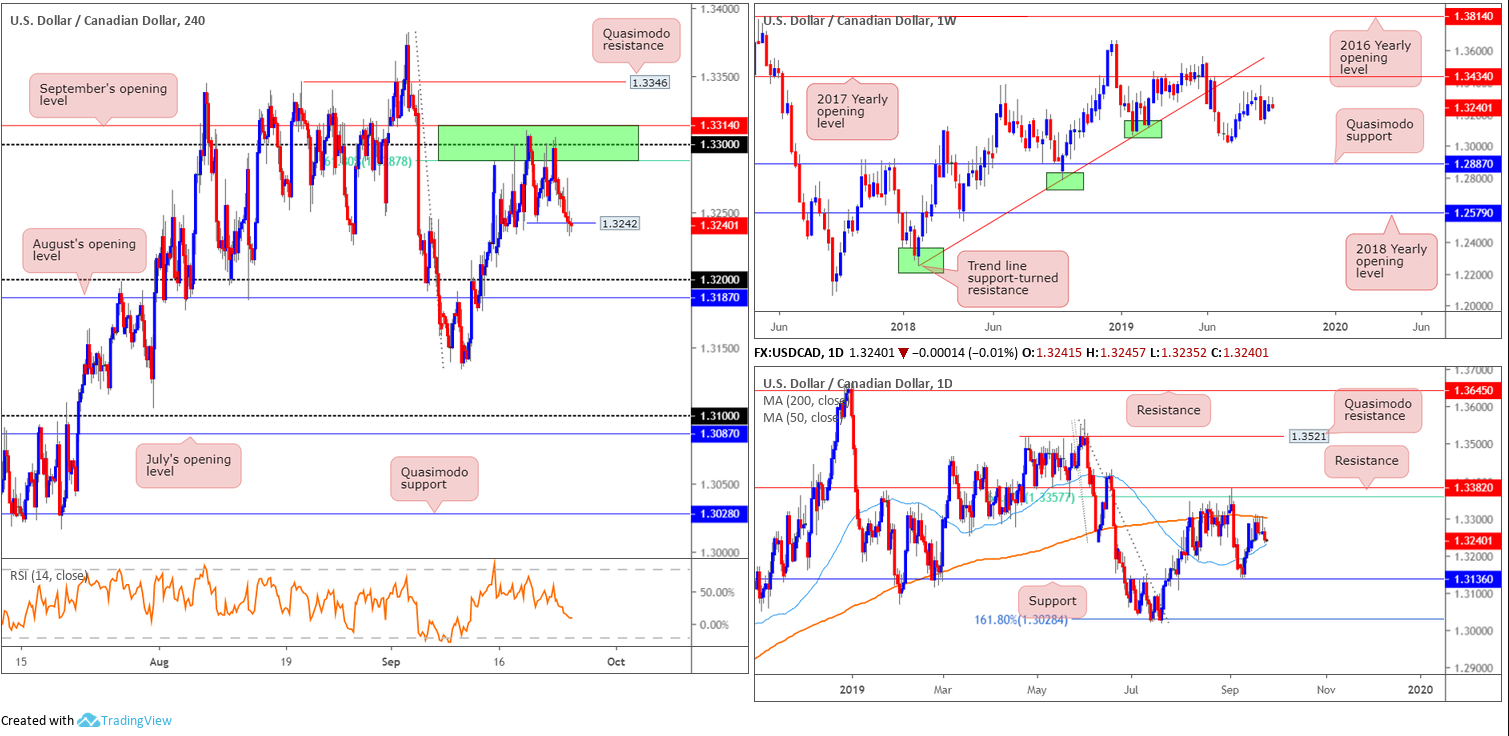
Down 0.16% on the week, the USD/CAD extended Monday’s rejection off the underside of 1.33 on Tuesday, likely weighed on by broad-based dollar selling – the US dollar index concluded down 0.28%. WTI prices declined nearly 3.00%, breaking sub $57.00/bbl.
As evident from the H4 timeframe, the unit marginally engulfed local support at 1.3242. Although the research team is eyeing more of a decisive close beneath the level, this does help confirm a somewhat bearish theme out of a familiar sell zone (green) between September’s opening level at 1.3314, the round number 1.33 and the 61.8% Fibonacci ratio at 1.3287 (1.3314/1.3287), supported further by the 200-day SMA highlighted on the daily timeframe in orange.
A decisive push beneath 1.3242 likely clears the path south towards 1.32, closely followed by August’s opening level at 1.3187. However, the only drawback, from a technical standpoint, comes via the 50-day SMA (blue – 1.3231) meandering close by. Beyond this MA, nonetheless, we have room on the daily scale to press as far south as support coming in at 1.3136.
Areas of consideration:
Outlook remains unchanged; the only difference is the additional H4 close required beneath the 50-day SMA.
To confirm healthy intent from the current H4 resistance area between 1.3314/1.3287, the research team now requires a H4 close beneath 1.3242 and the noted 50-day SMA. A break of these areas likely clears the runway to at least 1.32 and August’s opening level at 1.3187, possibly followed by a move to daily support at 1.3136.
A potential entry, albeit considered somewhat conservative, is wait and see if the H4 candles retest 1.3242ish following the break lower. A retest of this level, preferably formed by a H4 or H1 bearish candlestick pattern (entry/risk can be defined according to this structure), is likely sufficient to entice sellers to at least 1.32ish. Traders are urged to consider risk/reward ratio, targeting at least a 1:1 fix to the initial downside target, before pulling the trigger.
USD/CHF:
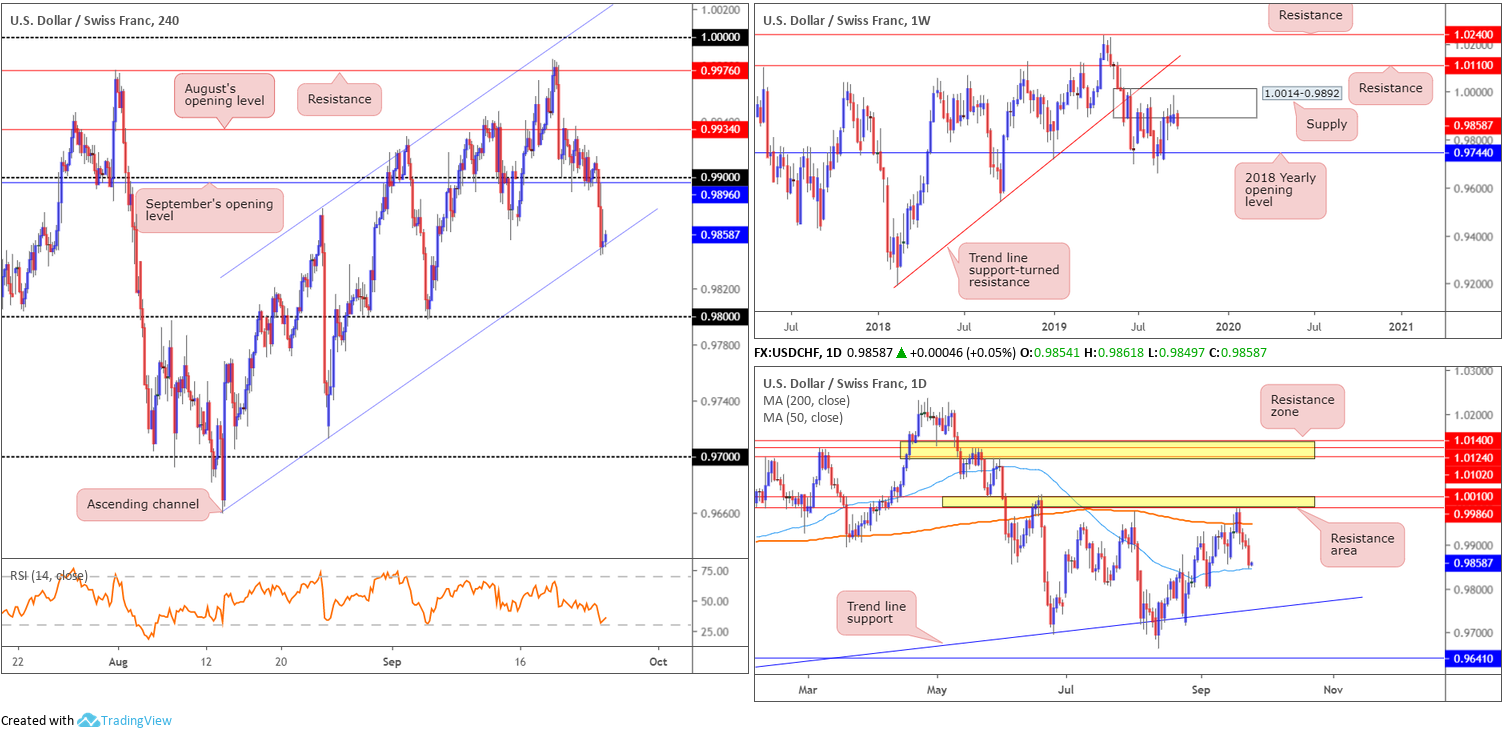
Following a break of 0.99 to the downside on the H4 timeframe, the USD/CHF extended its three-day pullback from three-month tops from 0.9983 Tuesday, erasing more than 40 points. Weaker US consumer confidence Index as well as technical selling, both from sell stops taken from longs and breakout sellers’ orders sub 0.99, contributed to recent downside.
Traders who read Tuesday’s technical research may recall the following pieces:
Weekly price remains unchanged in terms of technical structure. Longer-term flow has action engaging with familiar supply coming in at 1.0014-0.9892, consequently producing a shooting star formation last week (considered a bearish signal). This is the second time back to the area; therefore, its strength may be compromised. A rotation lower from here, nevertheless, has the 2018 yearly opening level at 0.9744 in view.
A closer reading of price action on the daily timeframe has the pair airing a reasonably strong bearish vibe just south of a daily resistance area at 1.0010/0.9986. The market also recently saw price engulf the 200-day SMA (orange – 0.9744). The research team notes limited active demand until reaching the 50-day SMA (blue – 0.9844), with an engulf of this line possibly unbolting the door to trend line support etched from the low 0.9542.
With both weekly and daily timeframes emphasising a bearish tone, focus shifts to possible shorting opportunities on the H4 timeframe. To confirm a bearish theme, look for a decisive H4 close beneath 0.9896. This – coupled with a (bearish candlestick) retest at 0.99ish – highlights selling opportunities to at least the 50-day SMA on the daily timeframe, followed by a possible run to 0.98. Entry and protective stop-loss orders can be set based on the rejection candlestick’s framework.
H4 action did in fact break through 0.9896 yesterday, though fell short of retesting the level by less than a pip before taking off south (this is seen clearer on the M30 timeframe). The pair wrapped up the session testing H4 channel support (extended from the low 0.9859) and the 50-day SMA mentioned above on the daily timeframe at 0.9844.
Areas of consideration:
Although buyers appear to be making an appearance off the current H4 channel support, longs based off this angle may struggle to reach 0.99. This is, despite daily price also testing its 50-day SMA, due to weekly price threatening further selling out of the supply zone coming in at 1.0014-0.9892.
Should weekly sellers overthrow lower-timeframe buyers here, we can expect a H4 close to form sub channel support. This, followed up with a retest, would likely be viewed as a strong sell, targeting the 0.98 region, followed by trend line support on the daily timeframe (taken from the low 0.9542). Entry and risk can be determined on the back of the rejection candle’s structure.
Dow Jones Industrial Average:
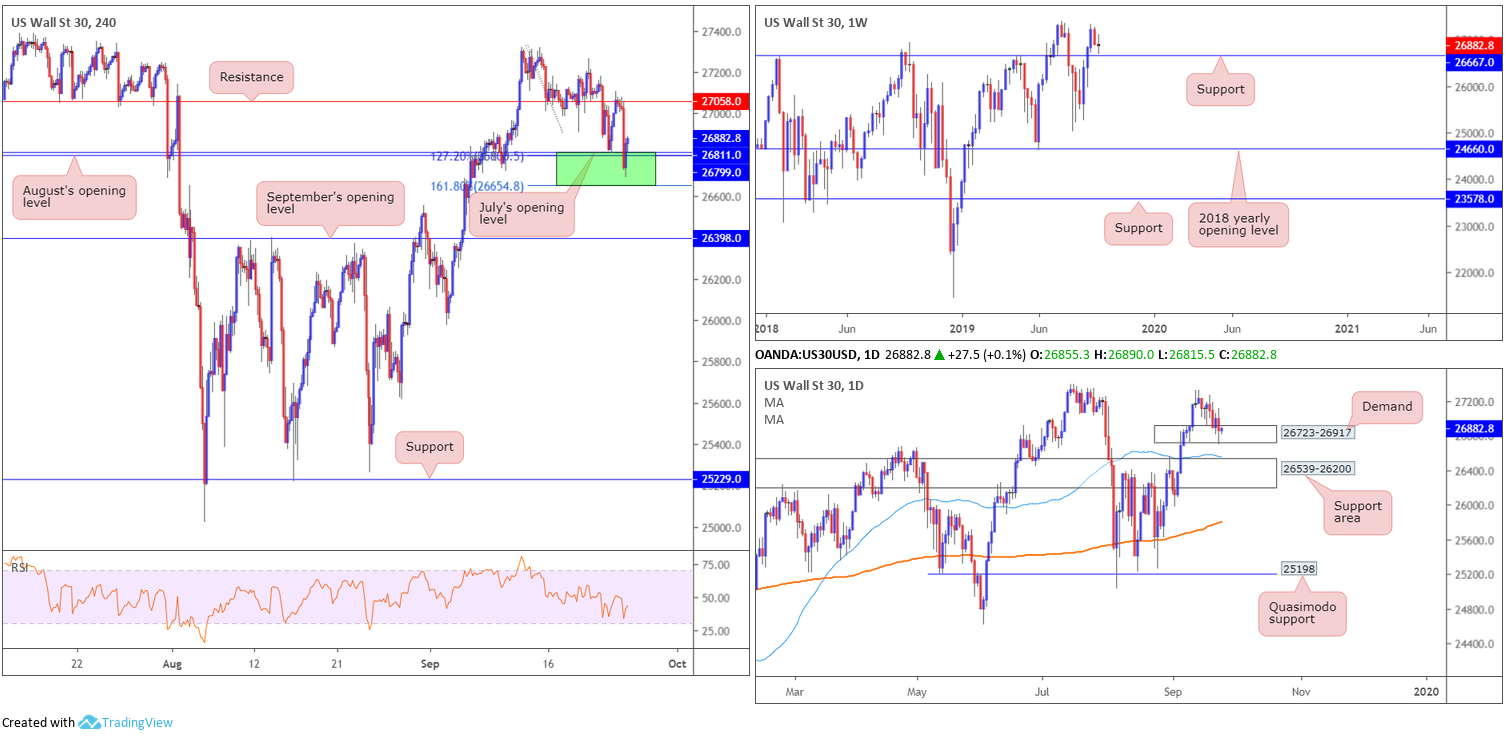
US equity indexes declined across the board Tuesday following reports Democrats are to launch a formal Trump impeachment inquiry amid the Ukraine controversy. The Dow Jones Industrial Average erased 142.22 points, or 0.53%; the S&P 500 declined 25.17 points, or 0.84% and the tech-heavy Nasdaq 100 fell 108.57 points, or 1.39%.
The recent pullback, which from a technical perspective came about off the underside of a H4 resistance level at 27058, landed the H4 candles back within a familiar area of support at 26654/26811, comprised of August and July’s opening levels at 26799 and 26811, respectively, the 127.2% Fibonacci extension value at 26800 and the 161.8% Fibonacci extension at 26654 (green area). This is a particularly appealing area of support having seen it boast a connection to weekly support nearby at 26667 and the current daily demand at 26723-26917.
Areas of consideration:
Longs out of 26654/26811 on the H4 timeframe are certainly a possibility today, in view of the surrounding higher-timeframe confluence and H4 bullish candle recently printed. Entry at current price is an option, with a protective stop-loss order plotted beneath the H4 support zone. The first take-profit target falls in at the said H4 resistance, followed by the all-time high of 27388.
XAU/USD (GOLD):
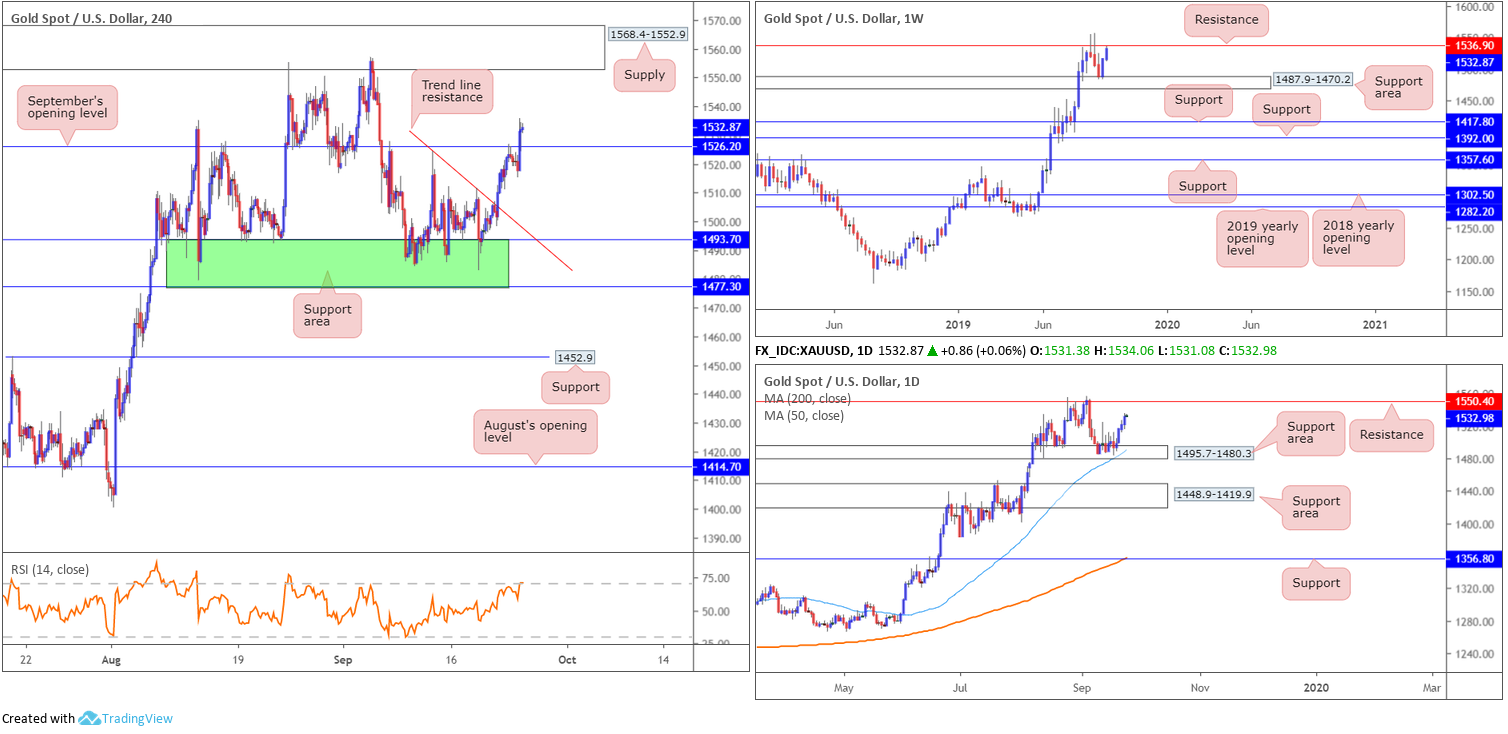
Having seen US equity indexes chalk up losses across the board Tuesday, following reports Democrats are to launch a formal Trump impeachment inquiry amid the Ukraine controversy, haven-demand for the precious metal increased, driving bullion to highs at 1535.6.
Traders who remain long from the break of the local H4 trend line resistance (extended from the high 1524.2), great job as H4 resistance in the form of September’s opening level at 1526.2 gave way yesterday. This potentially sets the stage for further buying towards H4 supply coming in at 1568.4-1552.9.
On a wider perspective, nonetheless, we have weekly price nearing resistance drawn from 1536.9, after rebounding off the support area at 1487.9-1470.2. A similar picture is visible on the daily timeframe, only the next resistance level does not enter the mix until 1550.4. Note this level falls in a touch beneath the aforementioned H4 supply zone.
Areas of consideration:
Well done to any of our readers who remain long this market. The initial upside target, September’s opening level at 1526.2 was engulfed yesterday. By now most traders will have reduced risk to breakeven and banked a portion of their position.
In view of the bigger picture showing weekly resistance at 1536.9, a cautious stance is recommended. However, do not be afraid to hold some of the position open for a possible run to H4 supply at 1568.4-1552.9, as do not forget this base is sited just north of daily resistance at 1550.4 – the next upside target on the daily timeframe – and gold remains entrenched within a strong uptrend at the moment.
The accuracy, completeness and timeliness of the information contained on this site cannot be guaranteed. IC Markets does not warranty, guarantee or make any representations, or assume any liability regarding financial results based on the use of the information in the site.
News, views, opinions, recommendations and other information obtained from sources outside of www.icmarkets.com.au, used in this site are believed to be reliable, but we cannot guarantee their accuracy or completeness. All such information is subject to change at any time without notice. IC Markets assumes no responsibility for the content of any linked site.
The fact that such links may exist does not indicate approval or endorsement of any material contained on any linked site. IC Markets is not liable for any harm caused by the transmission, through accessing the services or information on this site, of a computer virus, or other computer code or programming device that might be used to access, delete, damage, disable, disrupt or otherwise impede in any manner, the operation of the site or of any user’s software, hardware, data or property.


