
Key risk events today:
German Final IFO Business Climate; UK Inflation; US Core Durable Goods Orders m/m and Durable Goods Orders m/m.
(Previous analysis as well as outside sources – italics).
EUR/USD:
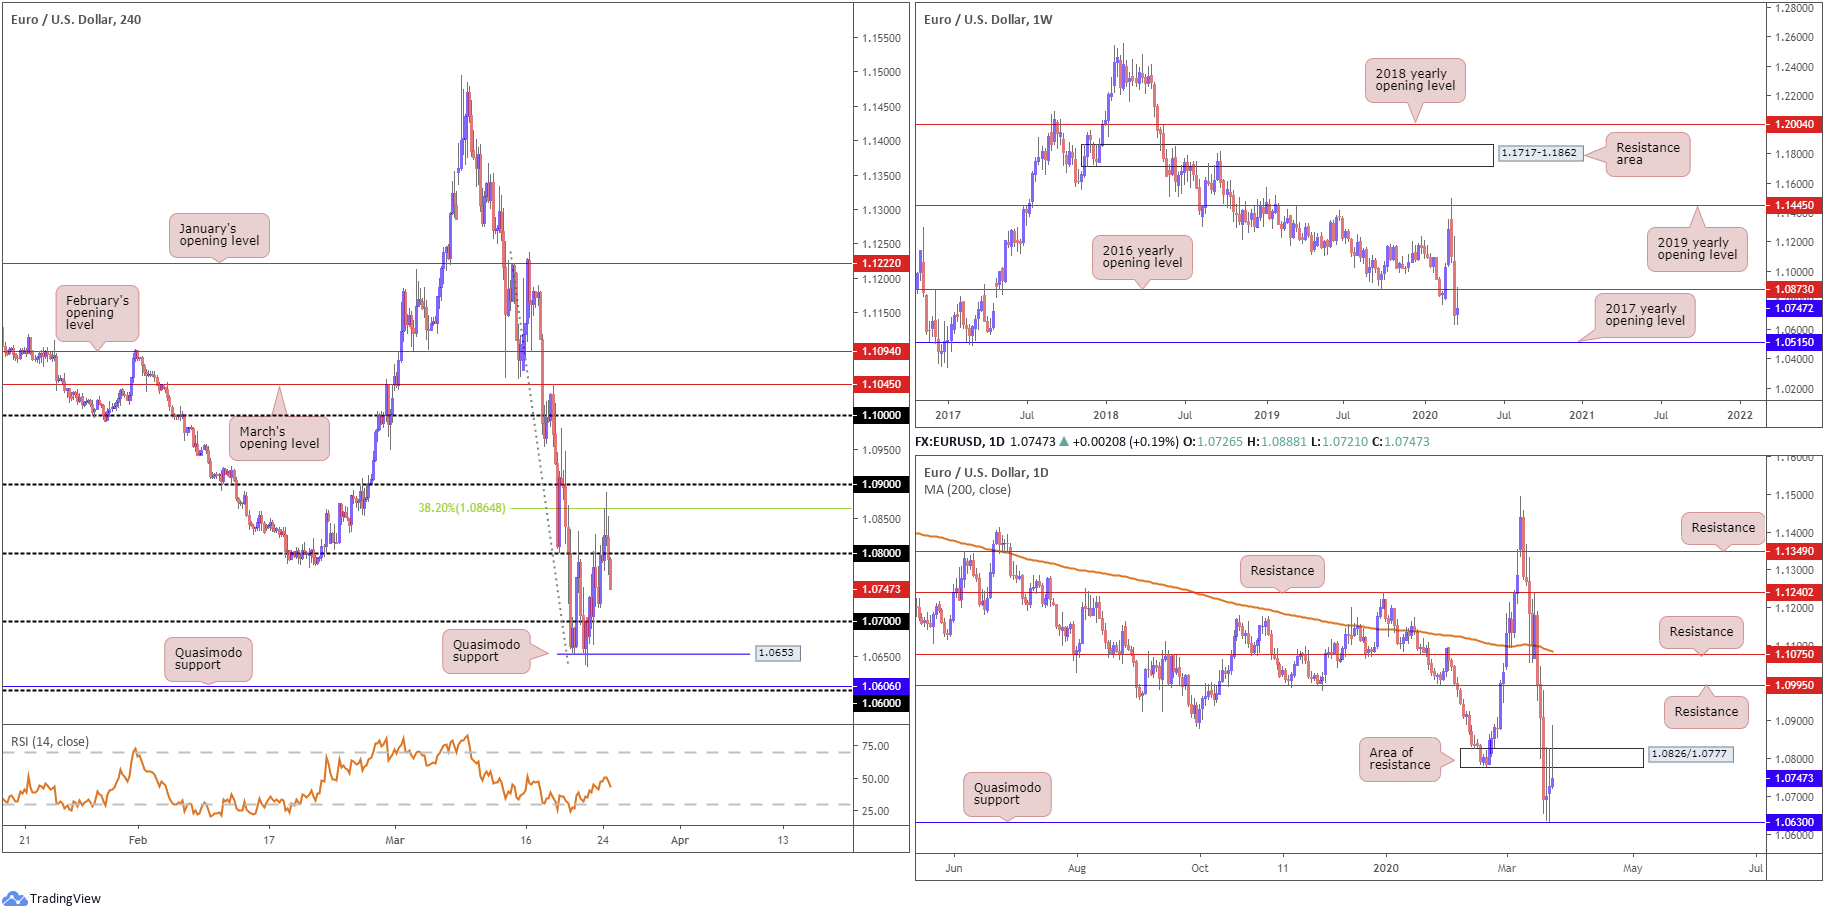
The tail end of London’s session Tuesday had Europe’s shared currency firmer against the buck, though off best levels from a 38.2% Fibonacci retracement ratio south of 1.09 at 1.0864. 1.08 recently gave way on the H4 chart, poised to make a run for 1.07. On the data front, the market largely remained muted by Eurozone and US PMIs.
Technical developments on the weekly timeframe shows the 2016 yearly opening level at 1.0873 welcomed some of the attention yesterday, serving EUR/USD as resistance. Continued downside from this angle may witness the unit shake hands with the 2017 yearly opening level at 1.0515.
Meanwhile, on the daily timeframe recent movement wrapped up in the shape of a shooting star Japanese candlestick pattern (considered a bearish signal at peaks), after violently whipsawing through an area of resistance comprised of 1.0826/1.0777. The key observation here is a break of the Quasimodo formation at 1.0630, the next downside target on the daily chart, which may prep the ground for an approach towards the 2017 yearly opening level mentioned above on the weekly timeframe at 1.0515.
Across the page, H4 price established a firm position sub 1.08 and, as highlighted above, is poised to approach 1.07, with a break shining the spotlight on two layers of Quasimodo support at 1.0653 and 1.0606, followed by the 1.06 handle.
Areas of consideration:
A close south of daily Quasimodo support at 1.0630 this week will potentially provide an unfavourable wind for EUR/USD towards weekly support at 1.0515, the 2017 yearly opening level.
Given both weekly and daily timeframes exhibiting space to manoeuvre lower at the moment, though, a retest at the underside of 1.08 is a potential bearish scenario in the offing today, targeting 1.07 as the initial port of call. Conservative traders will likely seek additional candlestick confirmation at the underside of 1.08 before pulling the trigger; round numbers are prone to whipsaws due to the number of orders the levels attract.
GBP/USD:
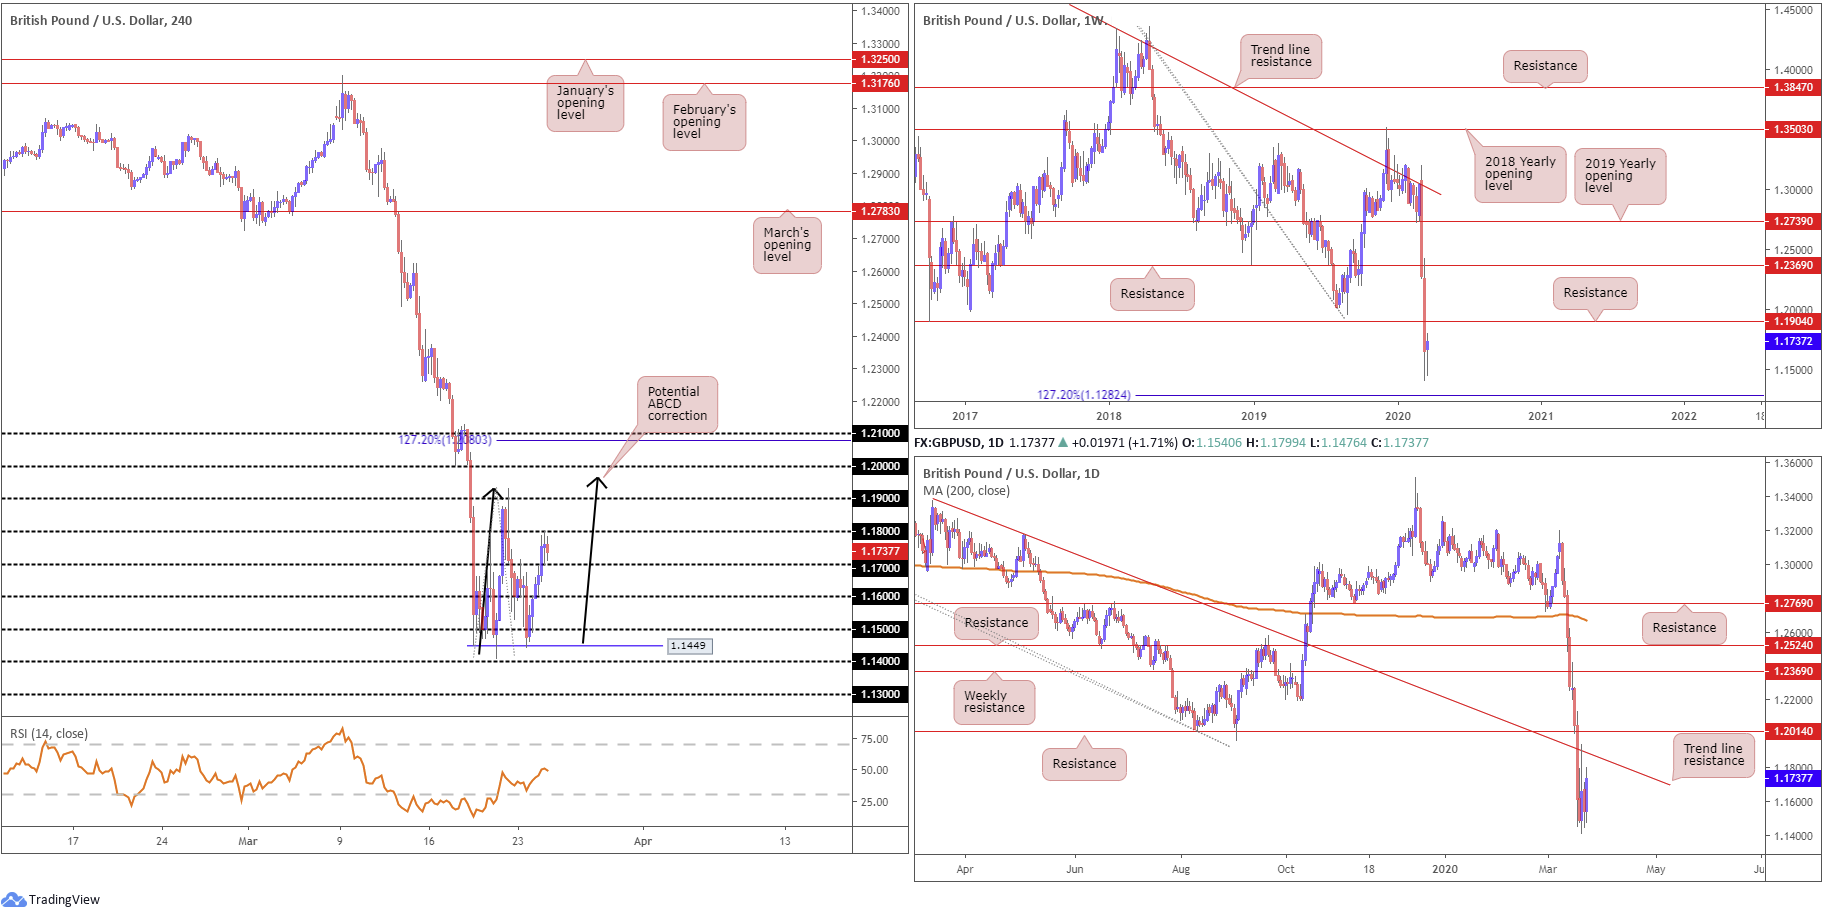
Better-then-expected UK flash manufacturing, along with an early retreat in the US dollar index to lows of 101.05, provided fresh impetus to GBP/USD in early London Tuesday. Moves north of 1.17 took hold, eventually clocking the 1.18 band. This follows Monday’s rejection from Quasimodo support at 1.1449, a touch above levels not seen since the 1980s. Additional upside shows potential for an ABCD completion at 1.1969 (black arrows), a few points beneath the widely watched 1.20 figure.
Further afield on the weekly timeframe, we can see the market trades ahead of the 127.2% Fibonacci extension at 1.1282. Resistance is seen around 1.1904. The daily timeframe houses similar support at 1.1282, the weekly 127.2% Fibonacci extension. Daily structure, however, reveals resistance emerging off a trend line formation, taken from the high 1.3380. It should also be noted the 200-day SMA value at 1.2679 is turning lower after trading flat since November 2019.
Areas of consideration:
Breakout buying above 1.18 on the H4 timeframe may suffer as daily price makes its way to trend line resistance, followed by the 1.19 handle and weekly resistance plotted at 1.1904.
A fakeout above 1.19 to the H4 ABCD correction at 1.1969 is desirable. Not only will this trip buy stops above the round number (and provide sellers liquidity), weekly sellers may be looking to engage around the 1.19 vicinity as well. Therefore, it’s certainly worth keeping eyes open for any whipsaws above 1.19 today/this week.
AUD/USD:
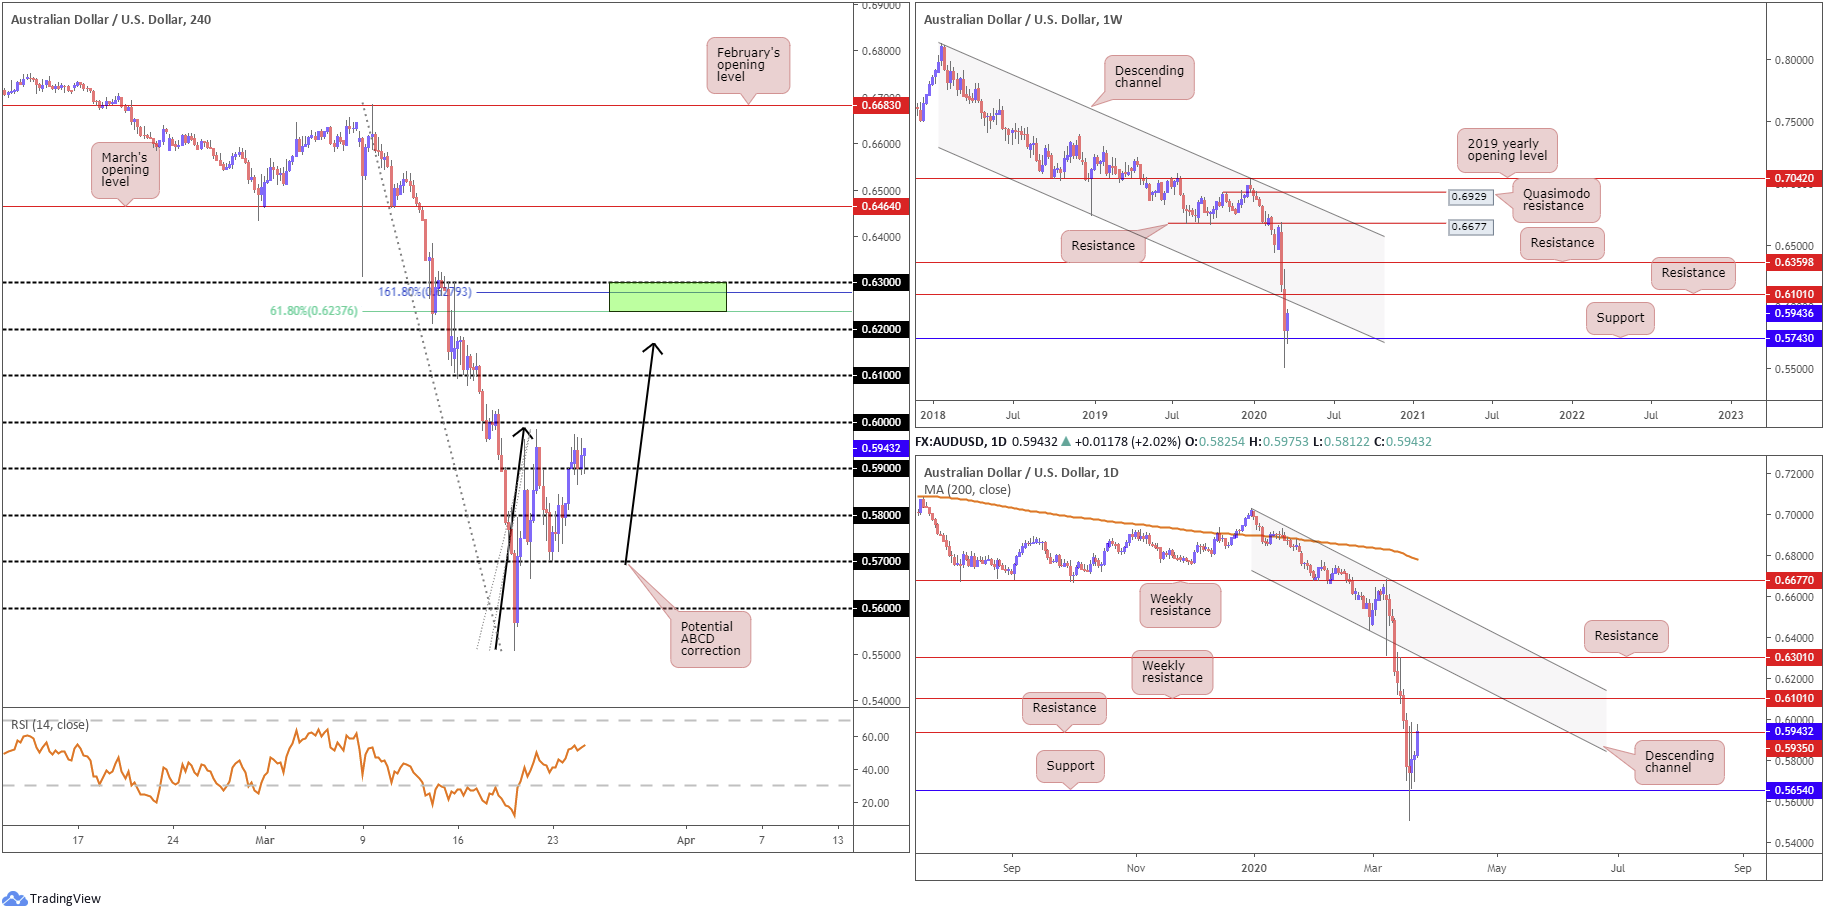
The Australian dollar outperformed against the buck Tuesday amid broader risk sentiment and a waning US dollar index. AUD/USD made a play for the 0.59 handle in early trade, securing position and making a run for highs at 0.5975. Establishing support off 0.59, H4 players likely have their crosshairs fixed at the underside of 0.60, a widely watched psychological boundary. What’s also notable from a technical perspective on the H4 timeframe is a potential ABCD correction, terminating at 0.6169. Extension beyond this level will likely land price at 0.62, with a break of this base highlighting an interesting Fibonacci combination between the 0.63 handle, a 161.8% Fibonacci extension level at 0.6279 and a 61.8% Fibonacci retracement at 0.6237.
Persistent coronavirus headlines, coupled with muscular demand for the dollar last week, sparked a 370+ point down move in AUD/USD, a week after a near-7% decline. Modestly recovering from worst levels, a touch above 0.55, price is currently seen securing ground back above weekly support at 0.5743. To the upside, focus shifts to channel support-turned resistance, taken from the low 0.6744, and resistance plotted at 0.6101.
Meanwhile, on the daily timeframe, price action fades 0.5654, with resistance at 0.5935 recently entering the mix. A break through this angle underlines weekly resistance mentioned above at 0.6101.
Areas of consideration:
Daily resistance in play at 0.5935, technically, hampers upside off 0.59 on the H4 timeframe. Therefore, traders who bought into the retest at 0.59 may have trouble holding on today. A whipsaw through 0.59 could be on the cards to run stops.
Longs north of 0.60, preferably on the back of a retest play, could be something to keep an eye on today, since room to run towards 0.61 is seen on both the H4, daily and weekly timeframes. If 0.61 enters view, a fakeout north of the round number could be in the offing to complete the H4 ABCD pattern before trekking lower, which may be a bearish scenario worthy of attention.
USD/JPY:
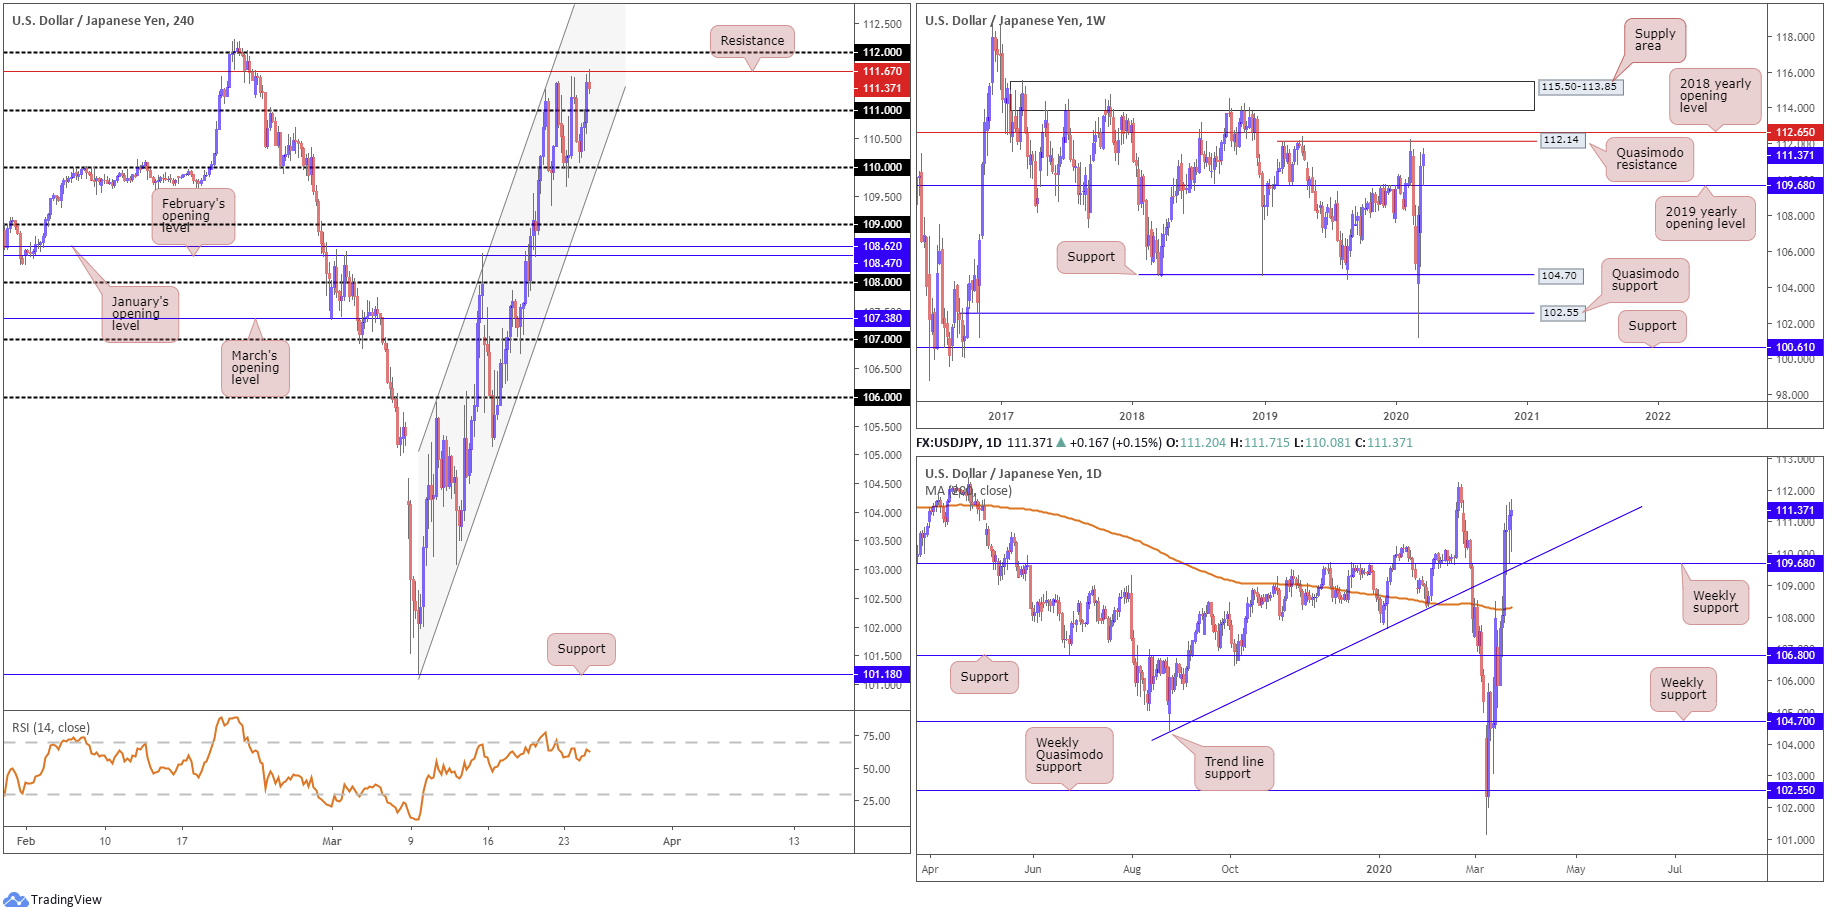
Largely in lockstep with US equities as well as gleaning support from a pullback observed in the US dollar index, USD/JPY registered its sixth consecutive daily gain Tuesday.
The weekly timeframe has price action retesting the 2019 yearly opening level at 109.68, with the path paved for moves to Quasimodo resistance priced in at 112.14 and the 2018 yearly opening level at 112.65. Down a notch, daily movement also reveals limited resistance to the upside until reaching the noted weekly resistances.
Across the page on the H4 timeframe 111 is disfigured, suffering a number of whipsaws in both directions. Resistance at 111.67 made an appearance in recent hours, closely shadowed by the 112 handle. In addition, we can see the relative strength index (RSI) producing bearish divergence out of overbought waters.
Areas of consideration:
According to chart studies on the higher timeframes, we are perhaps heading for the 112 neighbourhood, with the possibility of a whipsaw emerging through the said round number to weekly resistance at 112.14. As such, setting alerts around 112 might be an idea today.
A fakeout through 112 that draws in weekly Quasimodo resistance at 112.14, shaped by way of a H4 bearish candlestick signal, would likely be sufficient to draw attention and push for lower ground, targeting 111 as the initial downside level.
USD/CAD:
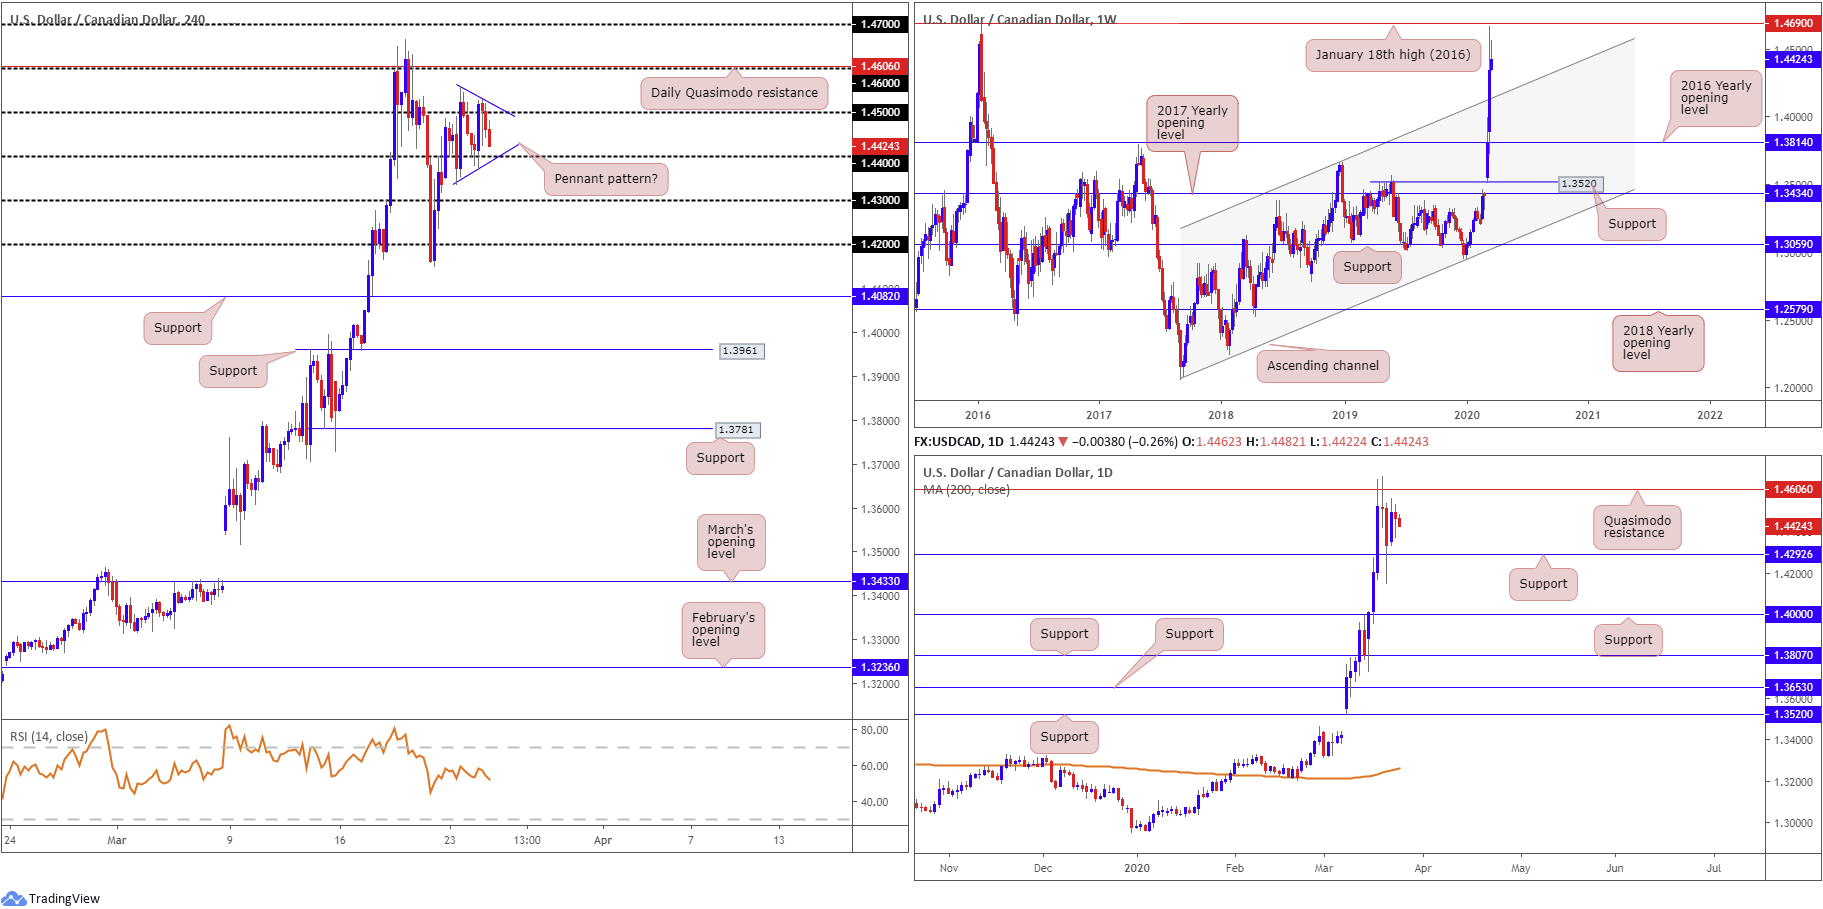
Despite ranging more than 150 points Tuesday, the session was pretty much subdued in comparison to previous movement. The narrow trading activity between 1.45/4 has seen H4 price begin pencilling in a possible pennant pattern (blue 1.4559/1.4335), considered by many to be a continuation setting. Successful completion of this pattern could lead to moves north of 1.46 and the daily Quasimodo resistance at 1.4606.
Weekly price recently reached highs of 1.4667, a touch short of the January 18th high at 1.4690 (2016), before pulling back to 1.4336. This came after retesting the 2016 yearly opening level at 1.3814, and breaching long-term channel resistance, etched from the high 1.3661. In terms of daily flow, we’re confined between support at 1.4292 and the said Quasimodo resistance at 1.4606.
Areas of consideration:
All (technical) eyes are likely fixed on the H4 pennant pattern for now. A bullish close beyond the upper limit will encourage additional USD buying, likely overthrowing 1.46 and heading for at least 1.47. Do bear in mind, conservative traders generally watch for price action to retest the upper boundary after closing higher, with some believing it adds weight.
In the event of pattern failure, 1.43 is in sight as potential support, having seen the base merge closely with daily support mentioned above at 1.4292.
USD/CHF:
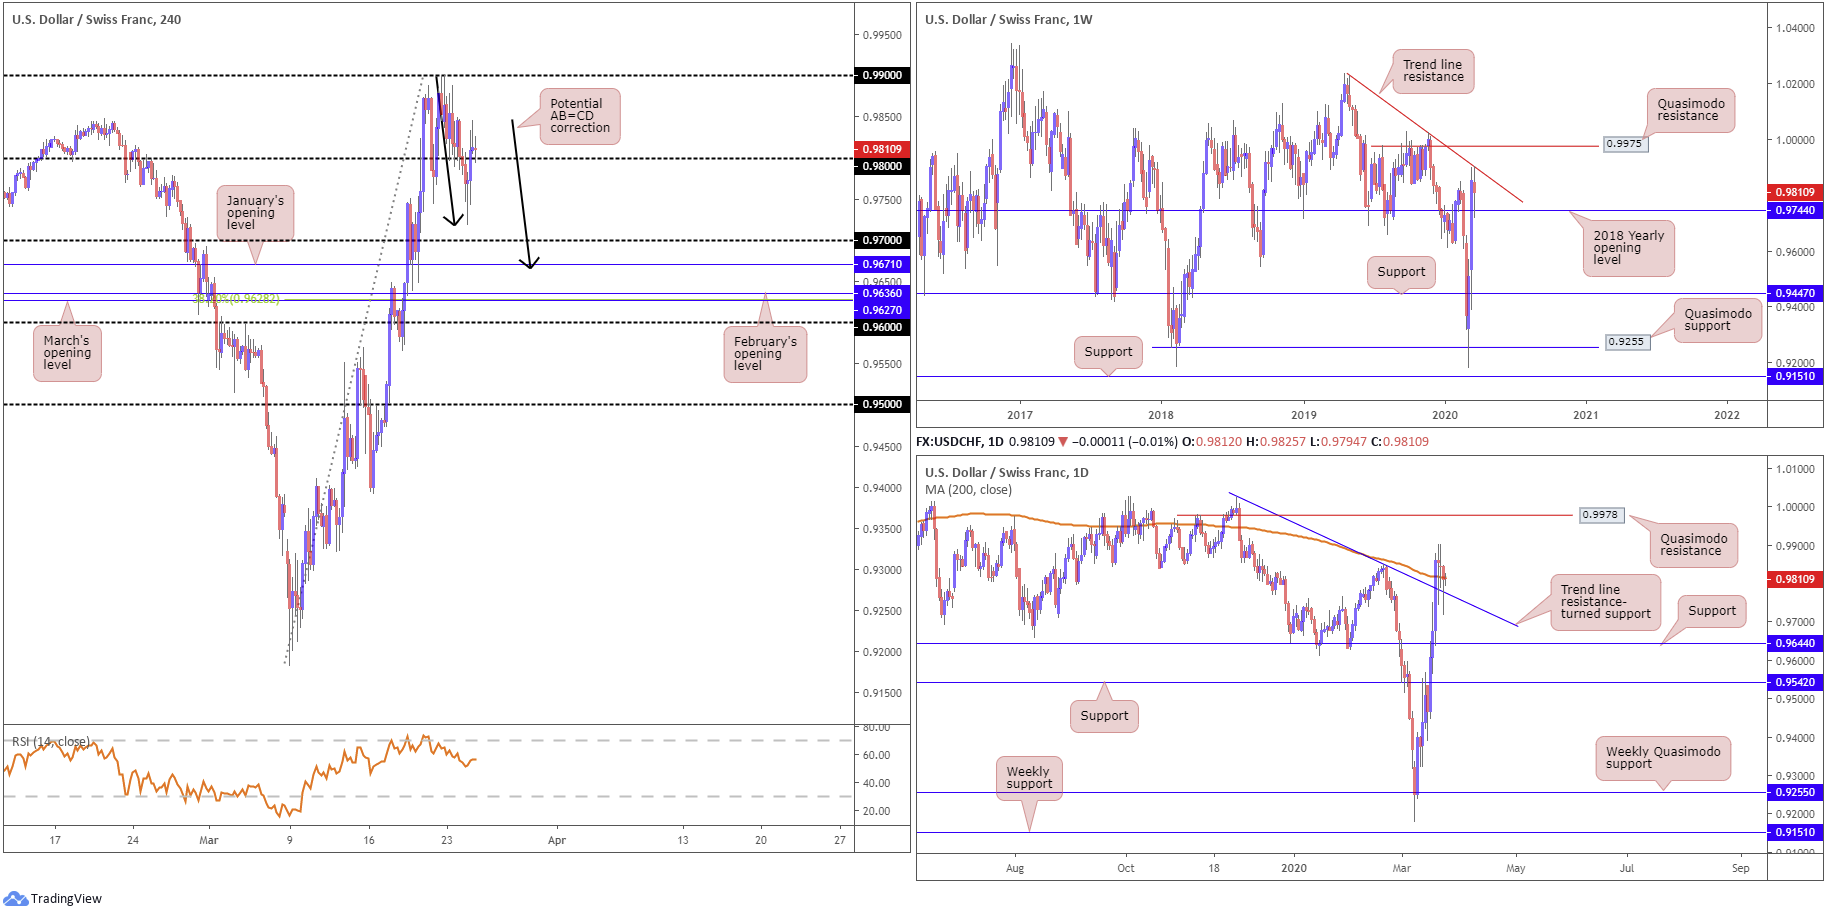
Kicking things off from the weekly timeframe this morning, technical developments show the current candle confined between trendline resistance, extended from the high 1.0226 and the 2018 yearly opening level at 0.9744. Moves higher has Quasimodo resistance in view at 0.9975, whereas a push through 0.9744 could see support at 0.9447 re-enter the fight.
A closer reading of price action on the daily timeframe has the candles retesting trend line resistance-turned support, taken from the high 1.0023, and 200-day SMA. Another layer of Quasimodo resistance is seen to the upside at 0.9978; a break lower, however, can see the unit find support at 0.9644.
H4 price can be seen engaging with 0.98, after forming a shooting star candlestick pattern (considered a bearish signal at peaks), though a break lower entails facing opposition off the daily timeframe, the noted supports. In addition to the above, traders will also note the potential AB=CD correction (black arrows) that terminates beneath 0.97 at January’s opening level from 0.9671, set just ahead of March and February’s opening levels at 0.9627 and 0.9636, respectively, along with a 38.2% Fibonacci ratio at 0.9628.
Areas of consideration:
USD/CHF is a difficult read this morning. Weekly price sandwiched between relatively nearby structure; daily price tests a combination of support, while H4 action shows possibility of completing an AB=CD structure beneath 0.97.
As of current price, therefore, neither a long nor short seems attractive right now.
Dow Jones Industrial Average:
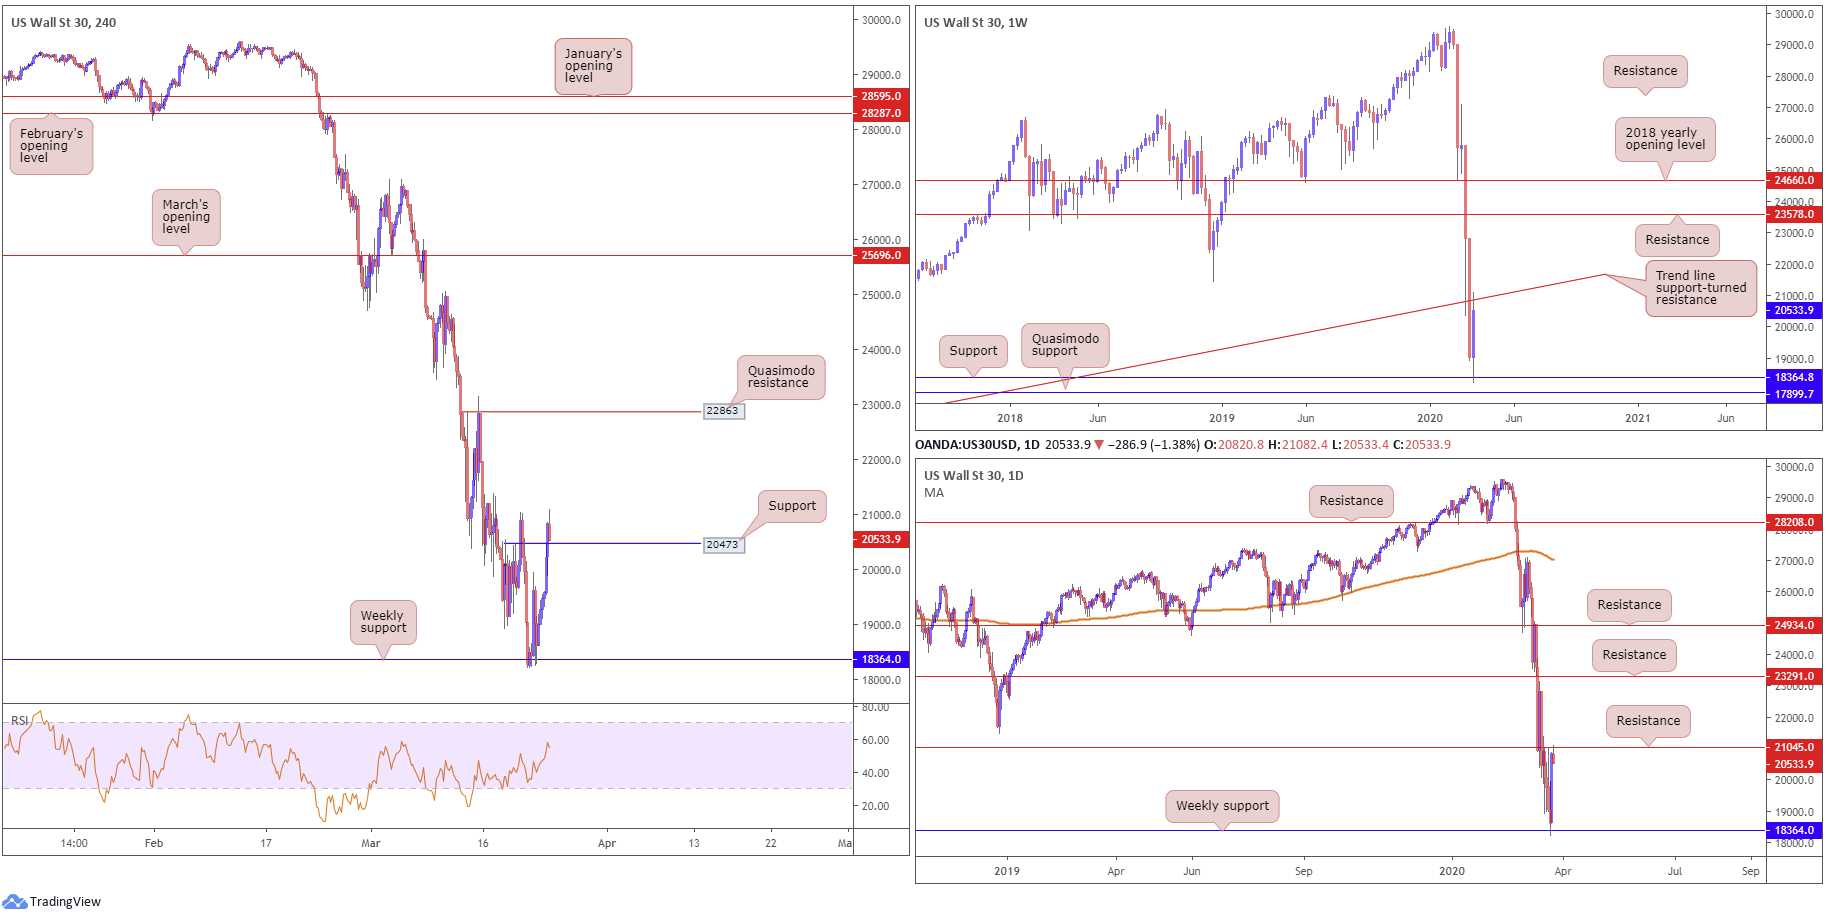
Major US benchmarks firmed across the board Tuesday amid indication Congress was closing in on an agreement for a fiscal stimulus package to alleviate economic effects of the coronavirus. The Dow Jones Industrial Average gained 2112.98 points, or 11.37%; the S&P 500 also firmed by 209.93 points, or 9.38%, and the tech-heavy Nasdaq 100 ended higher by 546.91 points, or 7.81%.
Technical headlines had weekly price greet trend line support-turned resistance, taken from the low 6466, after staging a strong recovery off support coming in at 18364. Interestingly, we’re also testing a level of resistance on the daily timeframe at 21045.
Across the page on the H4 timeframe, we dethroned a Quasimodo resistance coming in at 20473 (now a serving support) in recent upside, potentially clearing the river north on the H4 chart to another Quasimodo resistance at 22863. Also of interest is the relative strength index (RSI) recently crossing through 50.00 and reaching 56.00.
Areas of consideration:
Although coming off a monstrous one-day gain, resistance on both the weekly and daily timeframes is seen, possibly weighing on a retest at H4 support from 20473. Conservative traders still interested in longs from 20473 will likely wait for additional candlestick confirmation to form before pulling the trigger. This helps identify buyer intent and provides entry and risk levels to work with.
Others who feel 20473 may give way will likely seek bearish scenarios south of the number, targeting weekly support mentioned above at 18364.
XAU/USD (GOLD):
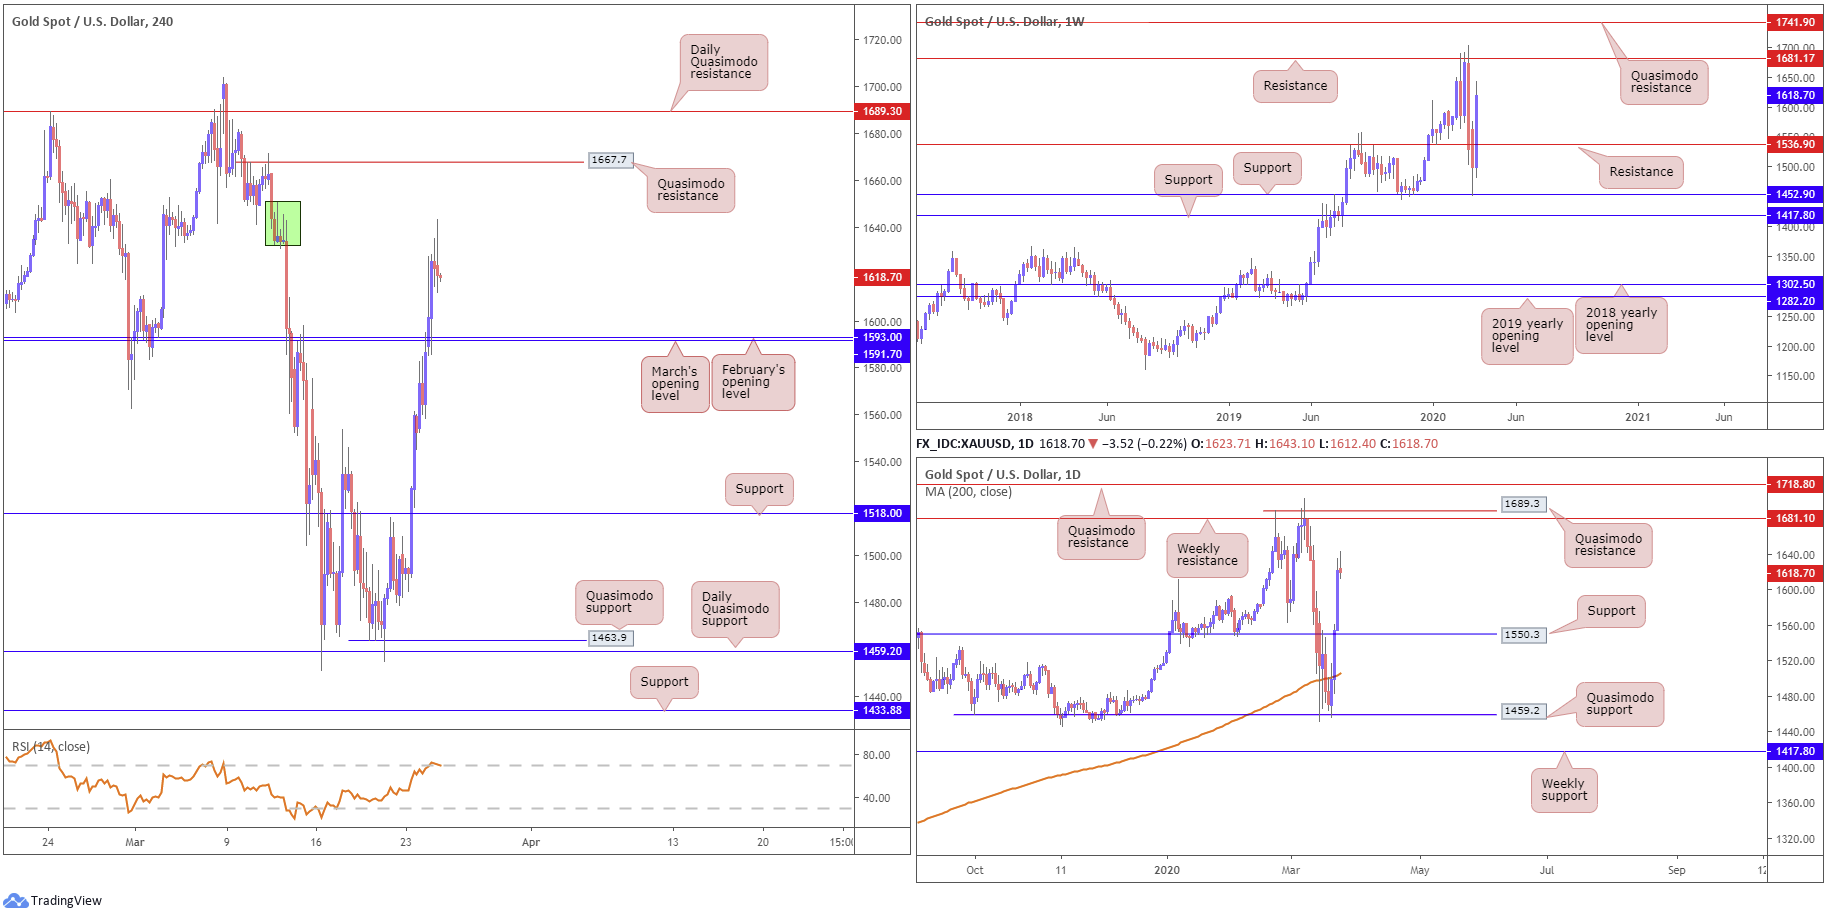
Bullion glided to fresh weekly peaks Tuesday, a day after adding more than $55, or 3.7%. This confirmed a three-day winning streak amid global recession fears.
Technically speaking, H4 price faces supply at 1650.3-1633.3 (green) and recently put in a half-hearted shooting star pattern – considered a bearish signal at peaks. Dips from here could see the unit shake hands with February and March’s opening levels at 1593.0 and 1591.7, respectively. Continued bidding from current price, though, could land Quasimodo resistance in the net at 1667.7. It might also interest some traders to note the relative strength index (RSI) is seen testing overbought waters.
Further out on the higher timeframes, we can see weekly price steaming higher, poised to approach resistance at 1681.1. Meanwhile, daily price made its way through resistance at 1550.3 in recent trade, now a serving support level. Like the weekly timeframe, daily movement exhibits scope to firm as far north as weekly resistance at 1681.1, followed by daily Quasimodo resistance at 1689.3.
Areas of consideration:
With upside free of resistance on all three timeframes analysed, a retest at February and March’s opening levels from 1593.0 and 1591.7 is likely of interest today. Combine these levels with a H4 bullish candlestick signal, such as a hammer formation or an engulfing pattern, this will likely encourage buying, with previous highs set as initial targets, followed by the noted higher-timeframe resistances.
The accuracy, completeness and timeliness of the information contained on this site cannot be guaranteed. IC Markets does not warranty, guarantee or make any representations, or assume any liability regarding financial results based on the use of the information in the site.
News, views, opinions, recommendations and other information obtained from sources outside of www.icmarkets.com.au, used in this site are believed to be reliable, but we cannot guarantee their accuracy or completeness. All such information is subject to change at any time without notice. IC Markets assumes no responsibility for the content of any linked site.
The fact that such links may exist does not indicate approval or endorsement of any material contained on any linked site. IC Markets is not liable for any harm caused by the transmission, through accessing the services or information on this site, of a computer virus, or other computer code or programming device that might be used to access, delete, damage, disable, disrupt or otherwise impede in any manner, the operation of the site or of any user’s software, hardware, data or property.


