
Key risk events today:
RBNZ Official Cash Rate and Rate Statement.
(Previous analysis as well as outside sources – italics).
EUR/USD:
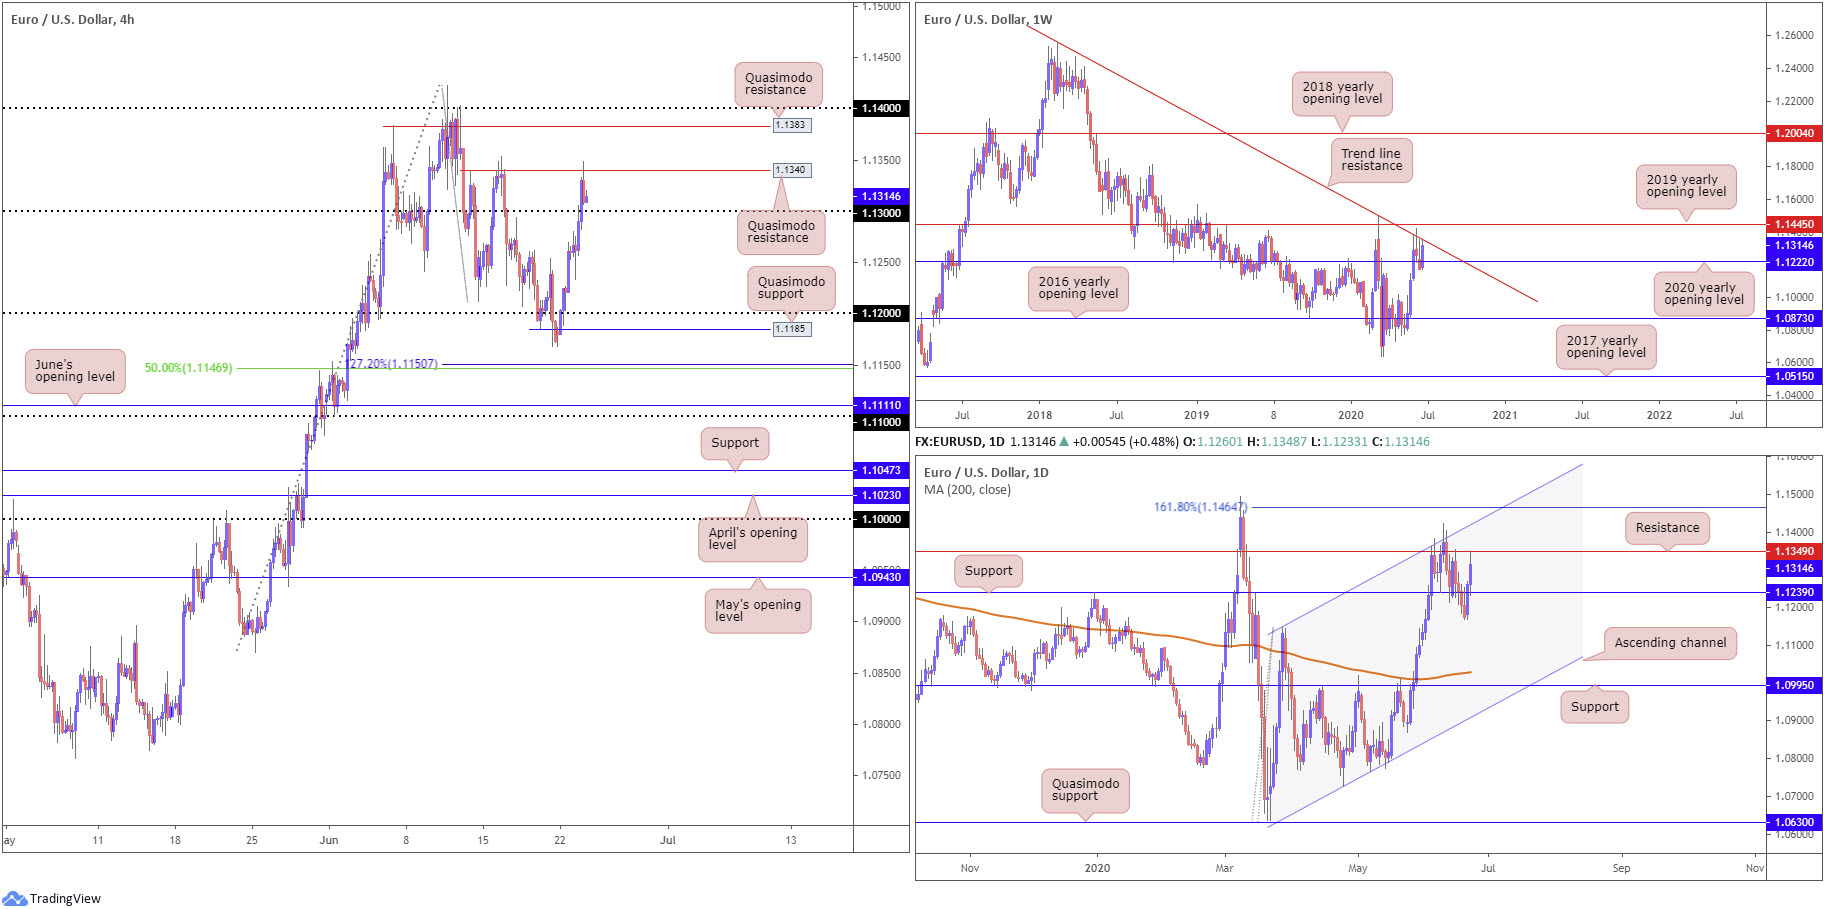
Europe’s single currency extended upside Tuesday amid healthy Eurozone PMIs and additional dollar softening under 97.00 (DXY). Despite an early rebound from the underside of 1.13 on the H4 during early London hours (see M30 for clearer view), the level eventually yielded and unlocked the door to Quasimodo resistance nearby at 1.1340, which held into the close. Above the latter, traders’ crosshairs are likely fixed on another Quasimodo formation at 1.1383.
Price action, based on the weekly timeframe, shows buyers and sellers battling for position ahead of long-standing trend line resistance, taken from the high 1.2555. A downturn from here will likely revisit the 2020 yearly opening level at 1.1222 as support, while continued bidding may cross swords with the 2019 yearly opening level at 1.1445. Meanwhile, yesterday had daily price regroup at 1.1239 as support before rallying to resistance at 1.1349.
Areas of consideration:
For traders who read Tuesday’s technical briefing you may recall the following (italics):
A fakeout through 1.13 is also something to keep in mind. Surpassing 1.13 and tagging H4 Quasimodo resistance at 1.1340 would not only trip stops above the round number, it would entice fresh sellers off 1.1340. Conservative sellers, however, would want to see a H4 close back under 1.13 form before committing to this fakeout scenario, targeting 1.1250ish as an initial take-profit zone.
Not only did the H4 Quasimodo resistance make an entrance at 1.1340, daily resistance at 1.1349 did as well. Therefore, a H4 close below 1.13 is still likely on the radar today for sellers.
GBP/USD:
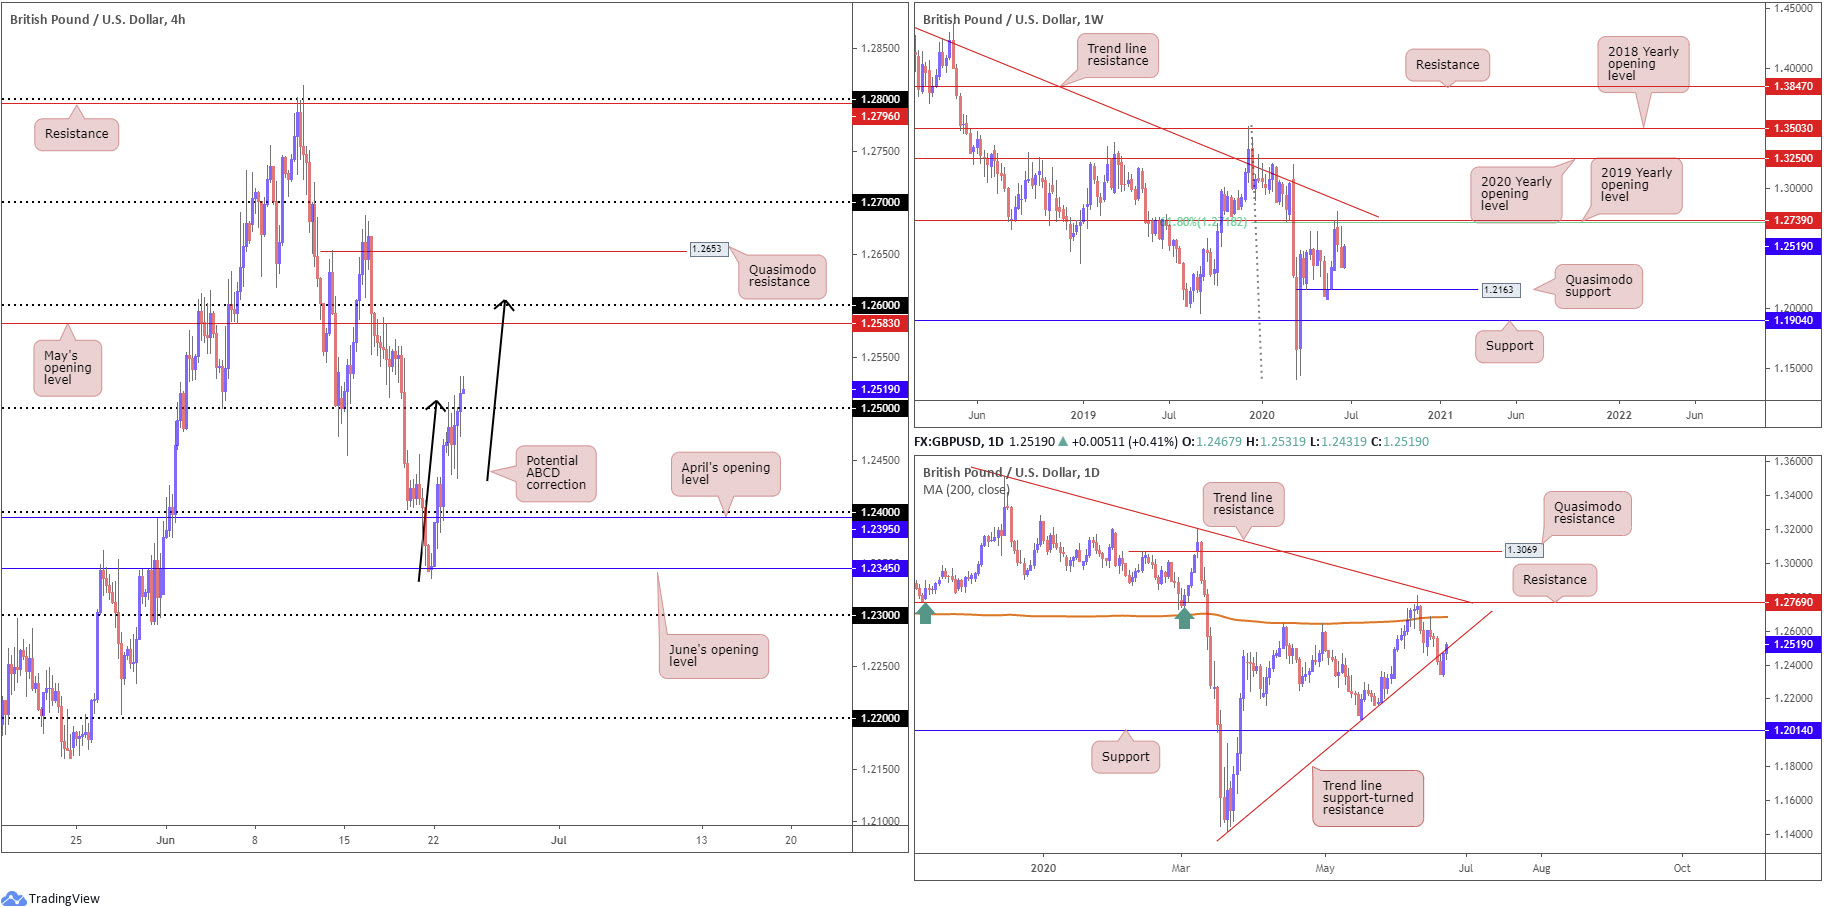
Persistent USD downside, along with UK Prime Minister Boris Johnson announcing the easing of lockdown measures, guided GBP/USD higher Tuesday.
1.25 relinquished ground on the H4 as a result of recent buying. This, as long as buyers maintain a position north of 1.25, positions May’s opening level at 1.2583 as feasible resistance today, closely followed by 1.26. Technicians will also note a possible ABCD correction (black arrows) forming towards 1.26ish.
Movement on the daily timeframe is seen shaking hands with trend line support-turned resistance, taken from the low 1.1409. A break here shines the spotlight on the 200-day SMA (orange – 1.2683), stationed close by resistance at 1.2769.
Weekly price, on the other hand, trades in no man’s land, with resistance not expected to make an appearance until reaching the 61.8% Fibonacci retracement ratio at 1.2718 and 2019 yearly opening level at 1.2739. With respect to support, a Quasimodo formation resides at 1.2163.
Areas of consideration:
Bullish scenarios north of 1.25 will likely be on the watchlist today, particularly if a retest of the latter comes to fruition, targeting 1.26ish (ABCD completion [H4]) as an initial take-profit zone.
AUD/USD:
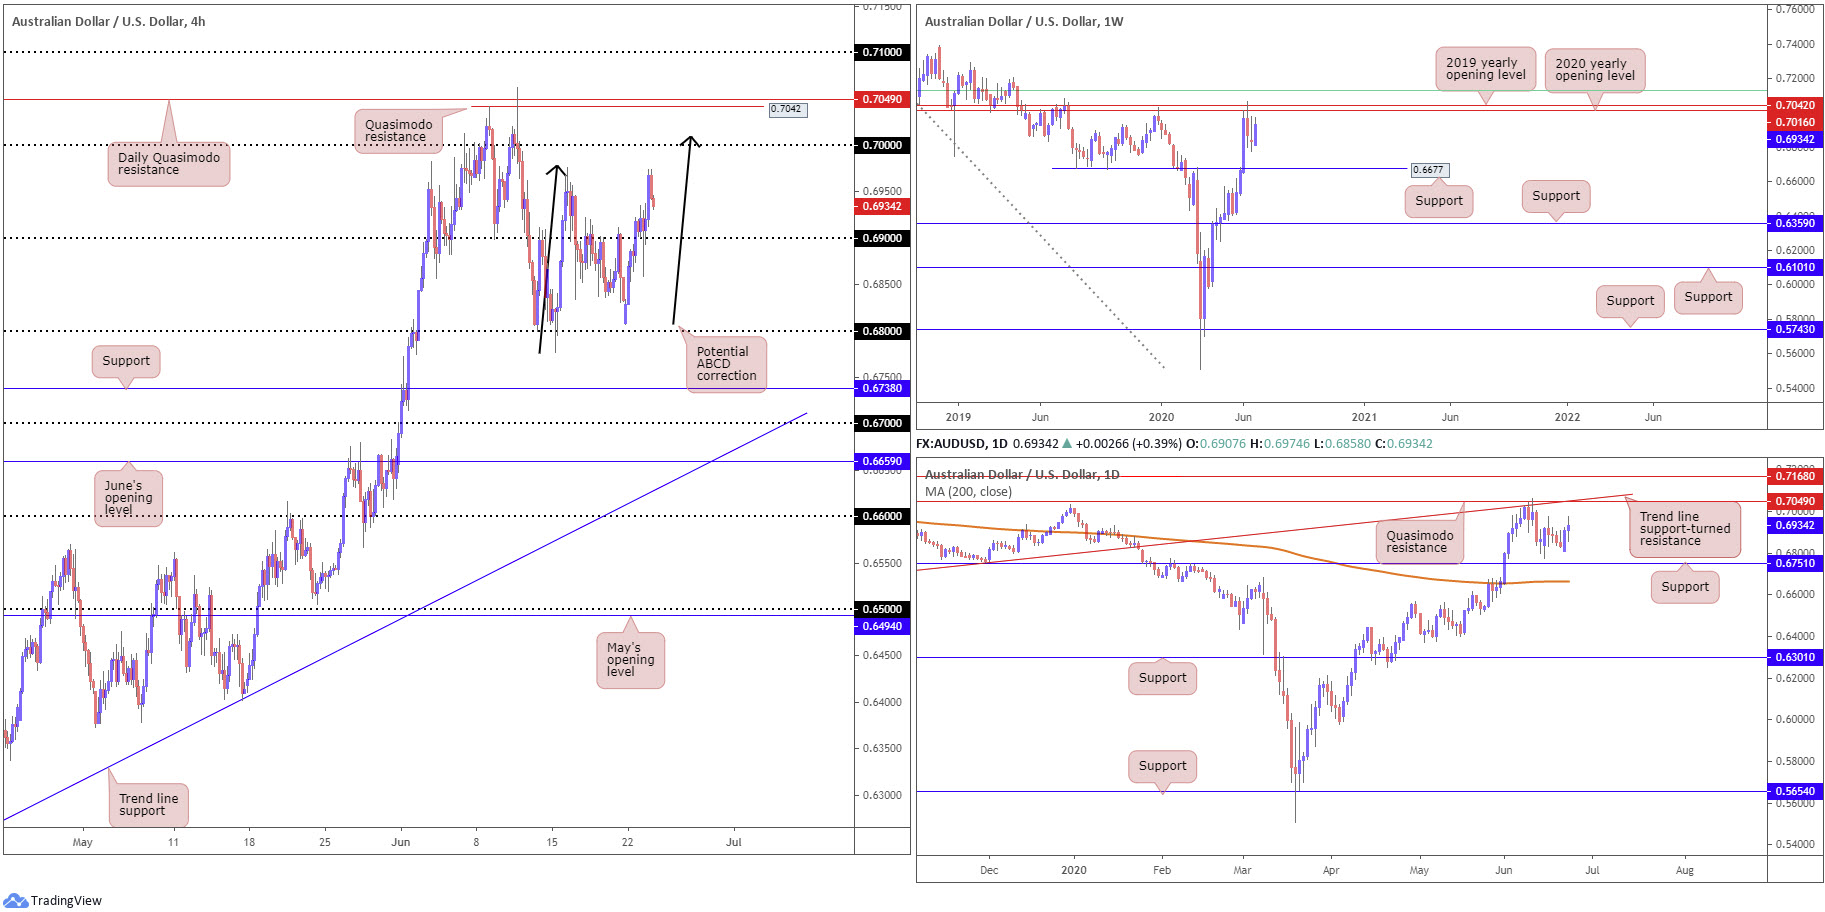
Tuesday’s risk-friendly tone and fragile dollar led the Australian dollar to higher ground Tuesday.
An early, and rather vigorous, push through 0.69 to lows at 0.6858 squeezed a number of orders before stabilising and eventually heading for highs at 0.6974. Potential resistance exists in the form of the 0.6976 June 16 high, closely followed by the key figure 0.70 on the H4 timeframe. Also worth bringing to the fore, as highlighted in Tuesday’s technical briefing, is the possibility of an ABCD bearish pattern (black arrows) at 0.7010.
Resistance, forged in the shape of a 2020 yearly opening level and a 2019 yearly opening level, at 0.7016 and 0.7042, respectively, continues to offer a dominant presence on the weekly timeframe. It might also interest traders to note that just above the said resistances we have a 61.8% Fibonacci retracement ratio stationed at 0.7128 (green). In terms of support, crosshairs are perhaps fixed on 0.6677.
From the daily timeframe, Quasimodo resistance at 0.7049 is in sight, merging closely with trend line support-turned resistance, taken from the low 0.6670. Attention on this timeframe also remains at support coming in from 0.6751. Interestingly, lurking beneath here we have the 200-day SMA (orange – 0.6664), sited close by the weekly support at 0.6677.
Areas of consideration:
0.70 offers interesting resistance on the H4 timeframe, merging closely with ABCD confluence. A sell from here, however, is problematic. Aside from the resistances being positioned against the immediate uptrend, the main problem here is the threat of a fakeout materialising through 0.70 to H4 Quasimodo resistance at 0.7042 and daily Quasimodo resistance at 0.7049. Conservative traders, therefore, will likely seek additional H4 bearish candlestick confirmation before committing.
USD/JPY:
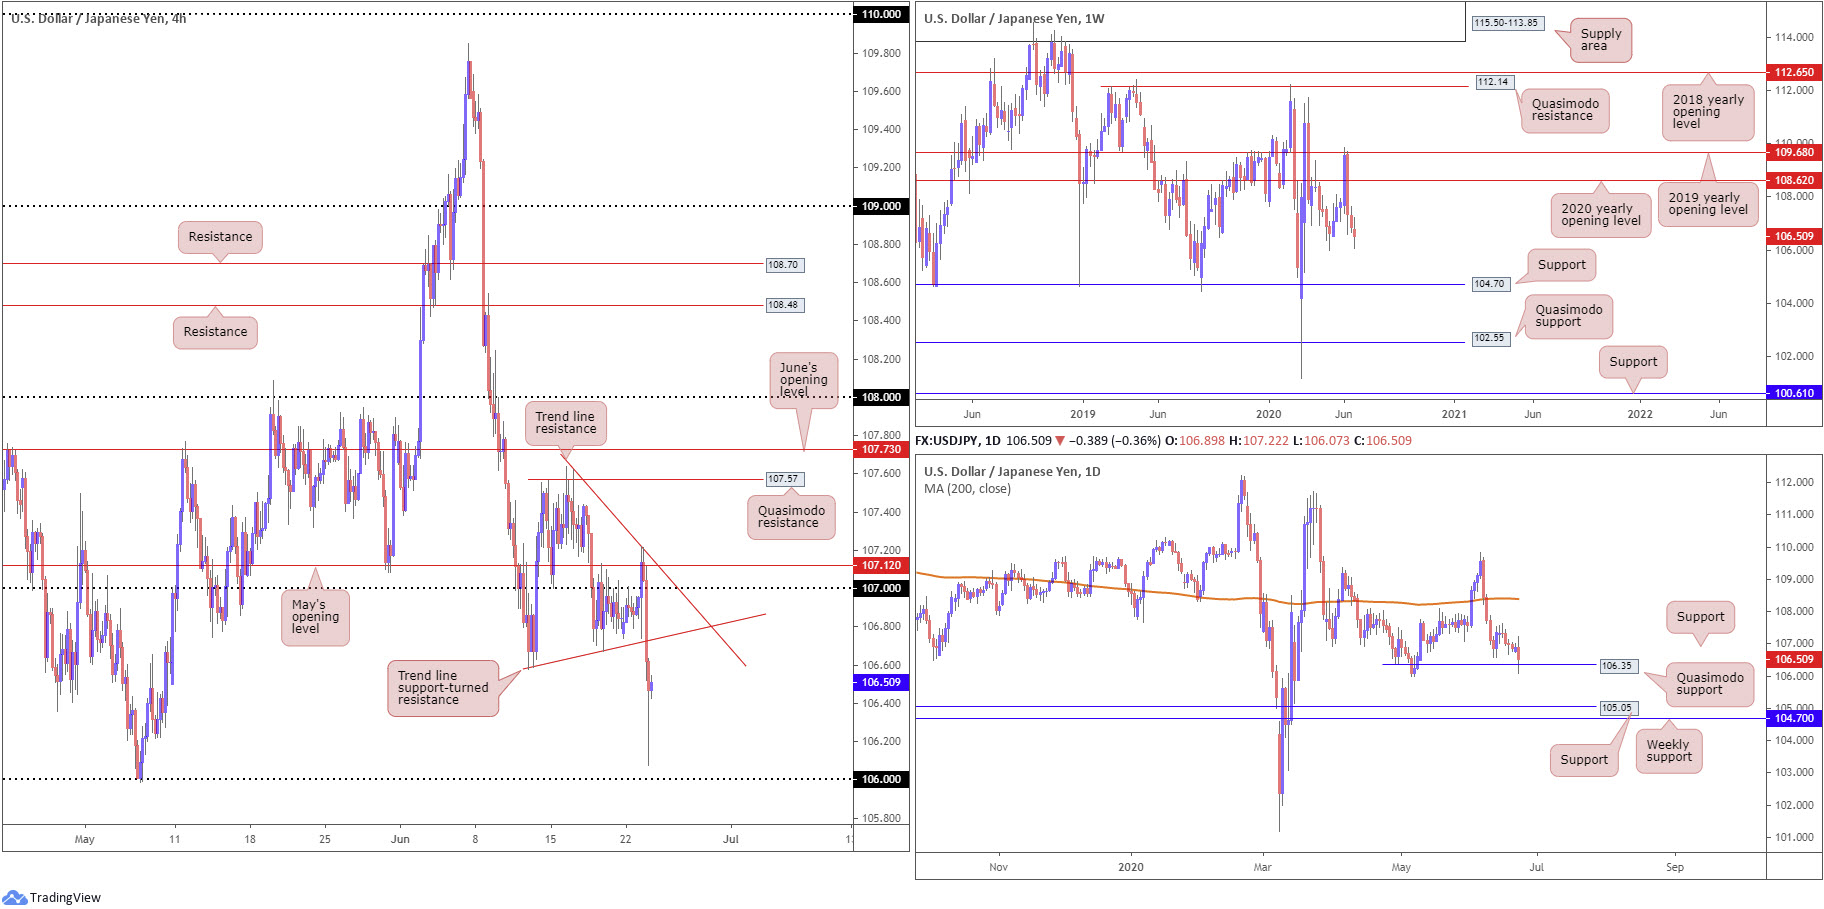
After finding thin air north of May’s opening level at 107.12 in early movement Tuesday, penetrating 107 to the downside going into US trading aggressively absorbed bids, pressured on the back of USD weakness.
H4 price, as you can see, made a run for 106, though bottomed at 106.07, before staging a relatively healthy recovery. The next upside target from current price resides at a local trend line support-turned resistance, drawn from the low 106.57, closely shadowed by 107, May’s opening level at 107.12 and trend line resistance, taken from 107.62.
Technical studies on the daily timeframe reveal a Quasimodo formation at 106.35 made an appearance on Tuesday and is so far delivering support. A break into territory south of the Quasimodo may eventually have price knocking on the door of support at 105.05.
From the weekly timeframe, after rejecting the 2019 yearly opening level at 109.68 and voyaging through the 2020 yearly opening level at 108.62, this shifts focus to the 105.98 6th May low as the next downside target on this scale (represents the low to the daily Quasimodo formation).
Areas of consideration:
Impetus derived from daily Quasimodo support at 106.35 may be sufficient to pull in local H4 trend line support-turned resistance, drawn from the low 106.57. Whether sellers make a stand here is difficult to judge, as 107 and May’s opening level at 107.12 also calls for attention as resistance on the H4 timeframe.
Weekly price, on the other hand, still invites a move to 105.98 – essentially the 106 handle on the H4 timeframe.
USD/CAD:
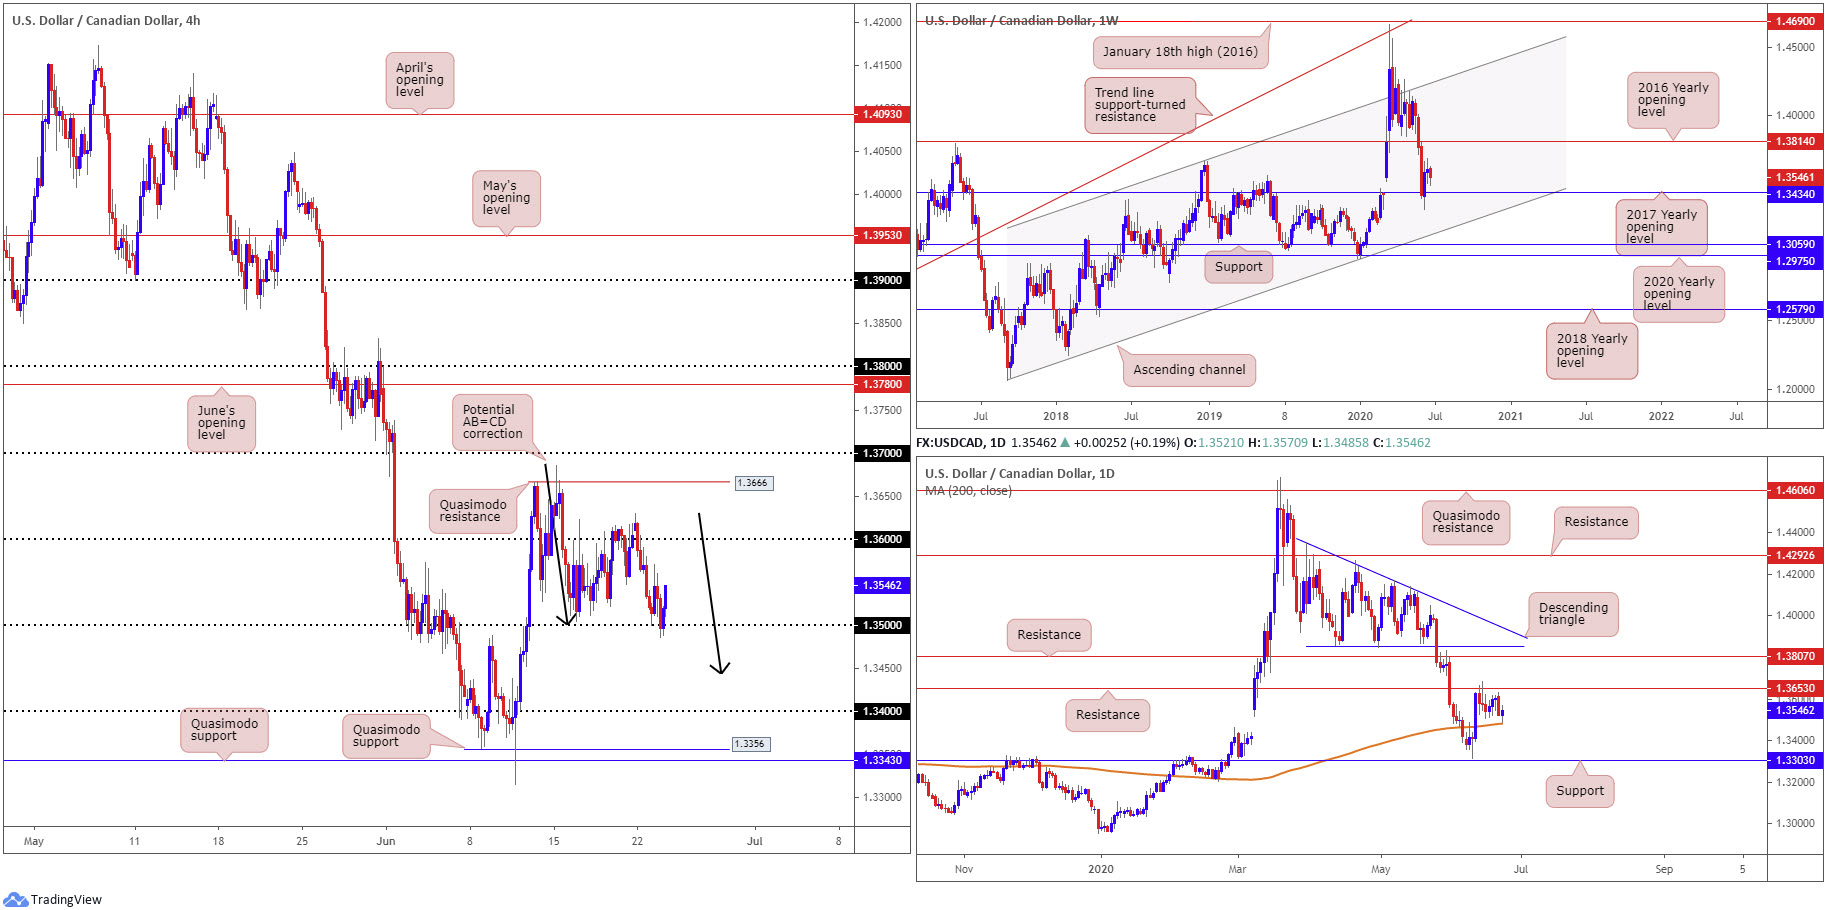
Dollar softness, along with oil prices scoring highs at $41.61/bbl, pressured USD/CAD to 1.35 in recent trade.
H4 price dipped through 1.35, struck lows at 1.3485 and just missed the 200-day SMA (orange – 1.3481) by a hair before regaining a footing above the aforementioned round number.
For traders who read Tuesday’s technical briefing you may recall the following (italics):
A potential scenario that may come about on the H4 timeframe today involves a fakeout through 1.35 into the 200-day SMA (1.3480). A H4 close back above 1.35 off the SMA will likely be a welcomed sight for buyers, feeding into sell-stop liquidity.
As evident from the chart, the fakeout under 1.35, albeit missing the 200-day SMA, has recently witnessed a healthy bid, with H4 closing in on 1.3550. 1.36 offers logical resistance on the H4 scale, while daily price suggests the next port of resistance can be found at 1.3653.
Areas of consideration:
Further upside should not surprise, following the recent fakeout beneath 1.35 – keep eyes on 1.36.
Another base to keep a tab on, in the event buyers fail to maintain a presence above 1.35, is the H4 AB=CD bullish pattern at 1.3440 (black arrows) as it shares space with the 2017 yearly opening level at 1.3434 on the weekly timeframe.
USD/CHF:
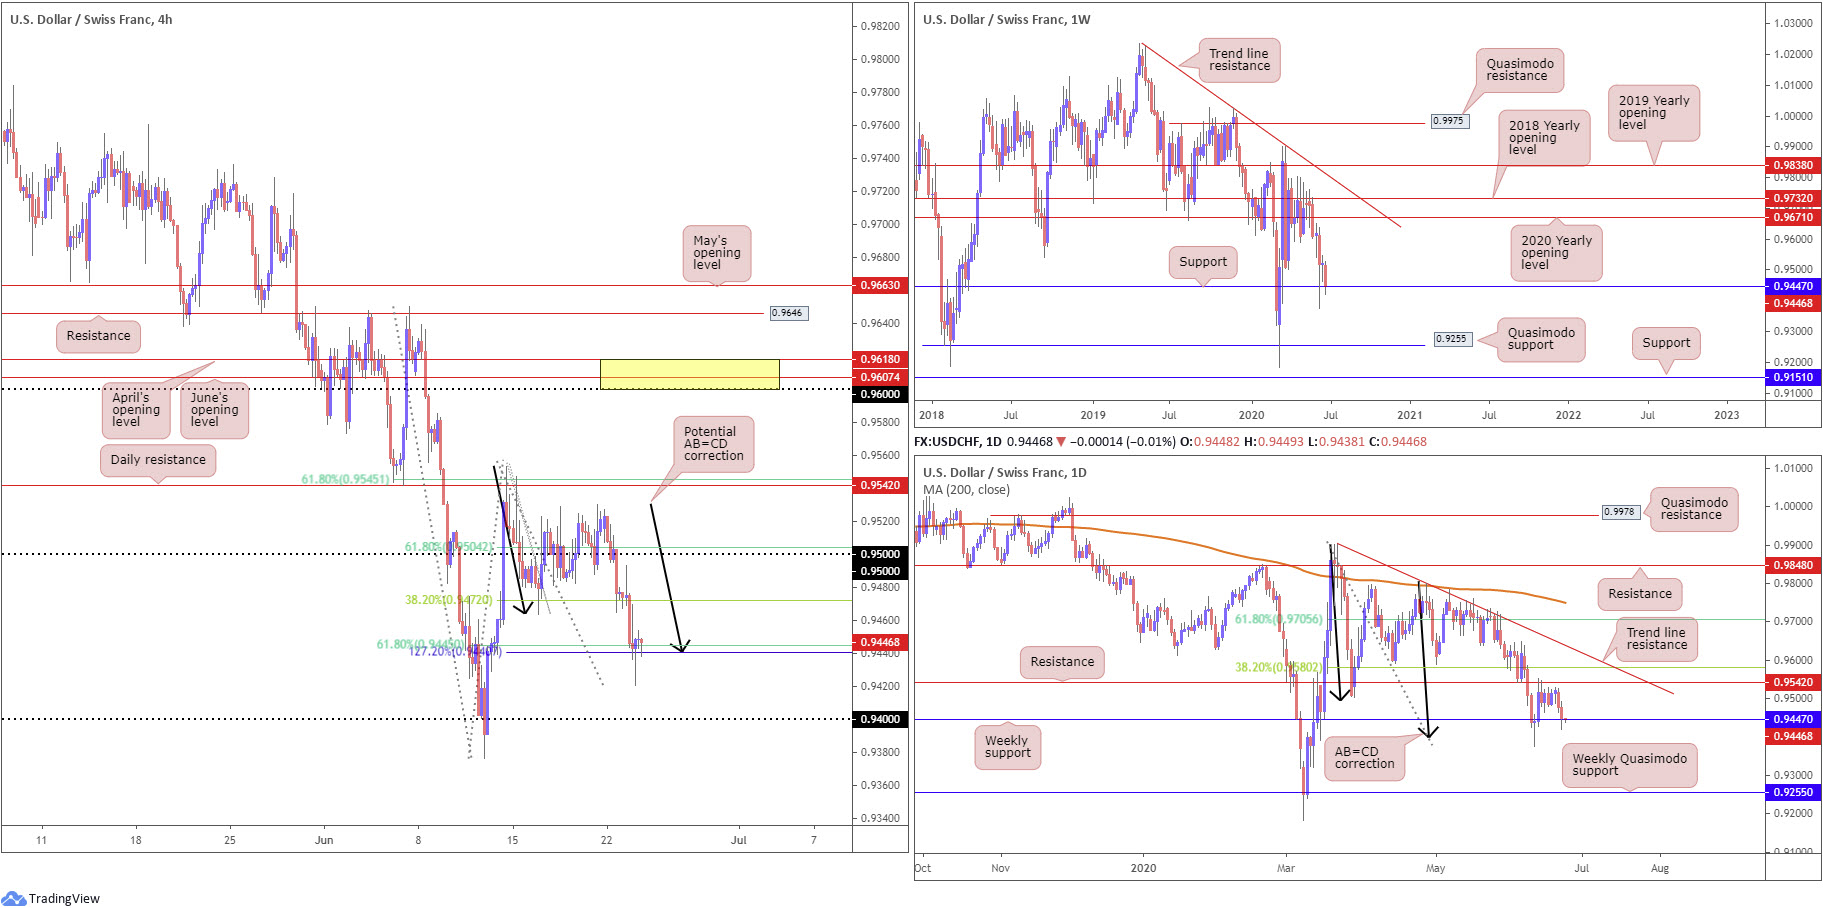
Additional USD softness observed USD/CHF dip to an interesting area of support Tuesday.
After brushing aside orders at 0.95 on the H4 Monday, the candles greeted 0.9440 yesterday, comprised of an AB=CD correction (black arrows) at 0.9440, a 127.2% Fibonacci extension point also at 0.9440 and a 61.8% Fibonacci retracement ratio at 0.9445. Joining closely with our H4 AB=CD construction is weekly support coming in at 0.9447.
Areas of consideration:
Similar to Tuesday’s outlook –
In view of weekly support bolstering the H4 AB=CD pattern around 0.9440, this area could be enough to spark a USD revival today. As for upside targets north of the zone, AB=CD traders will watch the 38.2% and 61.8% Fibonacci retracement ratios of legs A-D at 0.9472 and 0.9504, respectively (common targets out of AB=CD patterns).
Dow Jones Industrial Average:
Major US benchmarks finished higher Tuesday.
The Dow Jones Industrial Average rose 131.14 points, or 0.50%; the S&P 500 added 13.43 points, or 0.43%, and the tech-heavy Nasdaq 100 concluded higher by 79.49 points, or 0.78%.
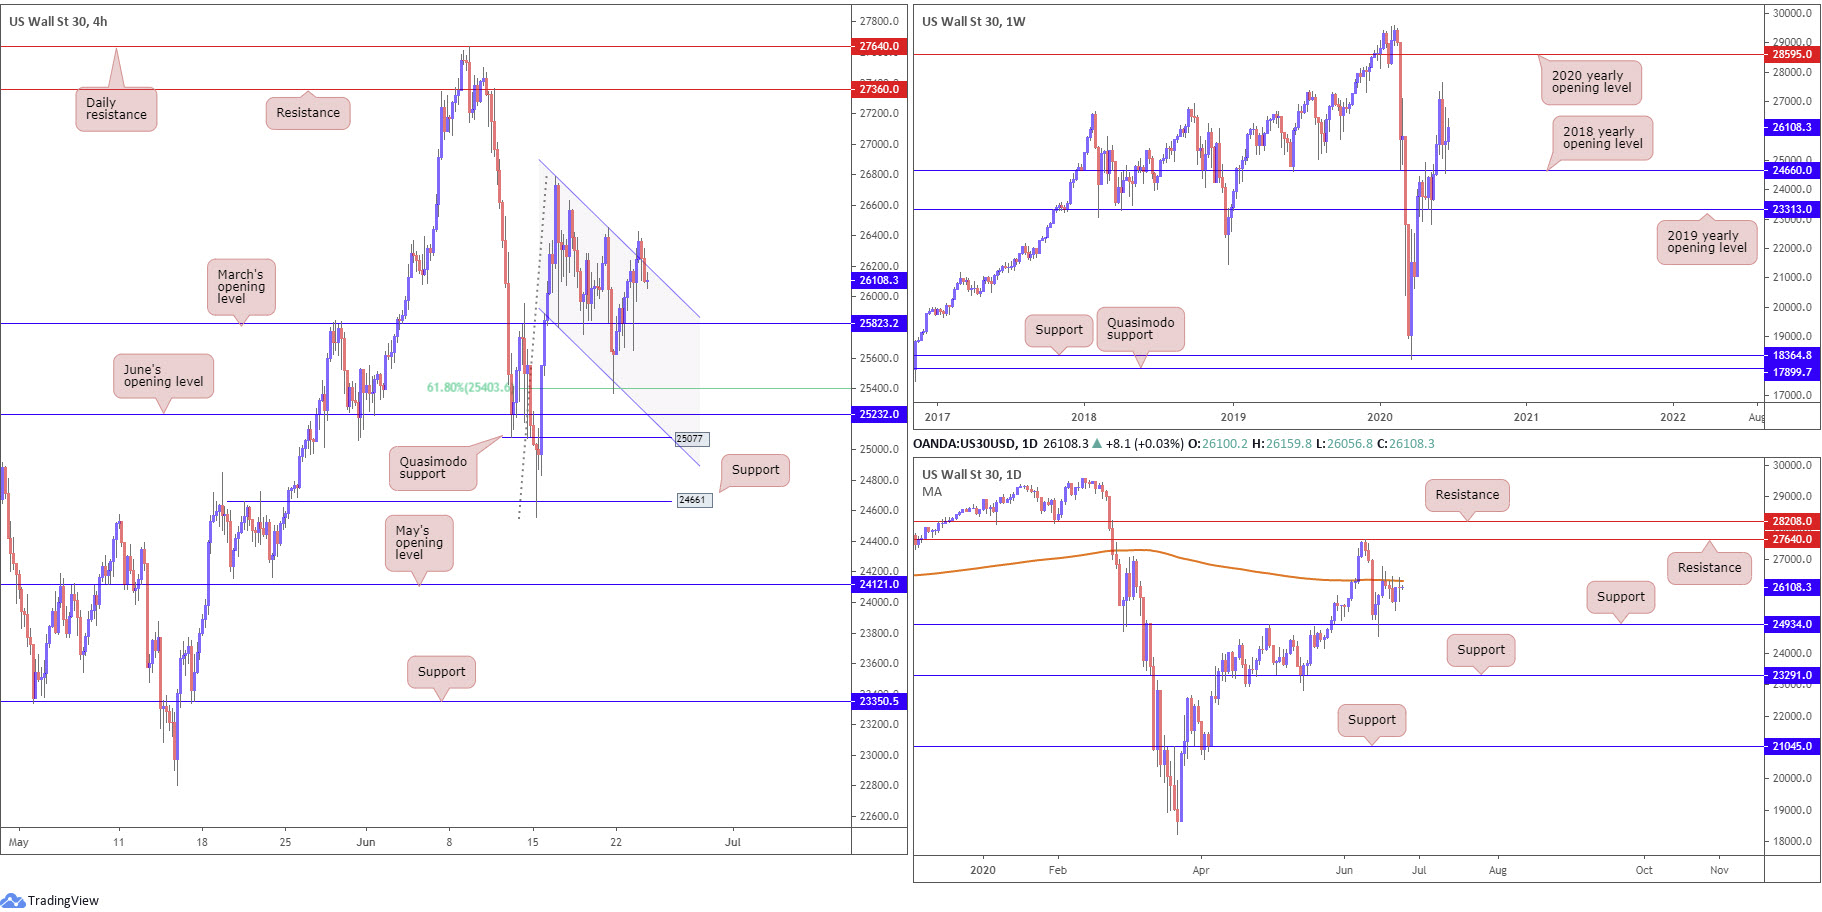
From a technical standpoint, the 2018 yearly opening level at 24660 elbowed its way into the spotlight on the weekly timeframe last week. Continued bidding will move the 27638 high into view, followed by the 2020 yearly opening level at 28595. Below 24660, however, traders’ crosshairs may be fixed on the 2019 yearly opening level at 23313.
Since June 16, daily price has been languishing under the 200-day SMA (orange – 26315). Engulfing here points the spotlight at resistance coming in from 27640.
A closer reading of price action on the H4 timeframe reveals we recently penetrated channel resistance, extended from the high 26787, following a retest at March’s opening level from 25823. As you can see, though, price has been unable to sustain gains north of the channel.
Areas of consideration:
The fakeout through H4 channel resistance was likely enough to trip stops. Given we also continue to fade the 200-day SMA, this could be a signal we’re heading back to March’s opening level at 25823, perhaps unlocking the door for bearish scenarios.
In terms of buying, based on the weekly timeframe, traders will likely want to see the 200-day SMA taken before committing.
XAU/USD (GOLD):
For traders who read Tuesday’s technical briefing you may recall the following (italics):
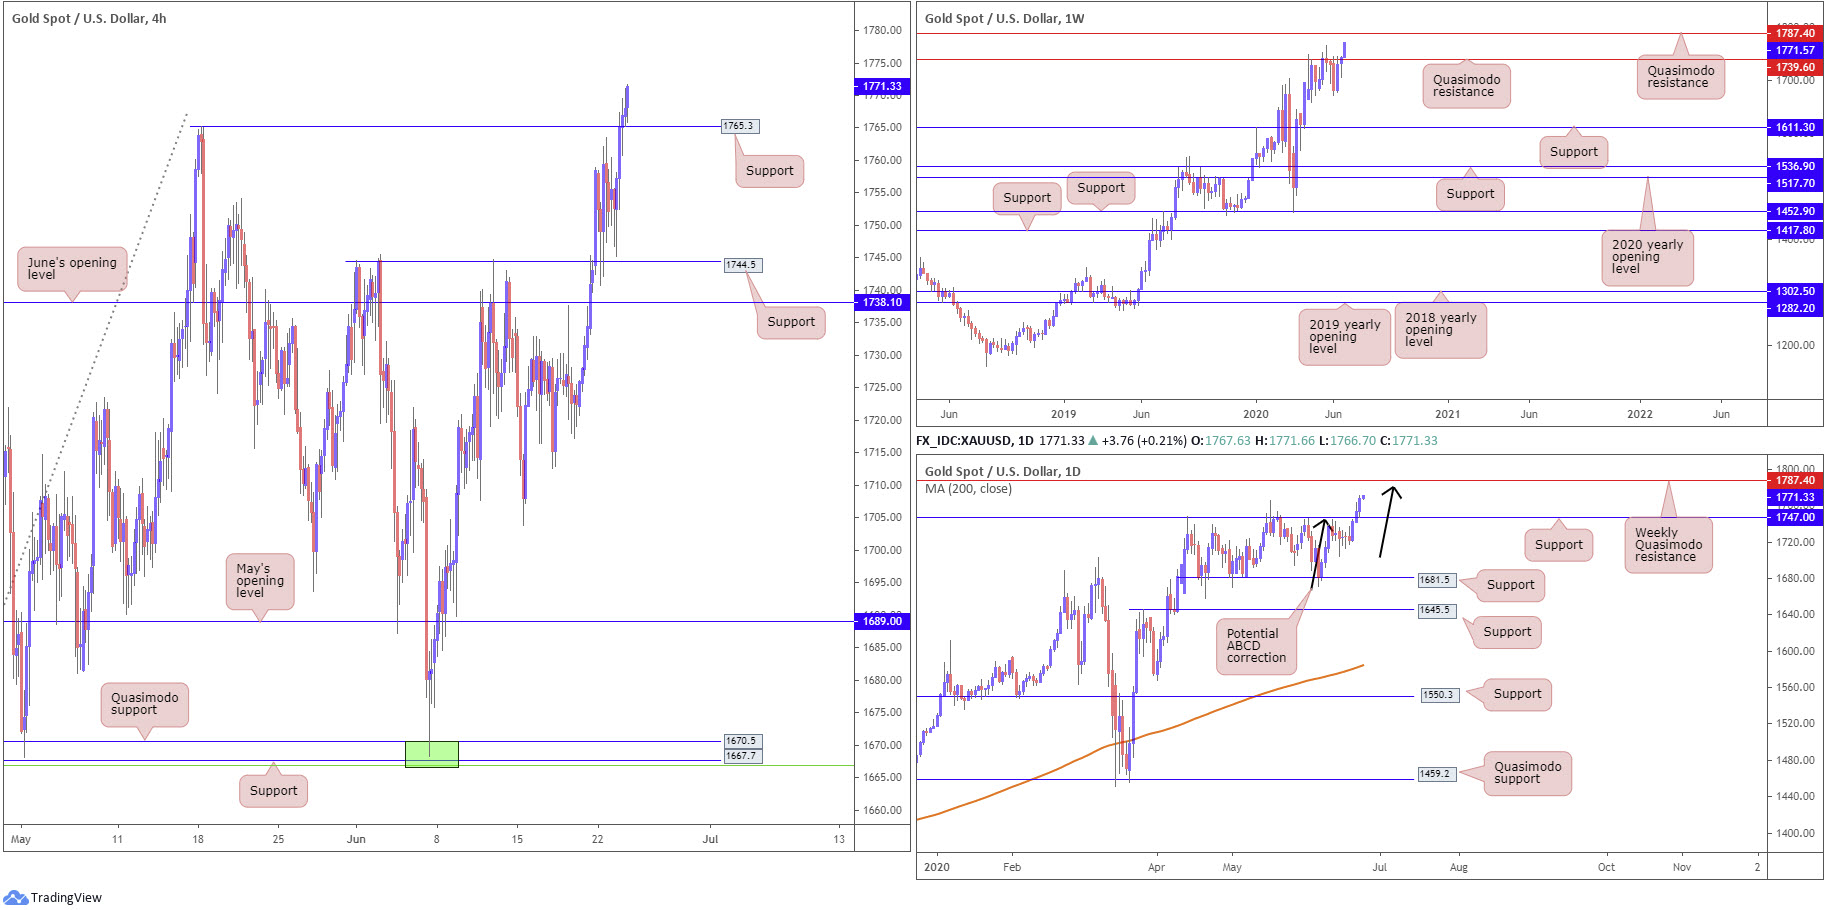
With weekly buyers making an effort to conquer Quasimodo resistance at 1739.6, bullish scenarios off H4 support at 1744.5 and daily support from 1747.0 could be an option today. Upside targets from this point rest at the daily ABCD correction (black arrows) from 1780.0, closely followed by weekly Quasimodo resistance at 1787.4.
Heavy selling surrounding the US dollar Tuesday elevated bullion to fresh multi-year highs at 1771.3. H4 price, as evident from the chart, respected support at 1744.5, with daily price now closing in on the ABCD correction (black arrows) from 1780.0. Also note we recently took out resistance (H4) at 1765.3 (May 18 high).
Areas of consideration:
Traders long from H4 support will have likely already reduced risk to breakeven and maybe even banked a portion of their position. As a reminder, higher-timeframe upside targets fall in at 1780.0 and 1787.4.
Additional buying opportunities may materialise today should a retest at 1765.3 come to fruition. Conservative traders, however, will likely be looking for the retest to form in the shape of a H4 bullish candlestick formation before pulling the trigger.
The accuracy, completeness and timeliness of the information contained on this site cannot be guaranteed. IC Markets does not warranty, guarantee or make any representations, or assume any liability regarding financial results based on the use of the information in the site.
News, views, opinions, recommendations and other information obtained from sources outside of www.icmarkets.com.au, used in this site are believed to be reliable, but we cannot guarantee their accuracy or completeness. All such information is subject to change at any time without notice. IC Markets assumes no responsibility for the content of any linked site.
The fact that such links may exist does not indicate approval or endorsement of any material contained on any linked site. IC Markets is not liable for any harm caused by the transmission, through accessing the services or information on this site, of a computer virus, or other computer code or programming device that might be used to access, delete, damage, disable, disrupt or otherwise impede in any manner, the operation of the site or of any user’s software, hardware, data or property.


