
EUR/USD:
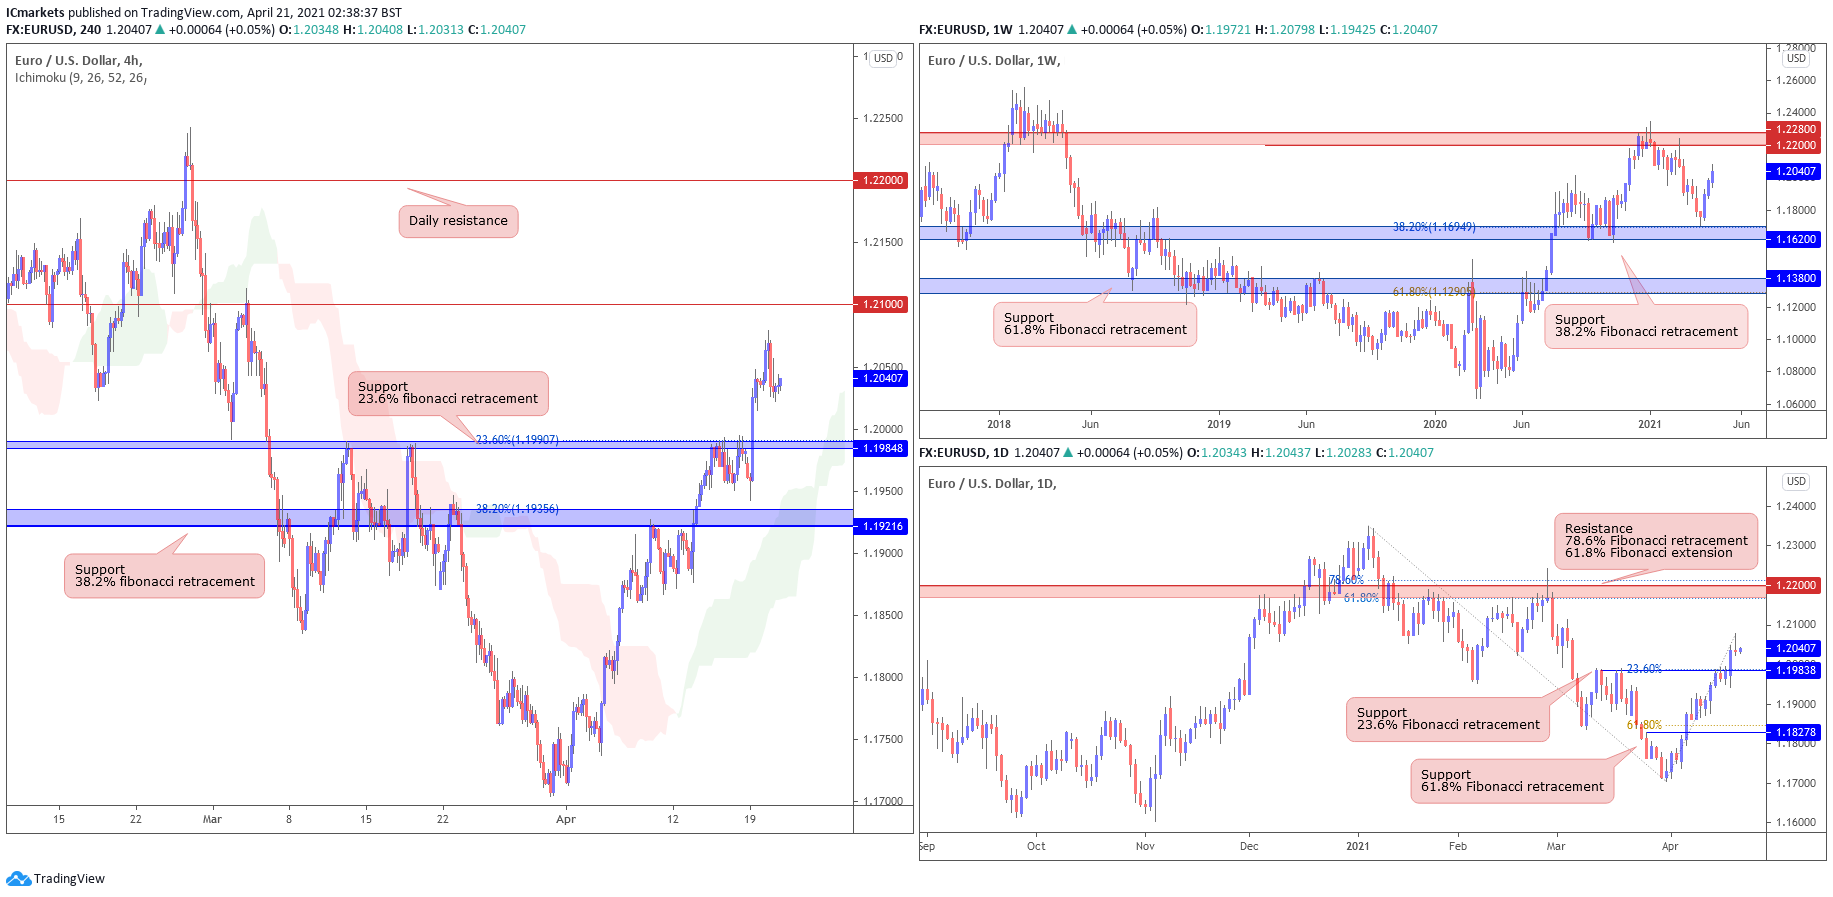
Looking at the weekly chart, we can see that prices are seeing further upside before it reaches our resistance area at 1.22000 – 1.22800. On the daily chart, it echoes the same bullish view as well, where prices are facing bullish pressure from our support level at 1.19838, in line with the 23.6% fibonacci retracement where we might see more upside above this level.
On the H4 timeframe, prices are facing bullish pressure from our support at 1.19848, in line with the graphical area found on the daily time frame. We could see a limited upside above this level with 1.21000 resistance as our first target.
Areas of consideration:
- 21000 resistance area found on H4 time frame
- 19848 support area found on H4 time frame
GBP/USD:
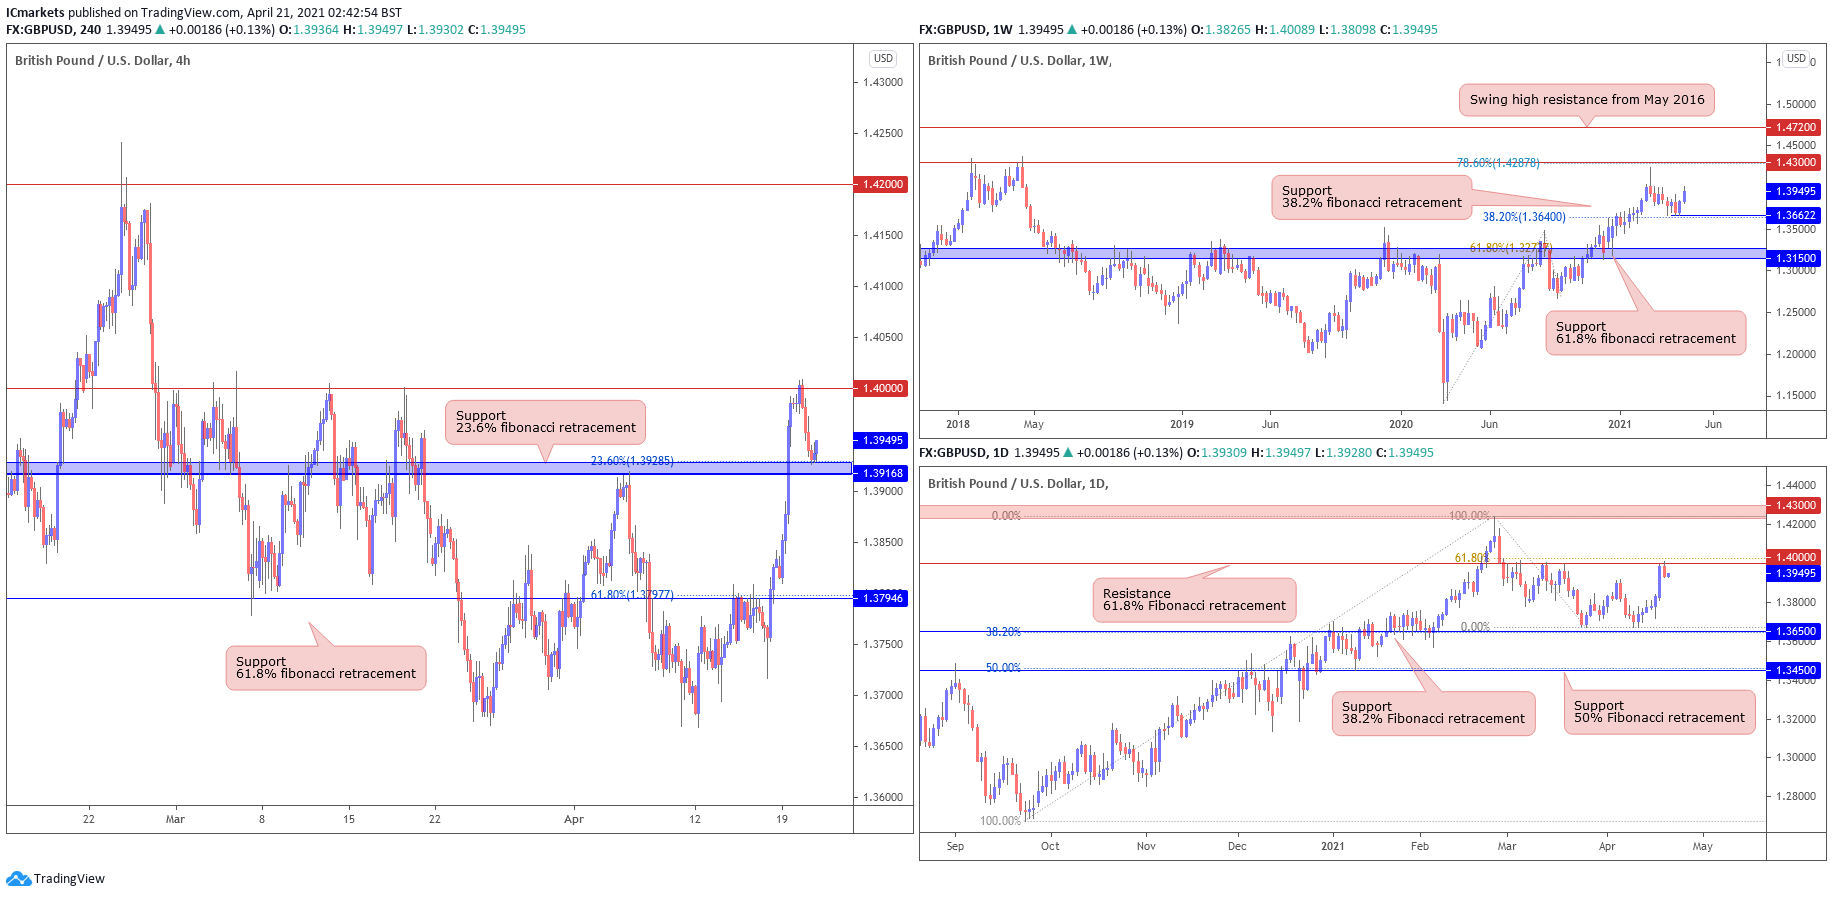
Looking at the weekly chart, we can see that prices are facing bullish pressure from our 38.2% fibonacci retracement and could see a further upside before it reaches our first resistance target at 1.43000. On the daily time frame, prices are testing a key resistance level at 1.4000 where we could see a reversal here.
On the H4 timeframe, prices are trading between our support and resistance levels at 1.39168 and 1.4000 respectively. A break above our resistance level at 1.4000 could see a further upside to our next resistance level at 1.42000.
Areas of consideration:
- 4000 resistance area found on H4 time frame
- 39168 support area found on H4 timeframe
AUD/USD:
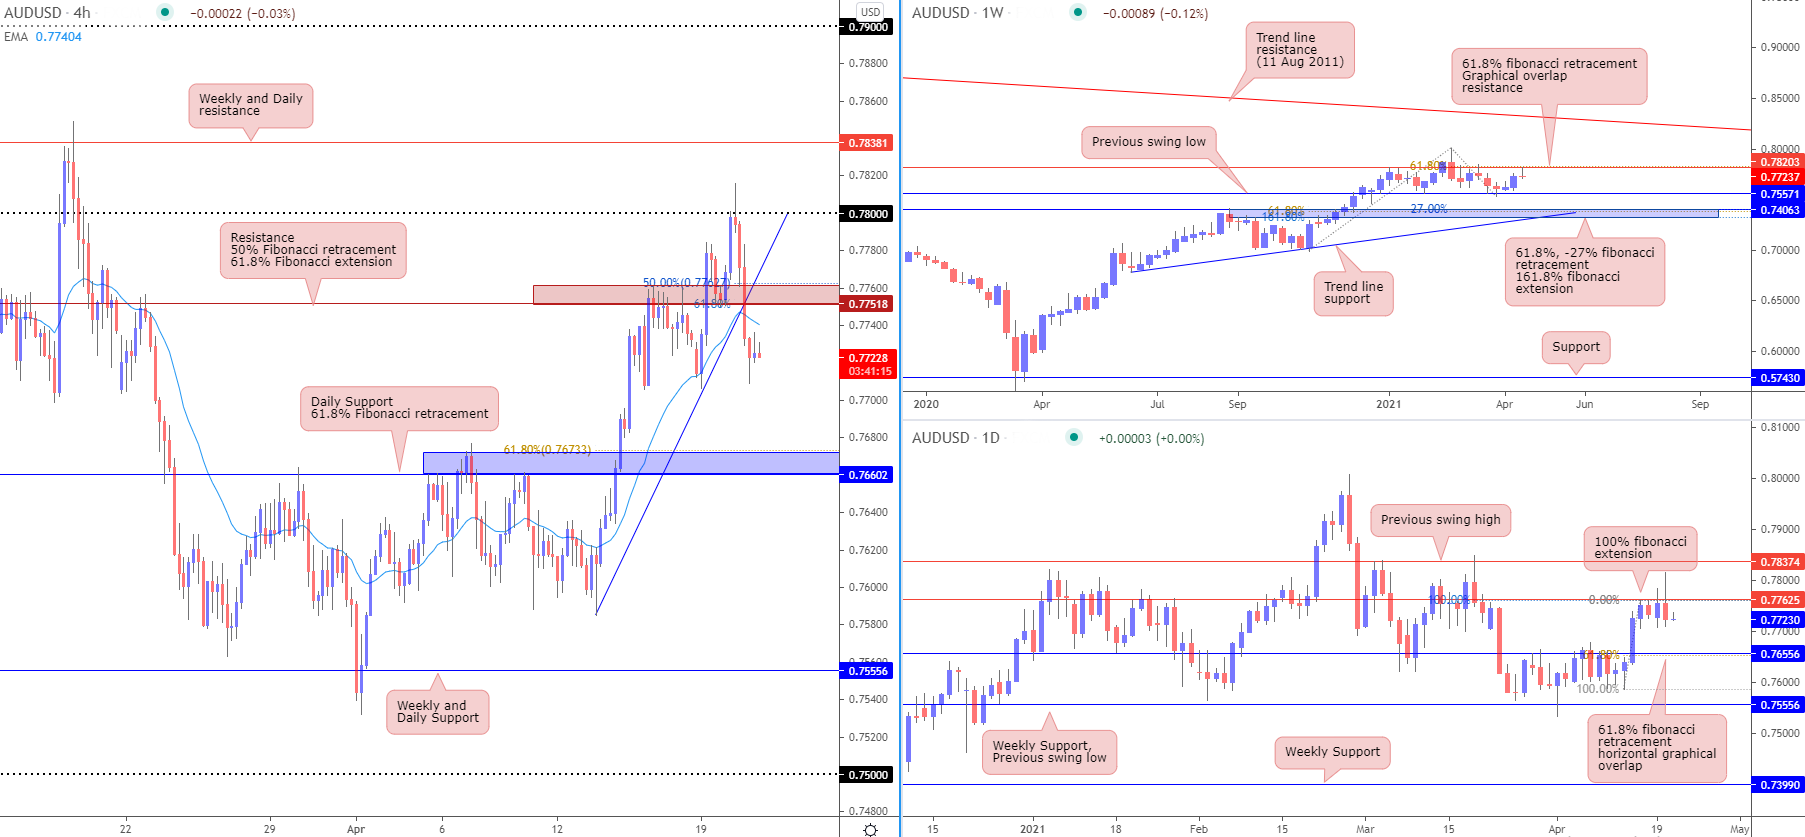
From the Weekly timeframe, prices are facing resistance from graphical overlap resistance in line with 61.8% Fibonacci retracement. Prices might push down towards previous swing low. Prices are also facing resistance from descending trendline resistance. From the daily timeframe, prices are facing resistance from swing high resistance which is in line with 100% Fibonacci extension. Prices might push down towards 0.76556 in line with 61.89% Fibonacci retracement and horizontal graphical overlap.
On the H4 timeframe, prices have broken through the ascending trendline support and are facing resistance from horizontal pullback resistance in line with 50% Fibonacci retracement and 61.8% Fibonacci extension. Prices might push down towards pullback support which is in line with 61.8% FIbonacci retracement level. EMA is also above prices, showing bearish pressure for prices.
Areas of consideration:
- H4 prices push past daily resistance turned support and might push higher towards weekly and daily resistance
- Daily time frame broke past horizontal swing high resistance in line with 100% Fibonacci extension
- Weekly time frame shows bullish momentum.
USD/JPY
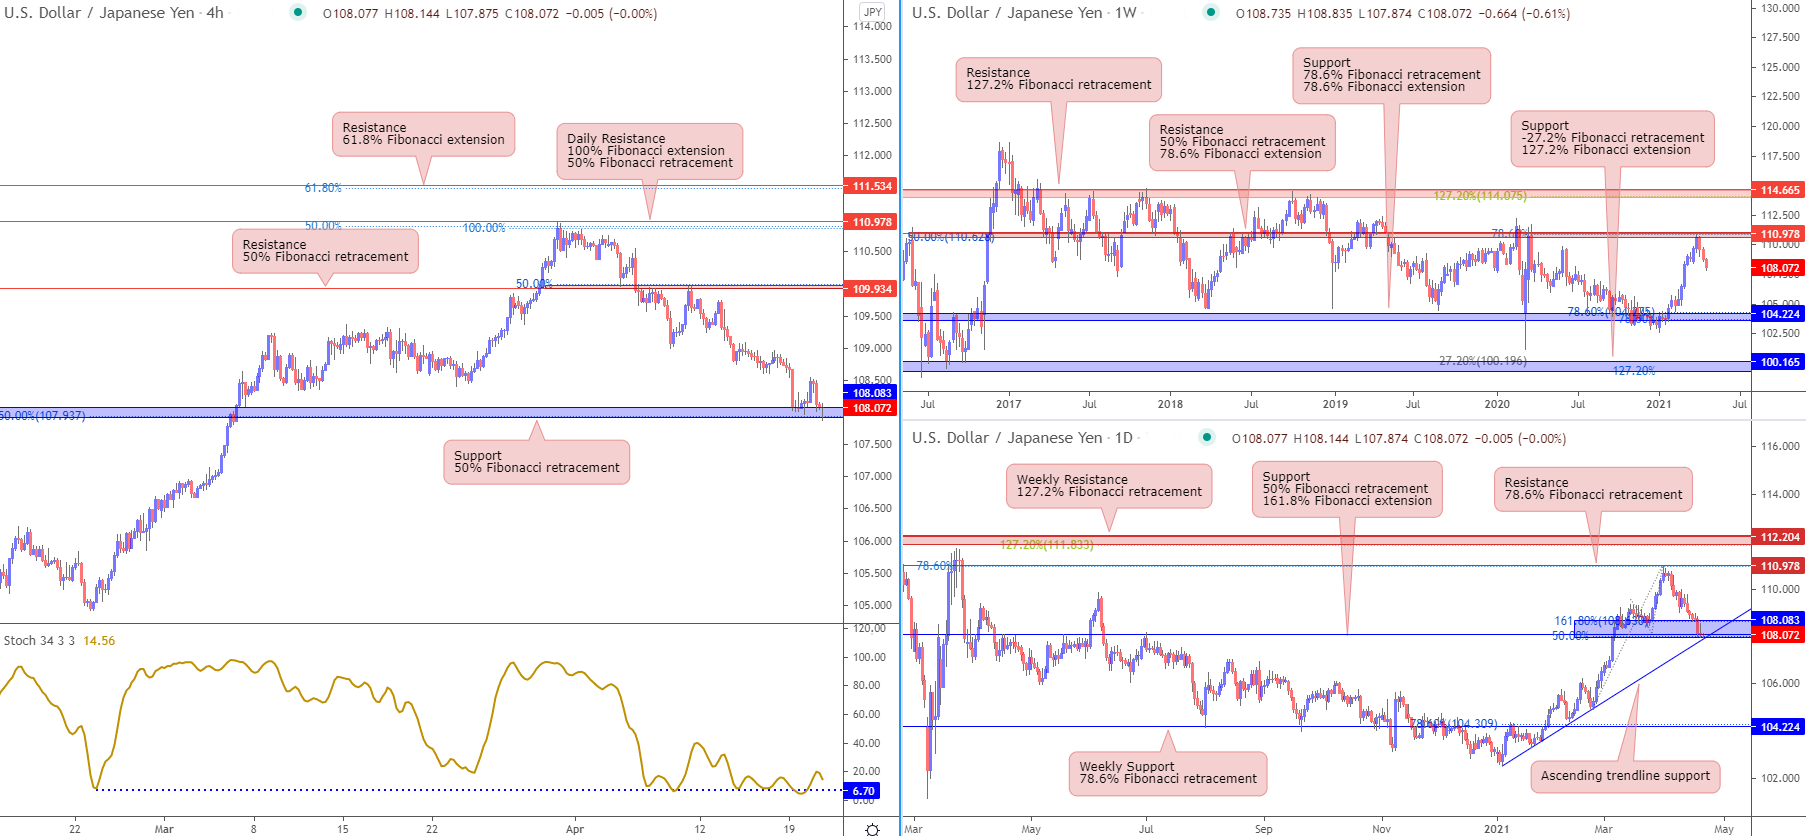
From the weekly timeframe, prices are facing resistance from horizontal swing high resistance which coincides with 50% Fibonacci retracement and 78.6% Fibonacci extension, taking support from 104.224 level which is in line with 78.6% FIbonacci retracement and 78.6% FIbonacci extension. On the daily time frame, prices are touching the ascending trendline support, potential for bounce towards swing high resistance which is in line with 78.6% Fibonacci retracement
On the H4 timeframe, prices are touching horizontal support which is in line with 50% Fibonacci retracement. Prices might bounce from this level towards swing high resistance which is in line with 50% Fibonacci retracement. Stochastics is also approaching 11.25 support level, potential for bounce.
Areas of consideration:
- On the H4, prices might push up to horizontal swing high resistance of 109.934
- Price facing resistance from 110.978 on weekly
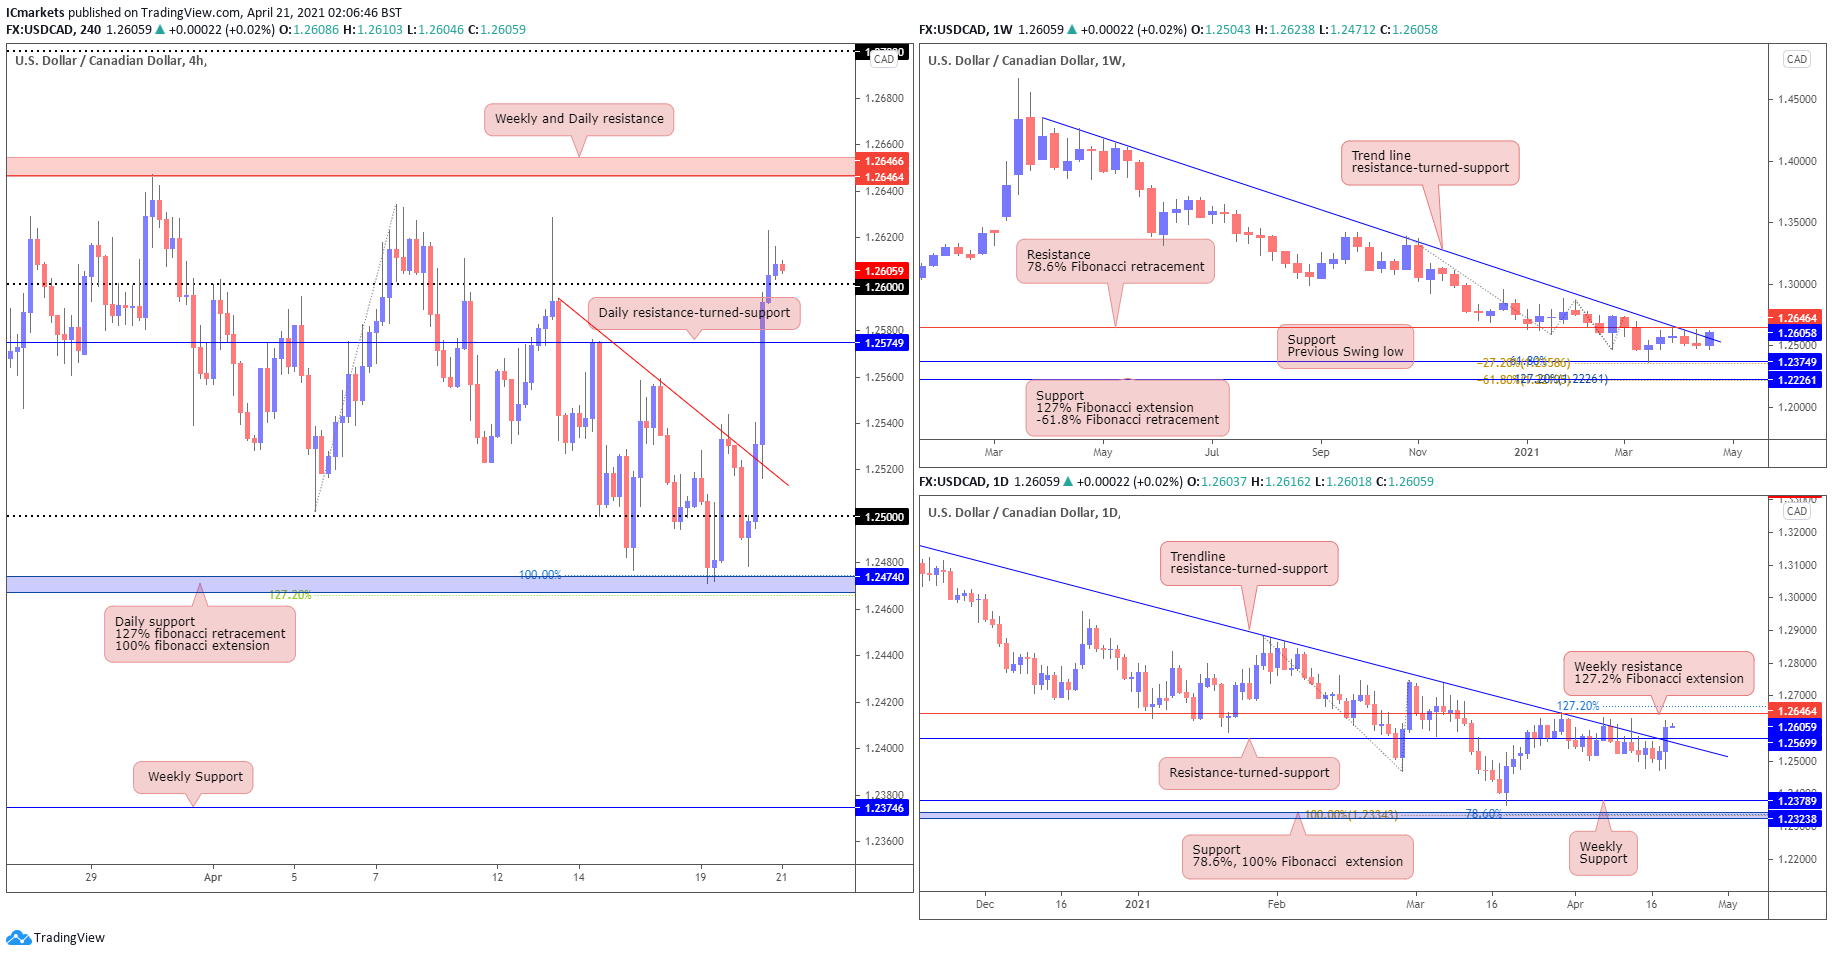
USD/CAD:
The weekly chart shows price making a possible break above the descending trendline resistance, and is now approaching the weekly 1.26464 resistance. The daily chart shows that price has indeed made a clear break and close above the descending trendline resistance-turned-support. Should price hold above the descending trendline, we could see a further push up from here.
The H4 chart shows a break above a descending trendline resistance-turned support, as well as a break above the daily resistance-turned-support level at 1.25749. In this scenario, we could potentially see price push higher to test the weekly 1.26464 resistance level. Should price make a stronger pullback, we could see it retest the 1.25749 resistance-turned-support and the descending trendline resistance-turned-support.
Areas of consideration:
- The weekly and daily time frame shows a possible break and close above the descending trendline resistance-turned-support.
- On H4, price may push higher to test the weekly 1.26464 resistance level.
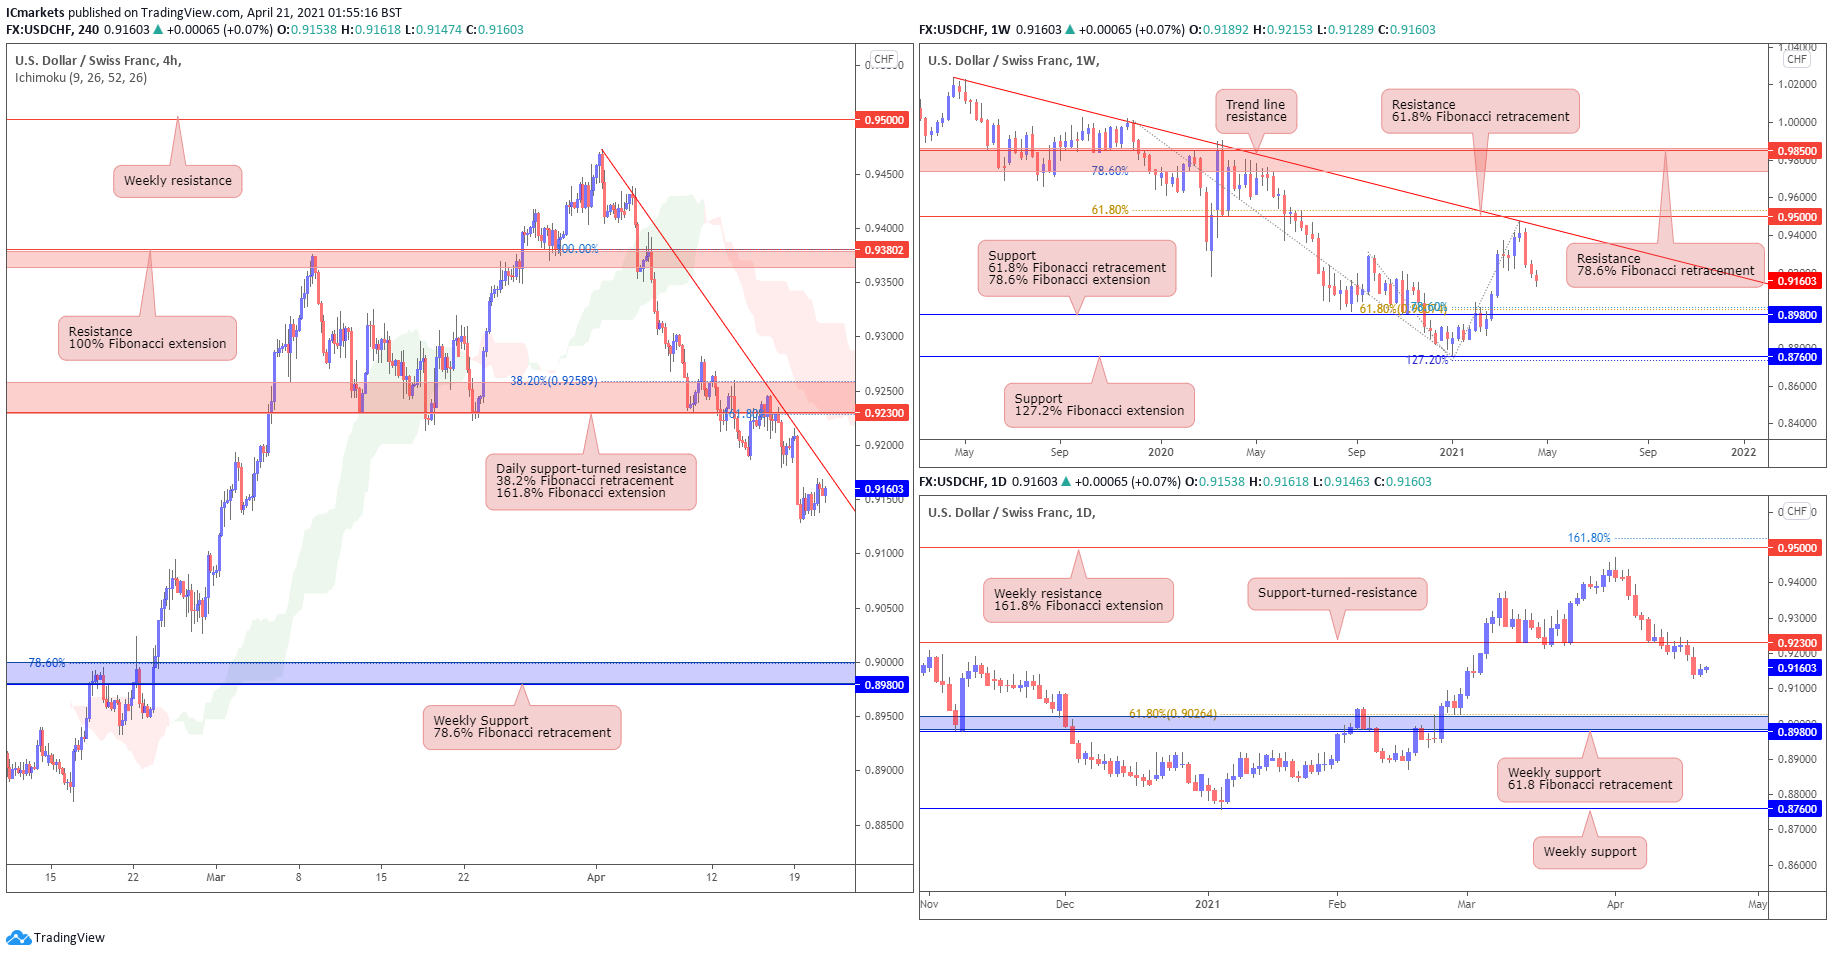
USD/CHF:
USD/CHF has seen a reversal at the descending trendline resistance and is now holding below the weekly 0.95000 resistance level which is in line with our 61.8% Fibonacci retracement. The daily chart shows that price has broken below the key daily 0.92300 support-turned-resistance, re-tested and is now pushing lower. We could potentially see further downside from here towards the next daily 0.89800 support level.
On the H4 chart, we can see that price is now holding below both the descending trendline resistance and the Ichimoku cloud, showing bearish pressure in line with our bearish bias. Price is also now holding below the daily 0.92300 support-turned-resistance area, which is in line with our 38.2% Fibonacci retracement and 161.8% Fibonacci extension. We could potentially see a reversal at the descending trendline resistance and further downside from here towards our weekly 0.89800 support, in line with our 78.6% Fibonacci retracement. Otherwise, should price make a stronger pullback, we could see it pull back to retest the 0.92300 support-turned-resistance.
Areas of consideration:
- Price is facing bearish pressure as it holds below the descending trendline resistance and Ichimoku cloud.
- We could potentially see price reversing at the descending trendline resistance and swing towards the next 0.89800 weekly support.
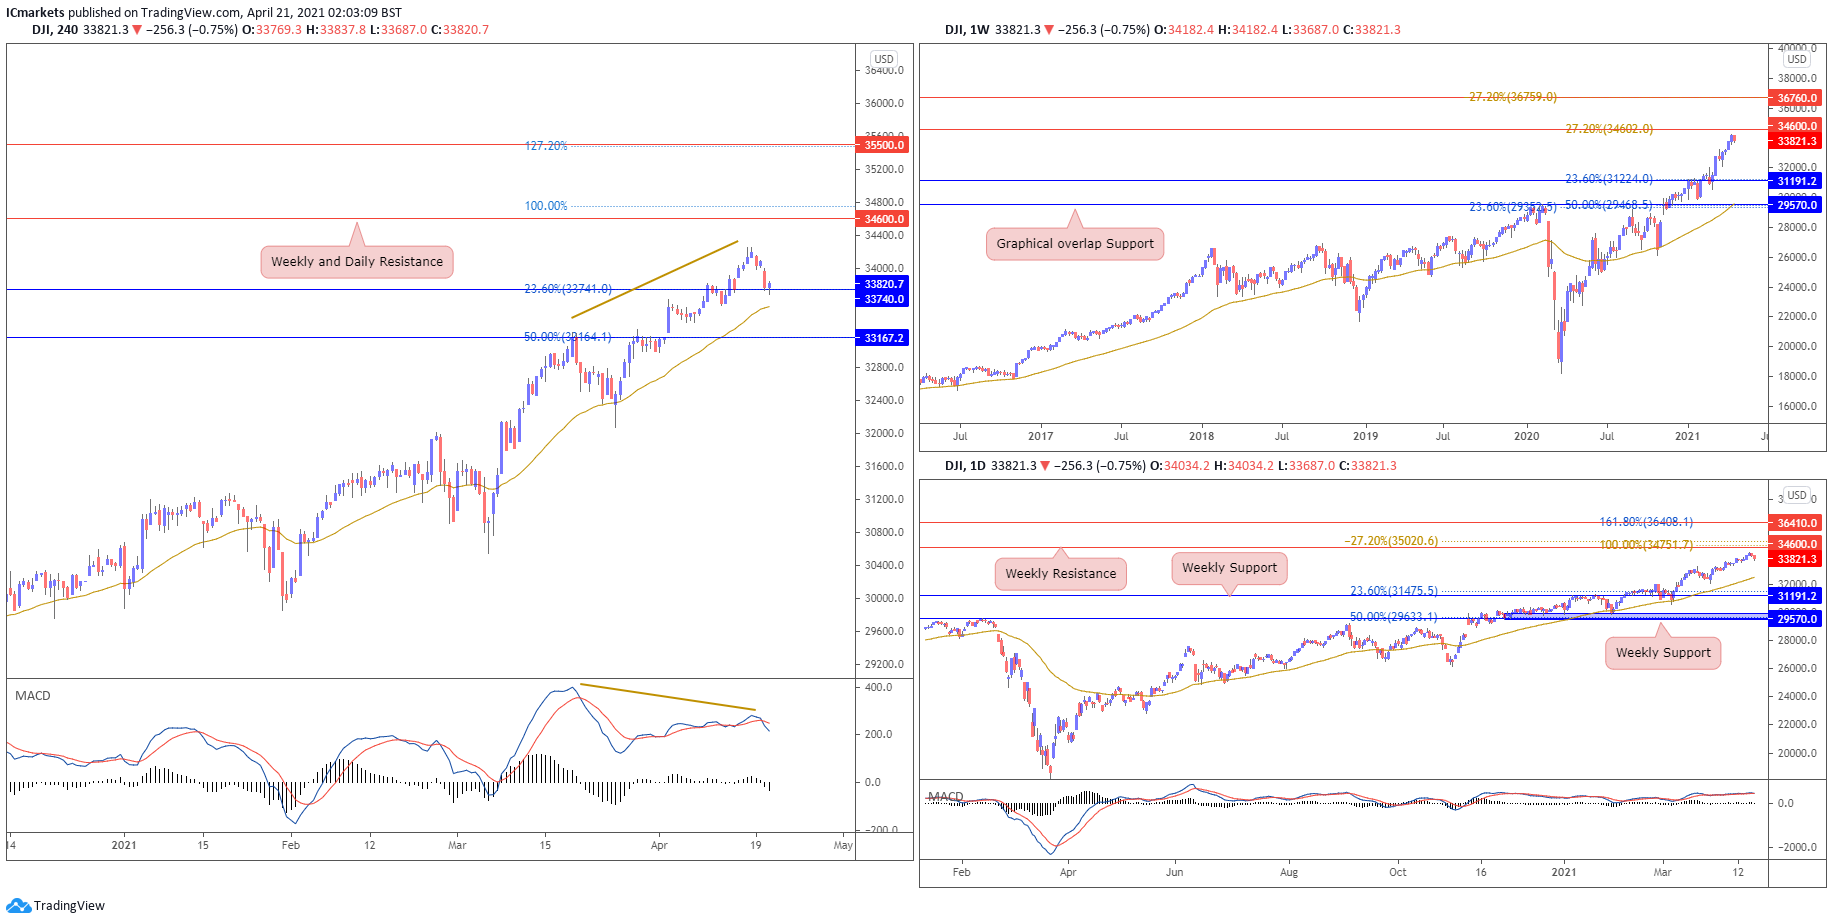
Dow Jones Industrial Average:
On the weekly chart, price is coming close to key 34600 resistance. A weekly close below 34600 resistance could see a short term pullback. Otherwise, a break and a close above 34600 could see price push higher. On the Daily, we see price drifting higher, with technical indicators continue to show room for further bullish upside. Buyers could possibly look to add to their longs on any price pullbacks with possible target at 34600 weekly resistance. However this upside towards our weekly resistance still remains limited.
On the H4, price pulled back overnight and is testing 33740 support. Whilst technical indicators are still showing room for further bullish upside, we note that there is a divergence forming. As such, we see a low probability bullish scenario where 33740 support could be the level where buyers enter with their longs to push price towards potential target at 34600. Otherwise, failure to hold above 33740 could see price drop lower towards 33167.
Areas of consideration:
- Bearish divergence forming on H4
- Watch H4 support at 33740.
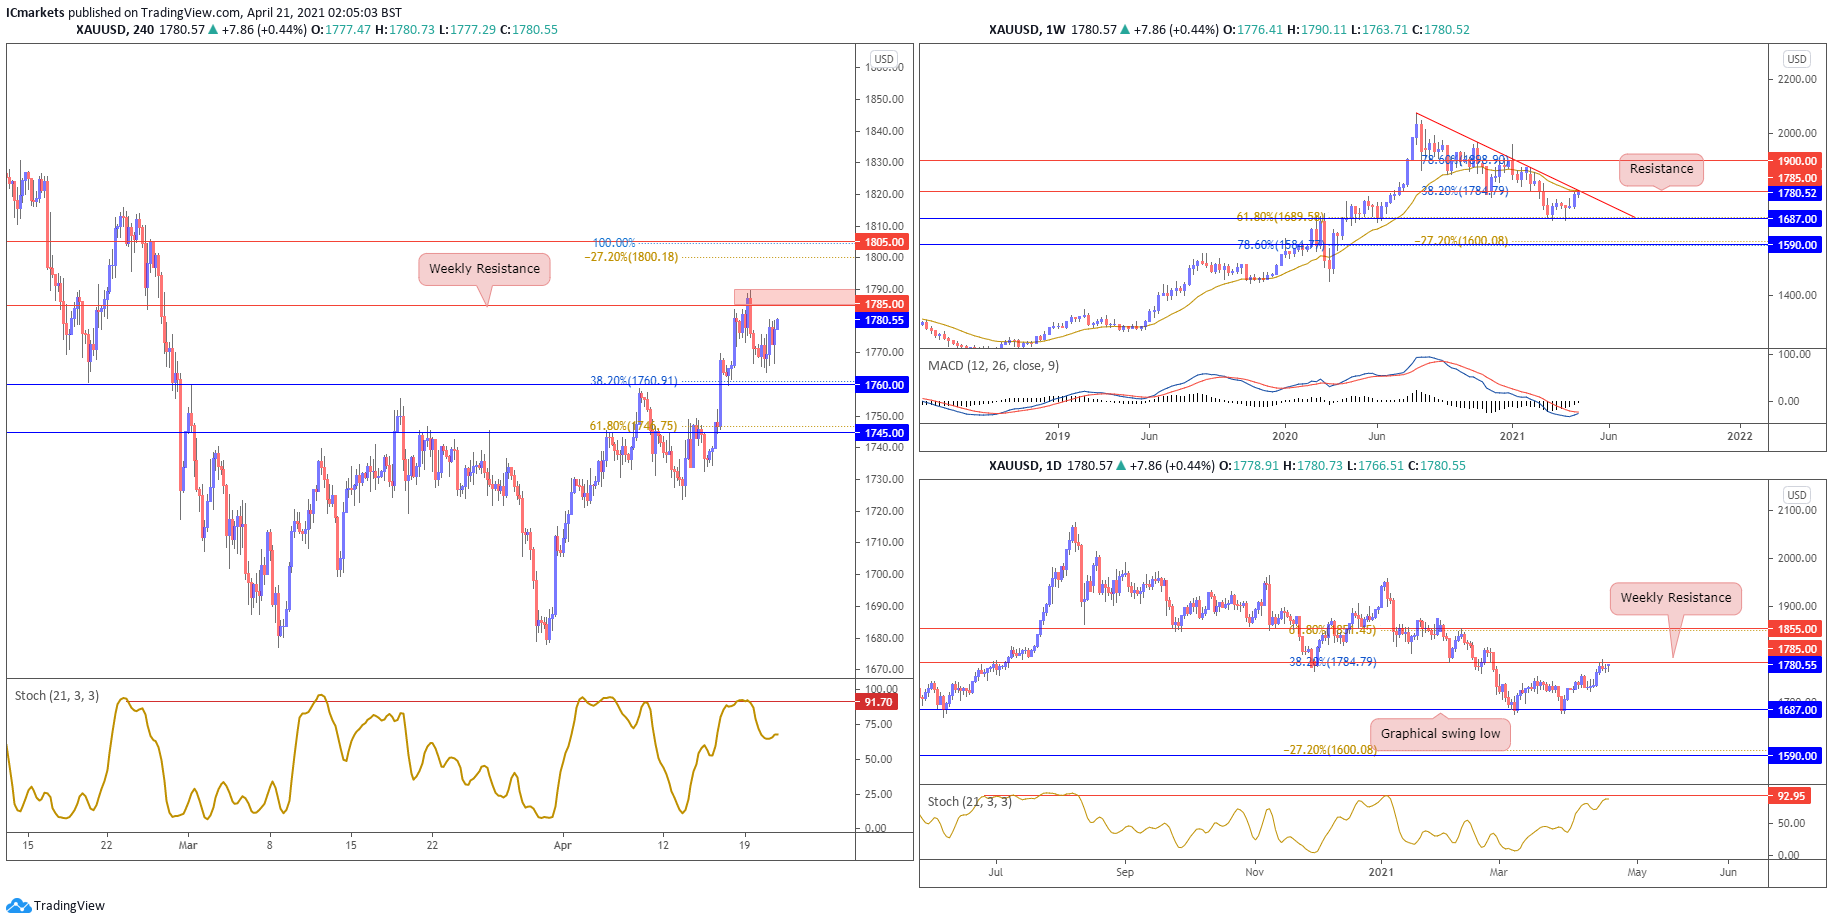
XAU/USD (GOLD):
On the weekly timeframe, gold is still testing and holding below descending trendline resistance and long term moving average resistance at 1785. A weekly close below this resistance could see price pull back lower towards 1687 support. On the Daily timeframe, price is also testing weekly resistance and graphical overlap resistance at 1785. A short term drop towards graphical swing low at 1687 could be likely. Otherwise, failure to hold below 1785 resistance could see price swing higher towards 1855 resistance next.
On the H4, pushed higher, coming close to weekly resistance at 1785. With stochastics testing resistance where price pulled back in the past, we see a medium probability bearish scenario where sellers may look to add to their shorts below 1785 resistance with a possible downside target at 1760. Otherwise, failure to hold below 1785 could see price swing the other way towards 1805 resistance.
Areas of consideration:
- 1785 resistance key level to watch out for
The accuracy, completeness and timeliness of the information contained on this site cannot be guaranteed. IC Markets does not warranty, guarantee or make any representations, or assume any liability regarding financial results based on the use of the information in the site.
News, views, opinions, recommendations and other information obtained from sources outside of www.icmarkets.com.au, used in this site are believed to be reliable, but we cannot guarantee their accuracy or completeness. All such information is subject to change at any time without notice. IC Markets assumes no responsibility for the content of any linked site.
The fact that such links may exist does not indicate approval or endorsement of any material contained on any linked site. IC Markets is not liable for any harm caused by the transmission, through accessing the services or information on this site, of a computer virus, or other computer code or programming device that might be used to access, delete, damage, disable, disrupt or otherwise impede in any manner, the operation of the site or of any user’s software, hardware, data or property.


