
EUR/USD:
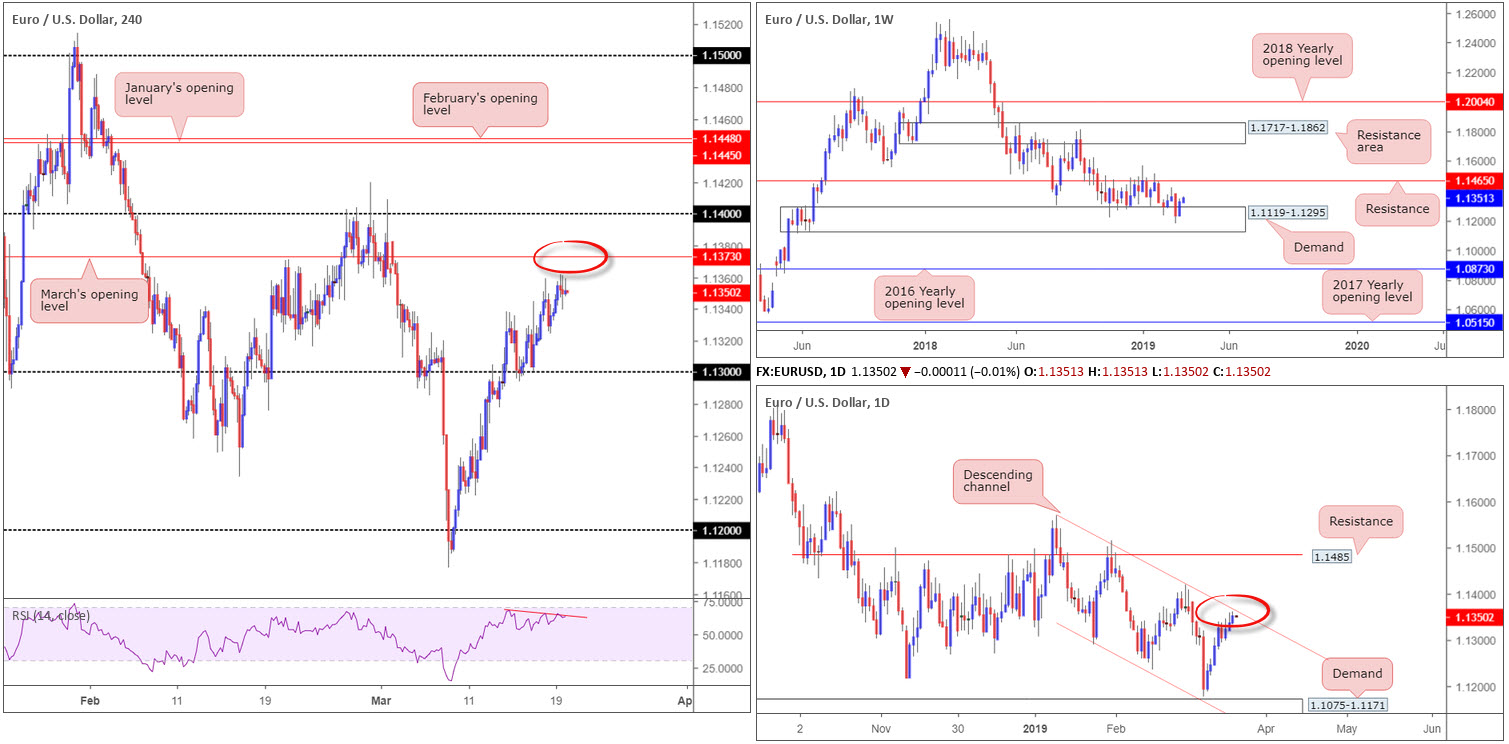
Underpinned by a softer greenback, the EUR/USD extended gains for a third consecutive day Tuesday, up 0.13%. The buck is seemingly weaker on fears of a dovish Fed, with the central bank widely expected to keep policy unchanged today. Following a dovish U-turn at the beginning of the year, the Fed has put rate hikes on pause.
Establishing a fresh weekly high at 1.1361, the pair is seen within touching distance of daily channel resistance etched from the high 1.1569. Whether or not this barrier holds (in motion since the beginning of the year), though, is difficult to judge. This is due to the market trading from notable weekly demand coming in at 1.1119-1.1295, with scope to advance as far north as resistance at 1.1465.
A closer reading on the H4 timeframe has March’s opening level at 1.1373 as its next upside target, closely followed by 1.14. Beneath current price, as highlighted in Tuesday’s briefing, 1.13 is visible, which offered critical intraday support last week. It might also be of interest to some traders to note the RSI indicator is still chalking up a mild divergence reading (red line) just south of its overbought value.
Areas of consideration:
March’s opening level mentioned above on the H4 timeframe at 1.1373 is likely of interest to many traders this morning. Not only does it boast reasonably attractive history as a local support and resistance, it aligns closely with the current daily channel resistance. Despite this confluence, do remain cognizant of where we’re coming from on the weekly timeframe (demand). For that reason, waiting for a H4 bearish candlestick signal to form off 1.1373 before pulling the trigger is recommended. Not only will this pattern identify seller intent, it’ll also provide entry/risk levels to work with.
Today’s data points: FOMC Economic Projections; FOMC Statement; Federal Funds Rate Decision; FOMC Press Conference.
GBP/USD:
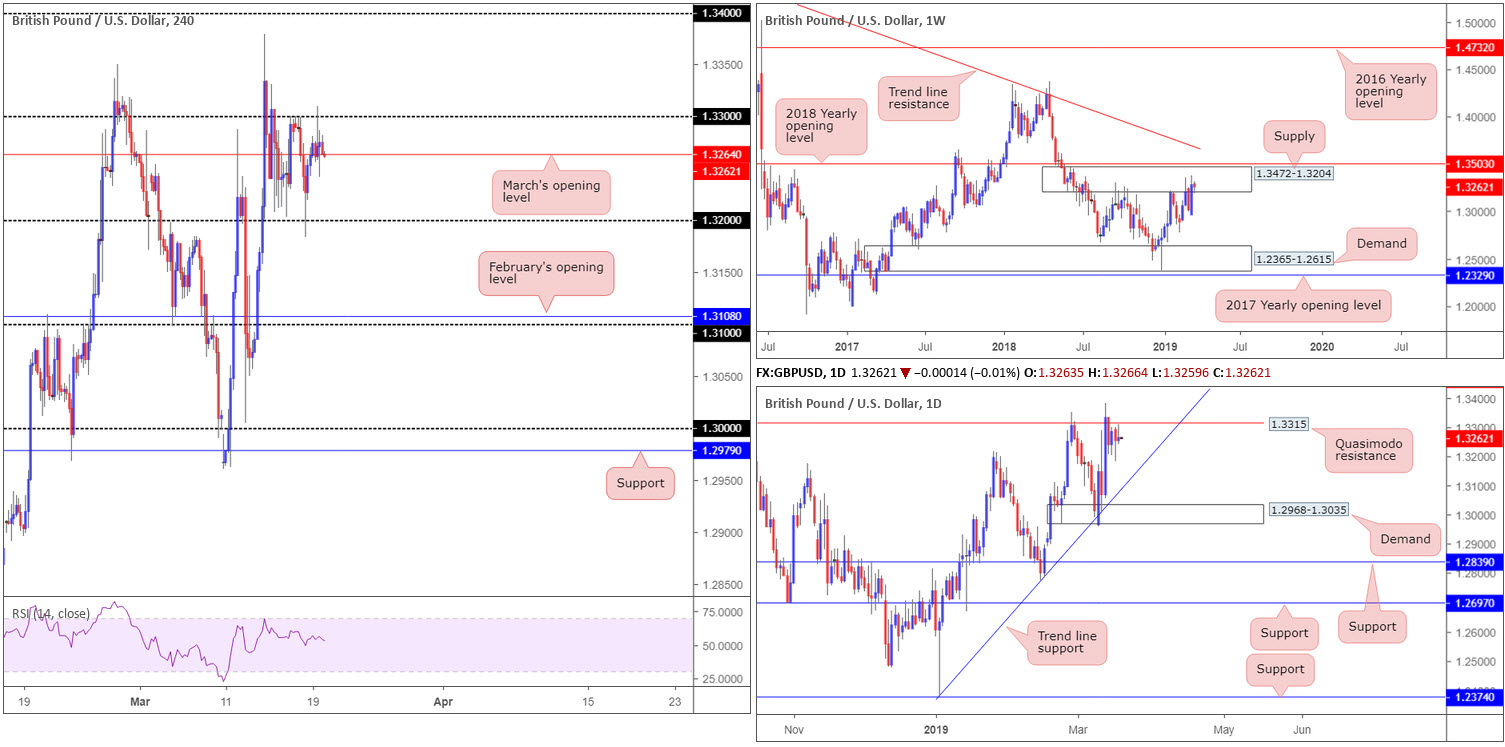
Latest employment data out of the UK Tuesday was largely upbeat. Unemployment ticked lower to 3.9%, better than the 4.0% expected, while wages rose more than anticipated, up by 3.4% in January. The claimant count change for February was the only disappointing figure, up 27.0K vs. expected 13.1k. In addition to this, sterling was again subject to Brexit headline risk, though remained within a relatively tight range between 1.33/1.32 visible on the H4 timeframe (note March’s opening level is also seen fixed within this consolidation at 1.3264).
In the event the market strives for higher ground and conquers 1.33, the 1.3379 March 13 high is in the firing range, closely shadowed by 1.34. A move under 1.32 sports a reasonably clear run towards February’s opening level at 1.3108, trailed by 1.31.
Weekly movement is, as underlined in Monday’s briefing, seen dipping its toes back into supply coming in at 1.3472-1.3204. In view of the number of times this area has been tested since July 2018, the supply’s foundation is likely weakened, giving rise to a possible advance towards the 2018 yearly opening level at 1.3503.
The picture on the daily timeframe reveals the market is trading beneath Quasimodo resistance at 1.3315. Nearby trend line support (taken from the low 1.2373) is the next downside target from current price, whereas a decisive break above 1.3315 places resistance at 1.3465 in the spotlight (not seen on the screen).
Areas of consideration:
Buying this market, given resistances seen on both the weekly and daily timeframes, may be a chancy move.
Selling, on the other hand, is interesting. A sell from 1.33, preferably on the break of 1.3264 (March’s opening level mentioned above at 1.3264) is an option, targeting 1.32 and beyond. The more conservative route, nonetheless, is still waiting for a close beneath 1.32 to come to fruition. This, followed up by a retest (entry and stop-loss orders can be placed according to the rejecting candle’s structure), has a strong chance of reaching 1.31.
Today’s data points: UK CPI y/y; UK PPI Input m/m; RPI y/y; FOMC Economic Projections; FOMC Statement; Federal Funds Rate Decision; FOMC Press Conference.
AUD/USD:
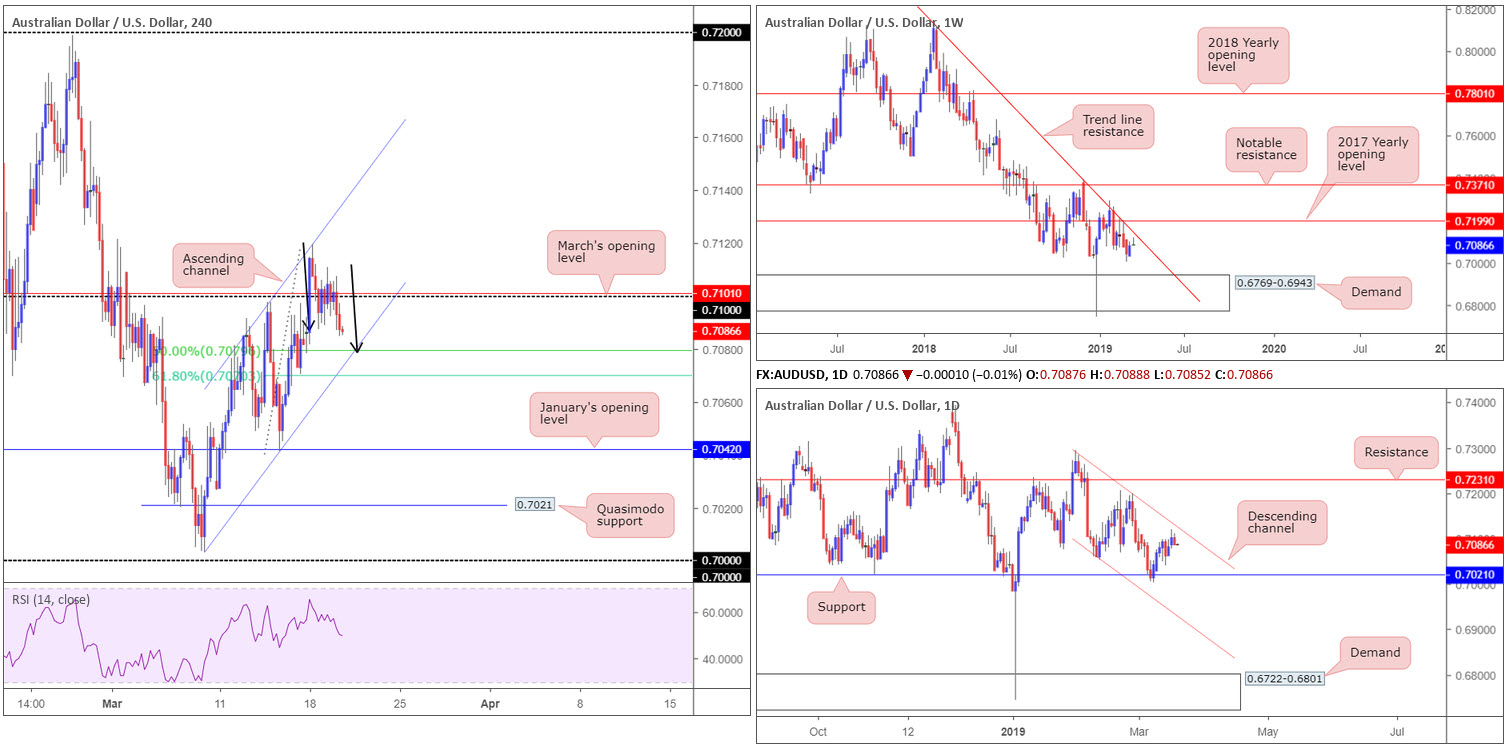
With the Australian dollar trading lower following RBA meeting minutes early Tuesday, the H4 candles eventually reclaimed 0.71 to the downside. The next stop on this timeframe is seen around 0.7079, a 50.0% support that fuses with channel support extended from the low 0.7003. Further to this (black arrows), a nice-looking AB=CD bullish pattern also completes around 0.7079 as well.
On more of a broader perspective, both weekly and daily flow exhibit scope to explore higher ground this week. Weekly action shows room to push as far north as its trend line resistance taken from the high 0.8135 and daily movement has space to advance towards channel resistance extended from the high 0.7295.
Areas of consideration:
Having seen higher-timeframe price action yet to connect with its respective resistances, a long from 0.7080ish today is an idea. Although housing limited confluence from the higher timeframes, local H4 confluence is strong, supporting at least a bounce towards 0.71. With a stop-loss order tucked 2 points beneath the 61.8% Fibonacci support value at 0.7070, an entry from 0.7080 boasts reasonable risk/reward.
Today’s data points: FOMC Economic Projections; FOMC Statement; Federal Funds Rate Decision; FOMC Press Conference.
USD/JPY:
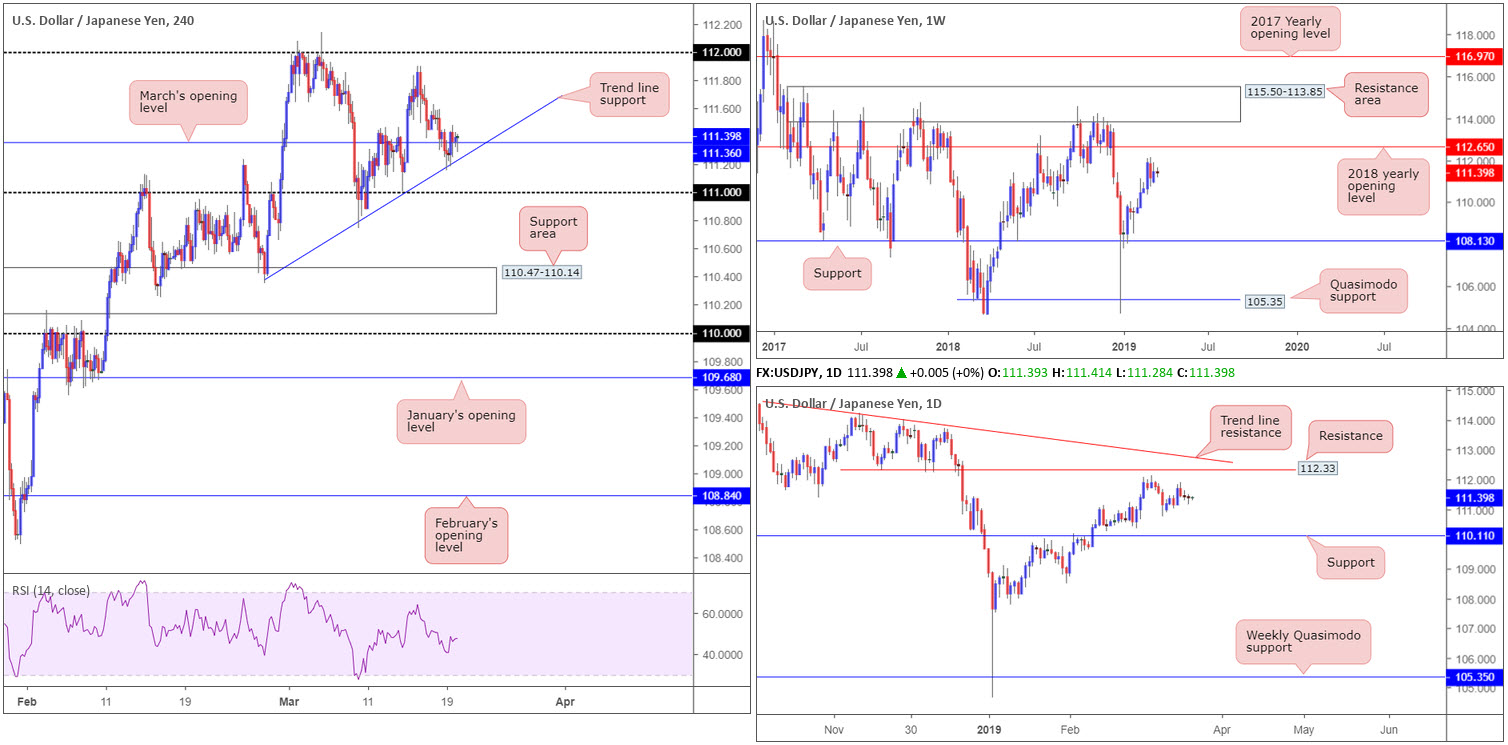
Despite a weak USD bias Tuesday, the USD/JPY pair proved resilient, recovering a large portion of intraday losses and reclaiming March’s opening level at 111.36 on the H4 timeframe.
By and large, the technical structure remains largely unchanged. For that reason, much of the following report will echo similar beliefs put forward in Tuesday’s briefing.
With H4 action indicating it may want to push higher from 111.36 today, a rally towards 112 could be on the cards. Should the unit turn lower, however, this will likely draw price action in the direction of 111, which provided the market reasonably strong support of late.
In terms of where we stand on the higher timeframes, the pendulum remains swinging in favour of the buyers at the moment. As for structure on the weekly timeframe, pivotal resistance at 112.65 (the 2018 yearly opening level) is seen, potentially signifying the market has room to advance. The daily candles, however, have printed a series of higher highs and higher lows since bottoming at 104.65 at the beginning of the year. Recent selling found support around the 110.74 March 8 low and has thus far shown possibility to the upside, with resistance plotted at 112.33 on the radar, followed by trend line resistance extended from the high 114.23.
Areas of consideration:
According to the higher timeframes the buyers are in good form, with daily resistance at 112.33 in place as the first upside objective.
In spite of yesterday’s dip beneath 111.36 to H4 trend line support taken from the low 110.35, the number appears to be holding as we write. With this being the case, this may offer another chance to buy should a notable H4 bullish candlestick pattern emerge (entry/risk levels can be determined according to this structure).
Today’s data points: FOMC Economic Projections; FOMC Statement; Federal Funds Rate Decision; FOMC Press Conference.
USD/CAD:
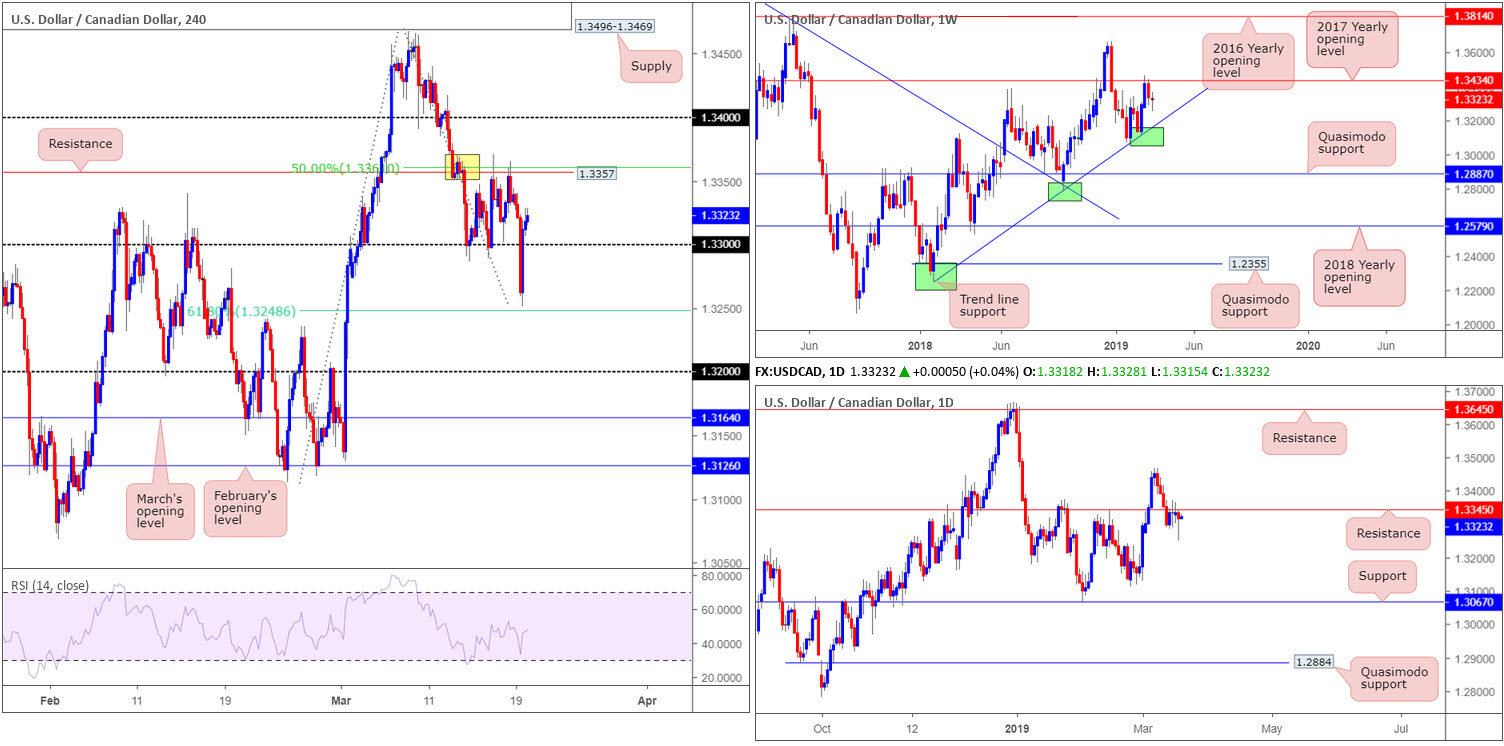
In recent sessions, the USD/CAD washed through orders residing around the 1.33 handle applied to the H4 timeframe, testing lows at 1.3251. Despite this, time beneath 1.33 was short-lived. Leaving the 61.8% Fibonacci support value at 1.3248 open, the pair regained lost ground and ended the day marginally in the red by 0.12%, though firmly positioned back above 1.33.
Despite yesterday’s move chalking up a bullish pin-bar formation on the daily timeframe, technical structure has hefty resistance overhead at 1.3345. In addition to this, price action on the weekly timeframe shattered a two week bullish phase last week, following the pair crossing swords with its 2017 yearly opening level at 1.3434. Additional selling could come to fruition as the next support target does not enter the fight until trend line support (extended from the low 1.2421).
Areas of consideration:
As is seen on the H4 timeframe, the candles appear poised to approach resistance at 1.3357 (merging with a 50.0% resistance at 1.3361 and a supply zone [yellow] at 1.3371-1.3350). Coupled with yesterday’s substantial stop run beneath 1.33 (likely weakening buyers here), as well as where we’re positioned on the bigger picture (see above), opens up a possible sell from 1.3357ish today, according to our technical studies.
Overall, the zone of interest falls in at 1.3371/1.3345 today. This is the top edge of the current H4 supply in yellow and daily resistance level: a range of 26 pips. Stop-loss orders can be tucked above this area and entry can, should it agree with your own personal trading methodology, be taken from 1.3345, targeting 1.33 as the initial take-profit target: 45 pips distance (a near 1:2 risk/reward ratio).
Today’s data points: FOMC Economic Projections; FOMC Statement; Federal Funds Rate Decision; FOMC Press Conference.
USD/CHF:
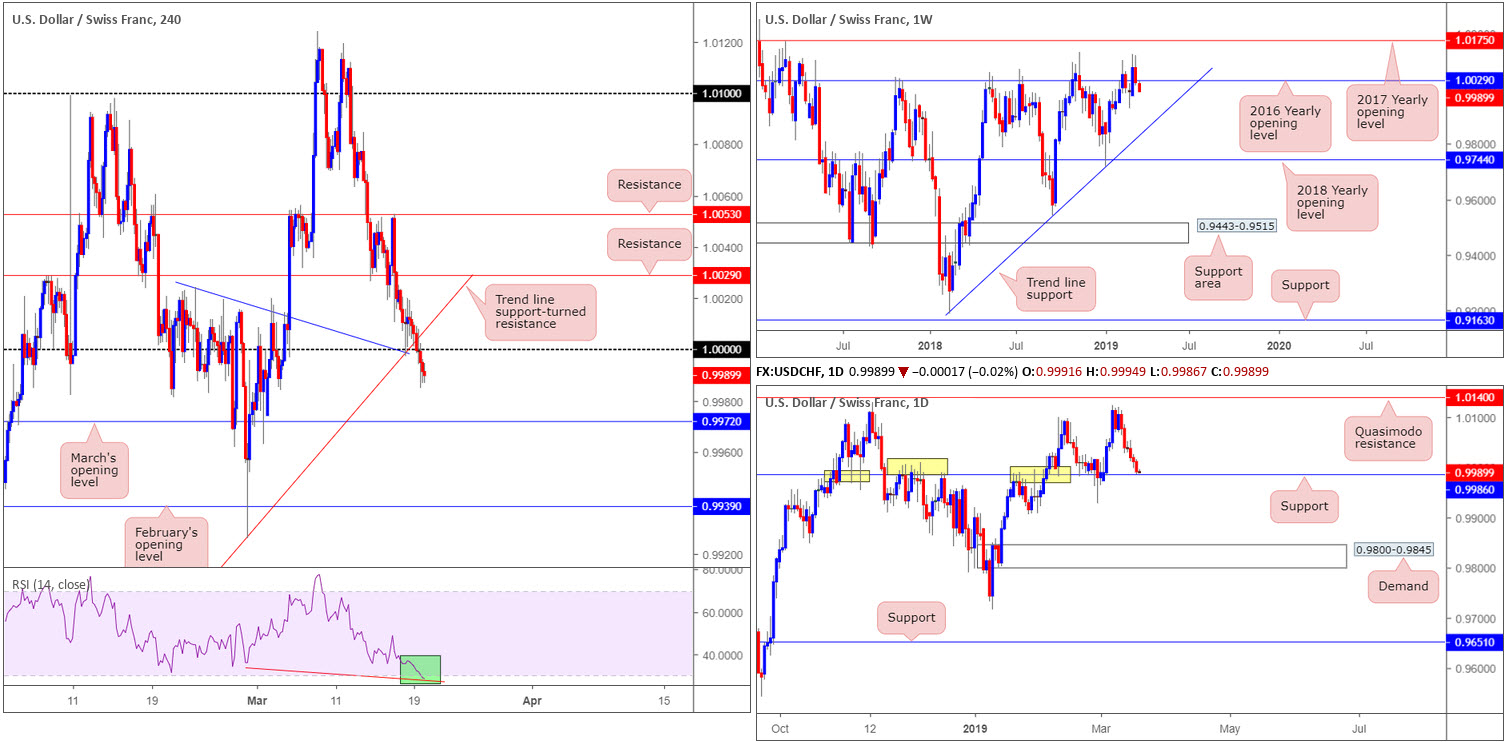
The response from 1.0000 (parity) on the H4 timeframe was short-lived Monday, limited by a less-than-impressive 20-pip move. Broad-based USD selling weighed on the USD/CHF Tuesday, pressuring the pair beneath 1.0000 in early London hours, later bolstered by trend line support-turned resistance taken from the low 0.9716 (seen clearer on the H1 timeframe). A bearish wind could see March’s opening level at 0.9972 enter the mix. It might also be worth pencilling in we have an oversold/divergence RSI reading (green).
Breakout sellers sub 1.0000, although in profit, may run into headwinds today as daily price crossed swords with support coming in at 0.9986 yesterday (a level that boasts incredibly strong history [yellow]). Contrary to this, however, last week’s weekly candle concluded marginally beneath the 2016 yearly opening level at 1.0029. Having seen this level cap upside since May 2017 a move lower from here could take shape. The next area of interest to the downside is a trend line support extended from the low 0.9187.
Areas of consideration:
According to our technical reading, this market, for lack of a better word, is caught between a rock and a hard place. Although weekly price indicates possible selling, daily price suggests a move higher may be in store. Couple this with H4 action displaying limited space to manoeuvre: 1.0000 to the upside and 0.9972 seen lower down on the curve, opting to remain flat may be the better path to take today.
Today’s data points: FOMC Economic Projections; FOMC Statement; Federal Funds Rate Decision; FOMC Press Conference.
Dow Jones Industrial Average:
US equities closed mostly lower Tuesday, with the Dow Jones Industrial Average snapping a two-day winning streak, amid conflicting reports on US/China trade talks.
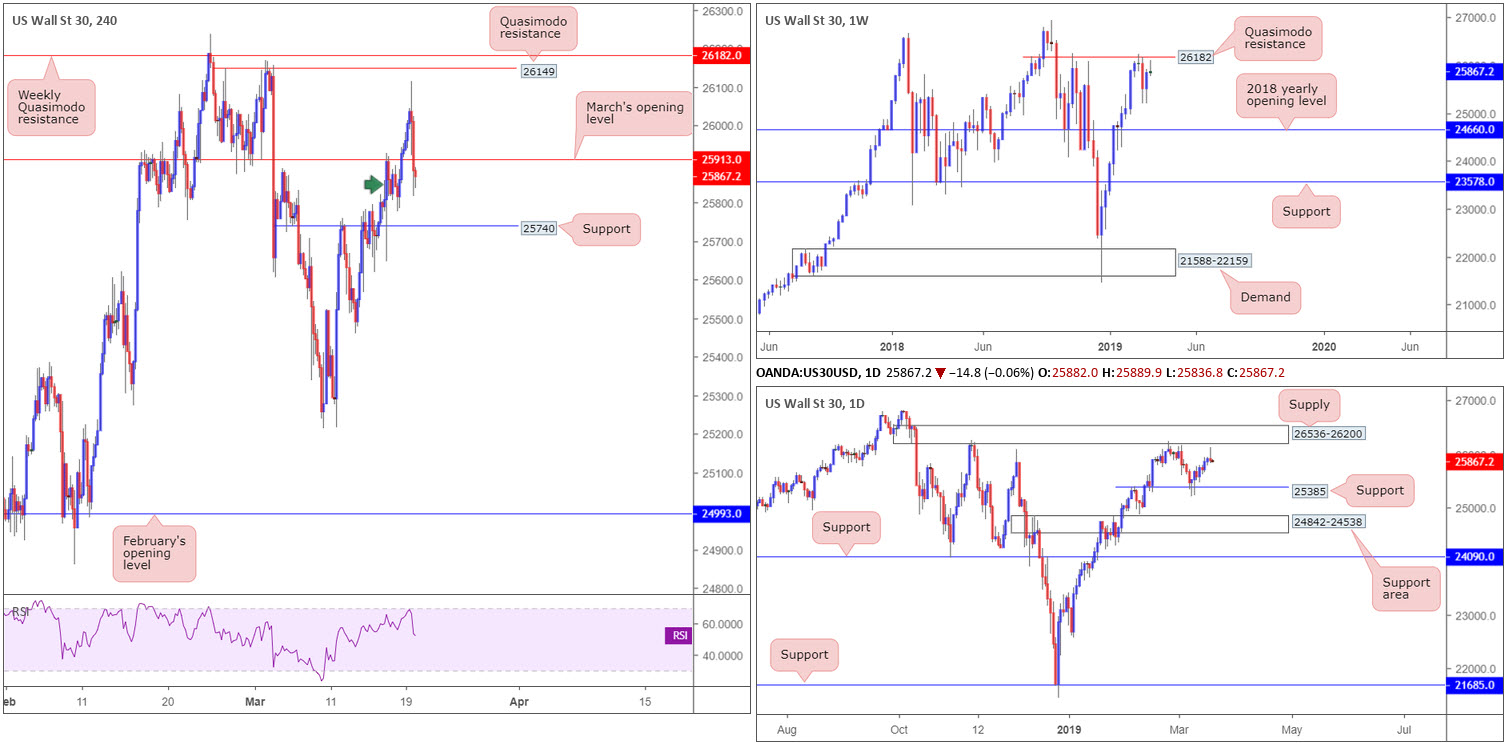
H4 action, as is visible from the chart, sold off south of a Quasimodo resistance at 26149, consequently overthrowing March’s opening level at 25913 and exposing support priced in at 25740. Traders may want to also acknowledge we have some demand immediately to the left of current price (green arrow) around 25776/25850.
In response to yesterday’s moves, daily flow chalked up a bearish pin-bar pattern just south of supply at 26536-26200. Should this entice further selling, the next area of interest falls in around 25385: the origin of the most recent up move from 25213. By the same token, weekly action topped just ahead of its Quasimodo resistance level at 26182 yesterday. Note this level is positioned just beneath the current daily supply.
Areas of consideration:
Traders will likely be on standby ahead of today’s Fed meet.
Technically speaking, H4 demand at 25776/25850 may force a retest to the underside of 25913. Whether this level will hold as resistance is difficult to judge. Although we do have a daily bearish candlestick signal, structure shows room for both weekly and daily flow to push higher, at least until the weekly Quasimodo resistance at 26182.
On account of the above, traders may be more inclined to sit tight and wait for a possible break above 25913 for a potential retest play, targeting yesterday’s high 26114, followed by H4 Quasimodo resistance at 26149.
Today’s data points: FOMC Economic Projections; FOMC Statement; Federal Funds Rate Decision; FOMC Press Conference.
XAU/USD (GOLD):
Despite gold XAU/USD advancing higher for a third consecutive day Tuesday, pretty much in lockstep with EUR/USD movement, structure is unchanged this morning.
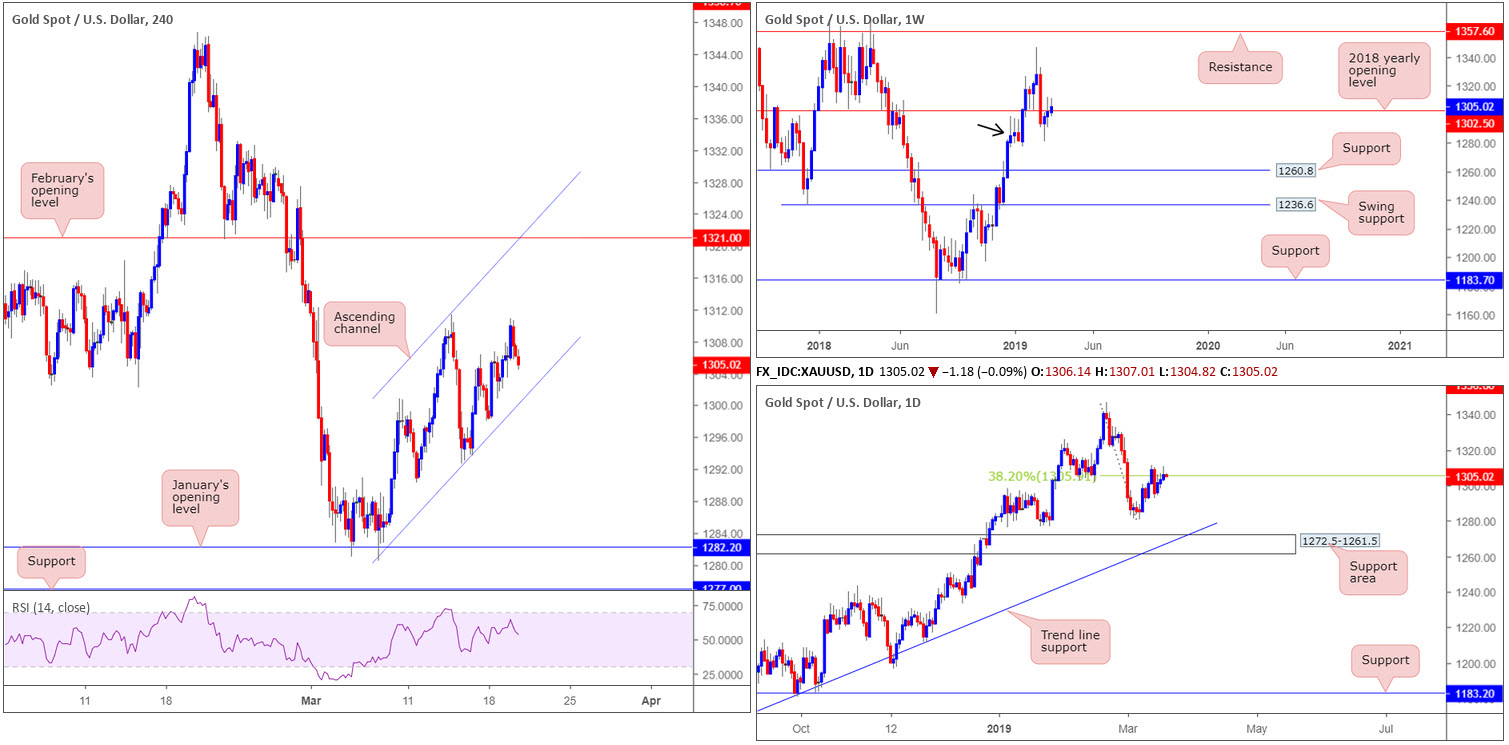
Up 0.21% on the day, H4 reveals the candles are compressing within an ascending channel formation (low: 1280.4 high: 1311.3). Arguably, the price of gold could continue to rise within these limits until shaking hands with
February’s opening level at 1321.0.
On a wider perspective, demand on the weekly timeframe at 1276.5-1298.5 (black arrow) is seen holding this market higher, forcing bullion back above its 2018 yearly opening level at 1302.5. Meanwhile on the daily timeframe, the candles are capped by a 38.2% Fibonacci resistance value at 1305.9. This barrier, assuming it holds, has the support area at 1272.5-1261.5 in sight, which, as you can see, merges with a trend line support taken from the low 1160.3. Though do bear in mind for this area to be brought into the fight, a break of the current weekly demand zone will need to take shape.
Areas of consideration:
As weekly price attempts to reclaim 1302.5 from demand at 1276.5-1298.5, further buying within the current H4 ascending channel pattern is a possibility. At current price, though, this remains a challenging market to buy. Should a retest of the said channel support take form today, however, and print a H4 bullish candlestick pattern (traders have the option of entering and positioning stops based on the candlestick structure), this will likely entice buyers into the market.
The accuracy, completeness and timeliness of the information contained on this site cannot be guaranteed. IC Markets does not warranty, guarantee or make any representations, or assume any liability with regard to financial results based on the use of the information in the site.
News, views, opinions, recommendations and other information obtained from sources outside of www.icmarkets.com.au, used in this site are believed to be reliable, but we cannot guarantee their accuracy or completeness. All such information is subject to change at any time without notice. IC Markets assumes no responsibility for the content of any linked site. The fact that such links may exist does not indicate approval or endorsement of any material contained on any linked site.
IC Markets is not liable for any harm caused by the transmission, through accessing the services or information on this site, of a computer virus, or other computer code or programming device that might be used to access, delete, damage, disable, disrupt or otherwise impede in any manner, the operation of the site or of any user’s software, hardware, data or property


