
EUR/USD:
The euro witnessed a reasonably robust decline vs. its US counterpart Tuesday, following ECB’s President Draghi opening the door for further monetary stimulus, as well as the ZEW Indicator of economic sentiment for Germany decreasing sharply in June 2019 – stands at -21.1 points.
For folks who read Tuesday’s technical report you may recall the following:
The 1.12 handle on the H4 timeframe, and its closely associated monthly opening levels (April and May) at 1.1221 and 1.1211, emphasise a fragile tone, according to the overall technical picture, and therefore is unlikely to produce much more upside this week.
Thanks to Draghi and weak EZ figures, along with higher-timeframe structure, yesterday’s analysis played out, with the possibility of further downside upon us.
Here’s a reminder of where our analysis is currently positioned on the bigger picture:
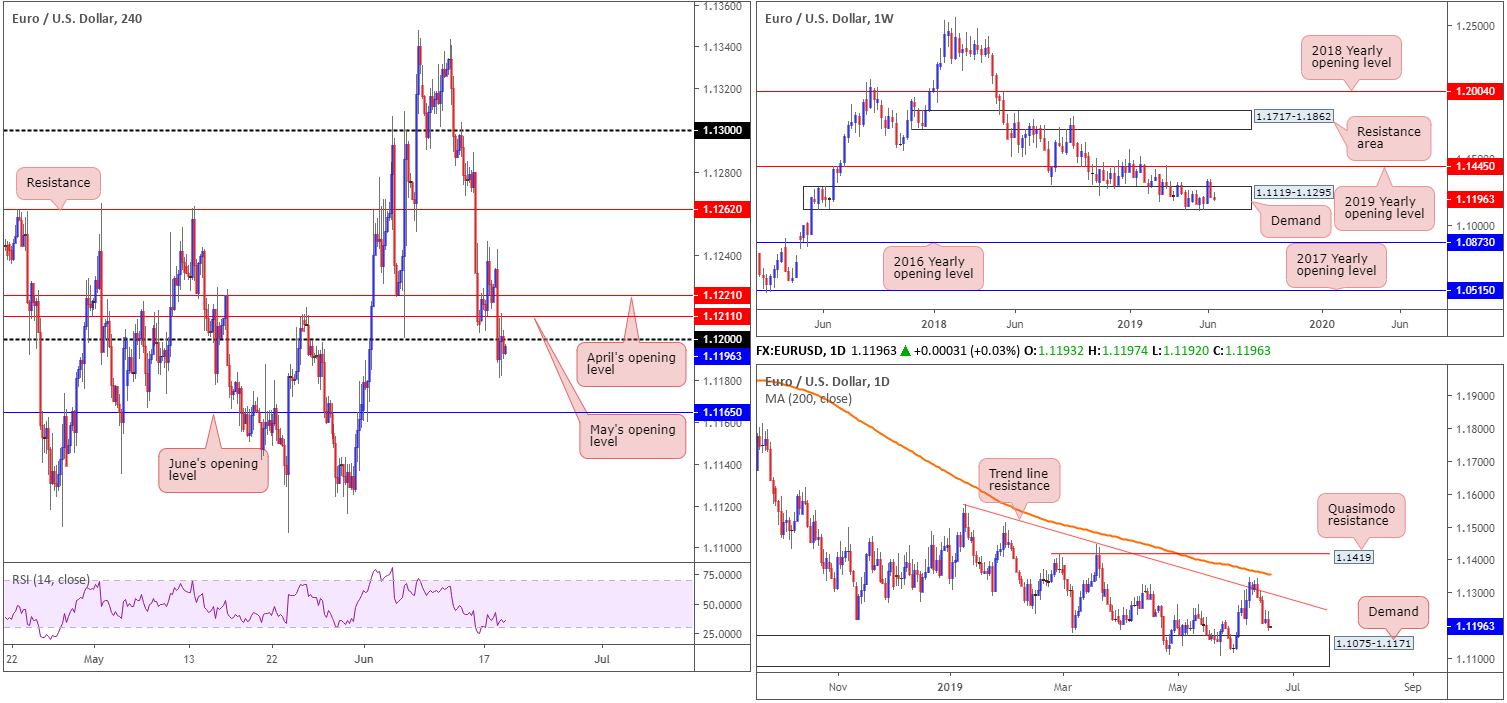
In spite of a notable offensive phase out of a long-standing weekly demand area at 1.1119-1.1295 two weeks back, the euro declined more than 120 points against the buck last week. This – coupled with the overall trend still facing a southerly bearing since topping in early 2018 – places a bold question mark on the demand’s life expectancy.
Targets to be aware of on the longer-term weekly chart can be seen at the 2019 yearly opening level at 1.1445 and the 2016 yearly opening level coming in at 1.0873.
On the daily timeframe:
With trend line resistance (extended from the high 1.1569) intact, the next downside target on this timeframe to be aware of this week falls in around demand at 1.1075-1.1171 (glued to the underside of the weekly demand highlighted above).
Areas of consideration:
Having seen the market explore lower ground and chalk up a H4 close below 1.12, as expected, further selling towards June’s opening level at 1.1165 could be in store.
As such, the following scenarios voiced in Tuesday’s briefing remain valid:
- A H4 close beneath 1.12, targeting 1.1165 as the initial point of concern. Short-term traders have the option of either selling the breakout candle and positioning stop-loss orders above the upper shadow (probably would have been stopped out here by now though) or above either April or May’s opening levels. Another alternative is to wait and see if a retest at 1.12 as resistance develops (which it has) and enter on the back of the rejection candle’s structure, preferably a bearish candlestick. The latter is considered the more conservative route.
- Long opportunity from 1.1165, considering it is located within the upper limit of daily demand. Bear in mind, however, this entails buying into the overall trend, so trade cautiously here.
Today’s data points: ECB President Draghi Speaks; FOMC Economic Projections; FOMC Statement; Federal Funds Rate and FOMC Press Conference.
GBP/USD:
UK politics saw Boris Johnson maintain his lead in the second Conservative Leadership Vote Tuesday, whilst Dominic Raab was eliminated after securing fewer than 33 votes.
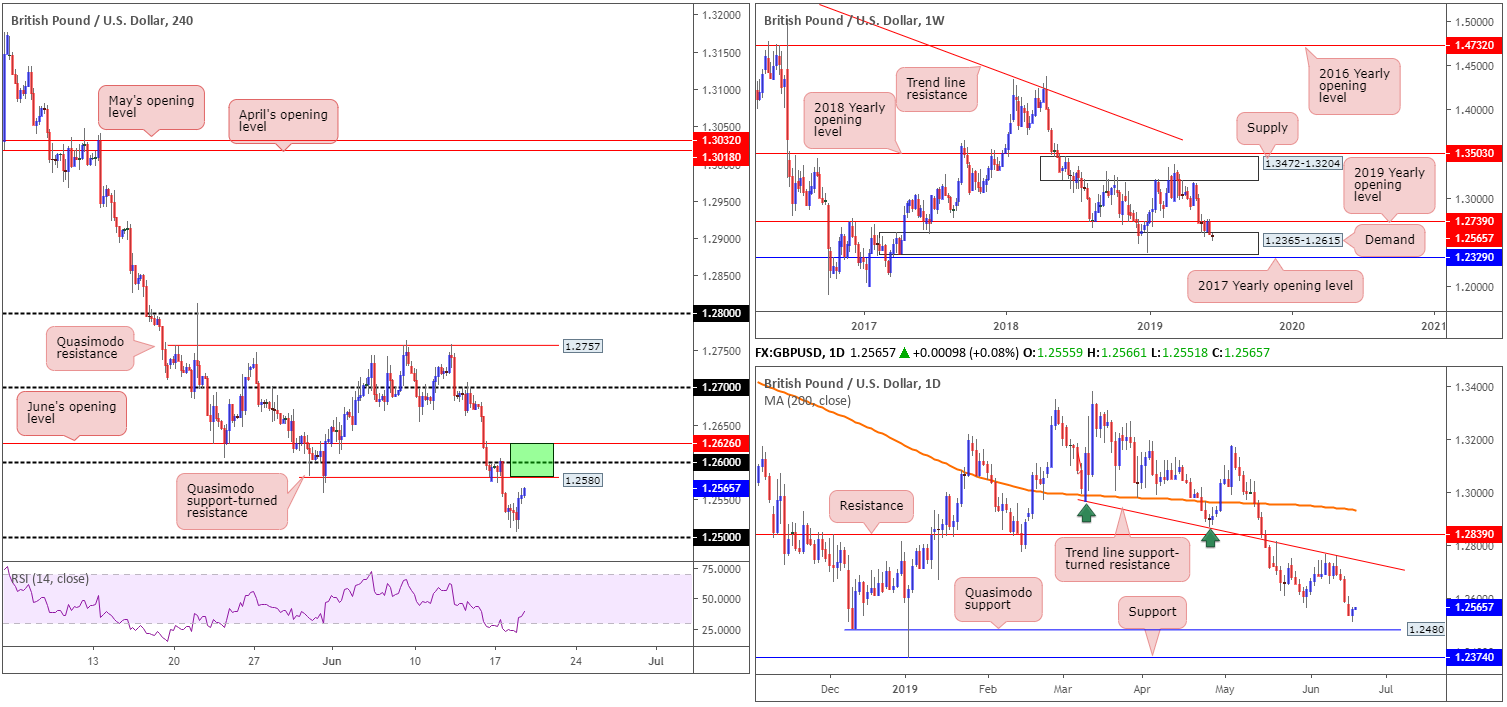
Leaving 1.25 unchallenged on the H4 timeframe, sterling staged a modest recovery and finished the session within striking distance of a Quasimodo support-turned resistance at 1.2580, shadowed closely by 1.26 and June’s opening level at 1.2626. All three barriers (green) combined, according to our technical studies, form a reasonably robust resistance zone.
As for the higher timeframes, here’s a piece from our weekly report:
Shedding more than 140 points on the week by way of a near-full-bodied bearish candle, price action reconnected with a long-standing weekly demand at 1.2365-1.2615 after failing to sustain gains above the 2019 yearly opening level at 1.2739.
Failure to overthrow 1.2739 brings into question the validity of the current demand. For that reason, it may be an idea to pencil in the 2017 yearly opening level at 1.2329, in the event we press for lower ground this week.
And from the daily timeframe:
In conjunction with the 2019 yearly opening level on the weekly timeframe, additional resistance entered the fold last week in the shape of a daily trend line support-turned resistance extended from the low 1.2960.
The next point of calling, as we’re now beyond the 1.2558 May 31 low, can be found at a Quasimodo formation drawn from 1.2480, closely shadowed by support at 1.2374.
Traders may also wish to note yesterday’s recovery broke a four-day selling phase.
Areas of consideration:
The first downside target is 1.25 on the H4 timeframe. Seeing as we’ve yet to shake hands with this barrier, a sell from 1.2626/1.2580 (the H4 resistance zone highlighted above in bold) is certainly worth considering today for potential shorts. Beyond 1.25, the next take-profit target resides at the daily Quasimodo support mentioned above at 1.2480.
Today’s data points: UK CPI y/y; UK PPI Input m/m; FOMC Economic Projections; FOMC Statement; Federal Funds Rate and FOMC Press Conference.
AUD/USD:
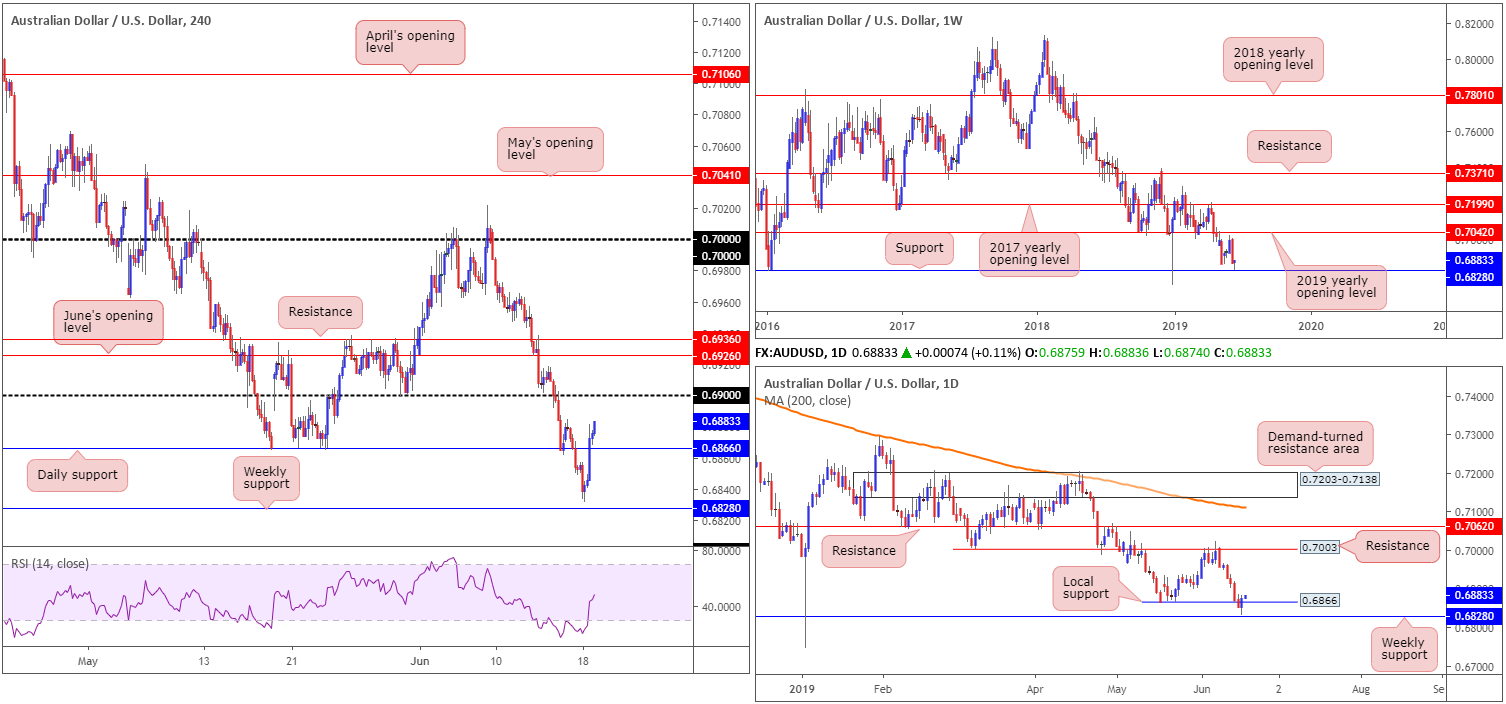
Several news outlets reported US President Trump and President Xi of China had a productive telephone conversation and will be having an extended meeting next week at the G-20. Buoyed by the upbeat risk sentiment, the AUD/USD established a ‘floor’ just north of weekly support at 0.6828 Tuesday and settled for the day closing above daily resistance at 0.6866.
Assuming buyers remain defensive above 0.6866, an approach towards the 0.69 handle may be on the cards today. Having seen 0.69 serve well as support in recent trading, resistance is expected to emerge. In the event we press above here, nonetheless, June’s opening level on the H4 timeframe at 0.6926 can be seen as the next port of call, closely trailed by resistance at 0.6936.
Areas of consideration:
On account of the above, the first area of interest is the daily support at 0.6866. A retest at this level, preferably in the shape of a H4 bullish candlestick configuration as this helps base entry and risk, is a high-probability long opportunity, targeting 0.69 as the initial upside objective.
A failure of daily support, however, could lead to price heading back towards weekly support at 0.6828. Taken from Tuesday’s report, the research team had the following to say regarding this weekly base:
Should 0.6828 enter the fight and produce a notable H4 bullish candlestick configuration – think hammer formation of bullish engulfing pattern – the odds of price developing at least a healthy bounce is high, targeting the underside of 0.6866 as the initial upside objective (entry and risk elements can be determined according to the bullish candlestick’s structure).
Today’s data points: FOMC Economic Projections; FOMC Statement; Federal Funds Rate and FOMC Press Conference.
USD/JPY:
The US dollar observed a resurgence of bidding against the Japanese yen Tuesday after Trump announced the resumption of China trade talks following his telephone conversation with China President Xi.
In Tuesday’s briefing, the research team wrote the following:
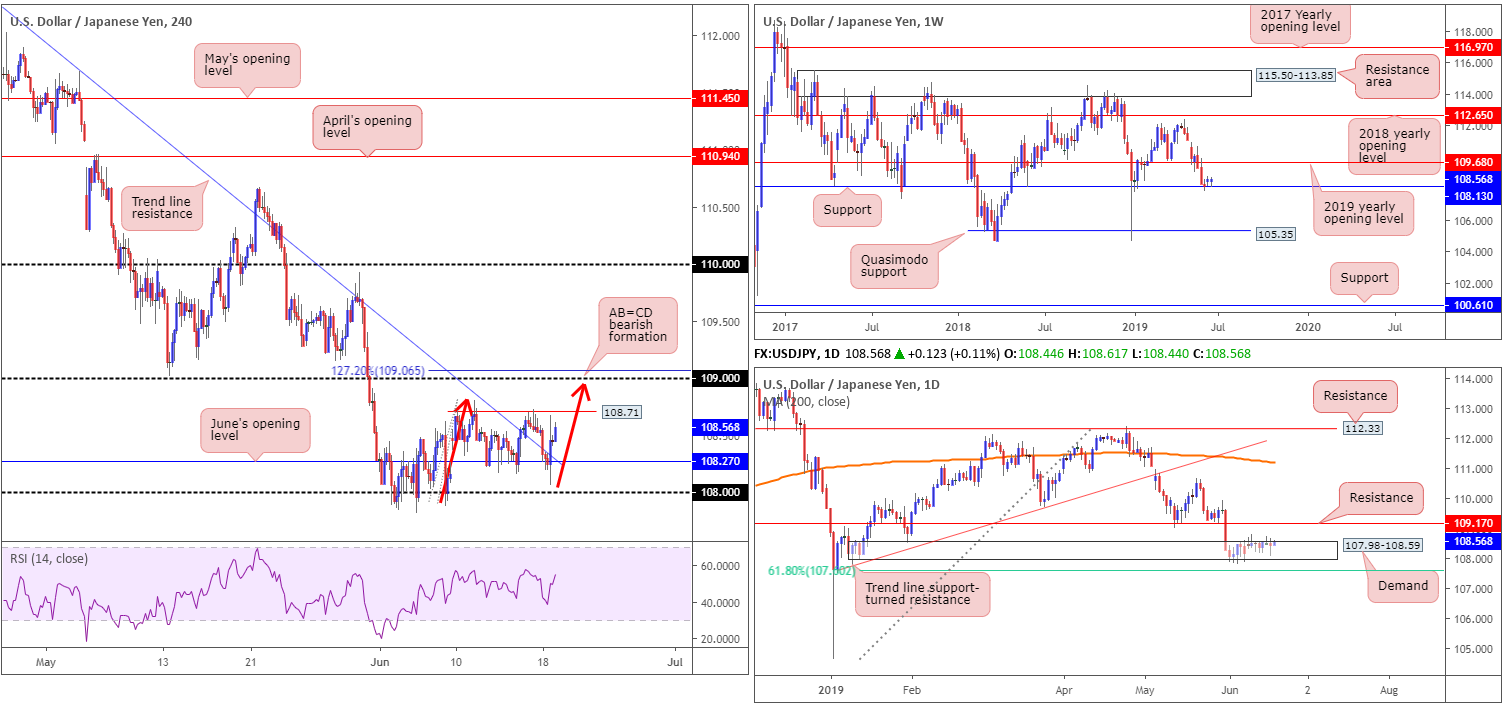
In light of price action recently respecting H4 Quasimodo resistance at 108.71, short-term buying opportunities may develop around June’s opening level at 108.27, which converges with H4 trend line resistance-turned support (extended from the high 112.40).
As is evident from the H4 chart this morning, the candles did indeed retest 108.27 and hold firm, albeit with a spike to lows of 108.06 beforehand. In recent hours, we can see the unit is fast approaching the noted H4 Quasimodo resistance at 108.71. Well done to any of our readers who managed to pin down a position from 108.27.
With 108.71 already welcoming a test this week, a break above this barrier and a follow-through move to the 109 handle is likely. The research team favours 109 as valid resistance owing to its convergence with a H4 127.2% AB=CD (red arrows) bearish formation at 109.06, and daily price establishing resistance overhead at 109.17.
Areas of consideration:
In regard to traders long from 108.27, 109 on the H4 timeframe is likely to be a difficult barrier to break through. For that reason, it should be considered a take-profit target.
As for 109 as a sell zone, conservative stop-loss placement is best above this daily barrier at 109.17. The first downside target will likely be around 108.71, followed by June’s opening level at 108.27 (though do consider daily support could potentially enter the mix around 108.59 [the top edge of daily demand at 107.98-108.59]). Timed right, this trade could produce favourable risk/reward.
Today’s data points: FOMC Economic Projections; FOMC Statement; Federal Funds Rate and FOMC Press Conference.
USD/CAD:
By way of a notable daily bearish engulfing configuration, the USD/CAD explored lower ground Tuesday on the back of rising crude oil prices, down 0.27%. Crude markets took their cues from wider risk sentiment, with a dovish ECB and some China trade resolution hopes.
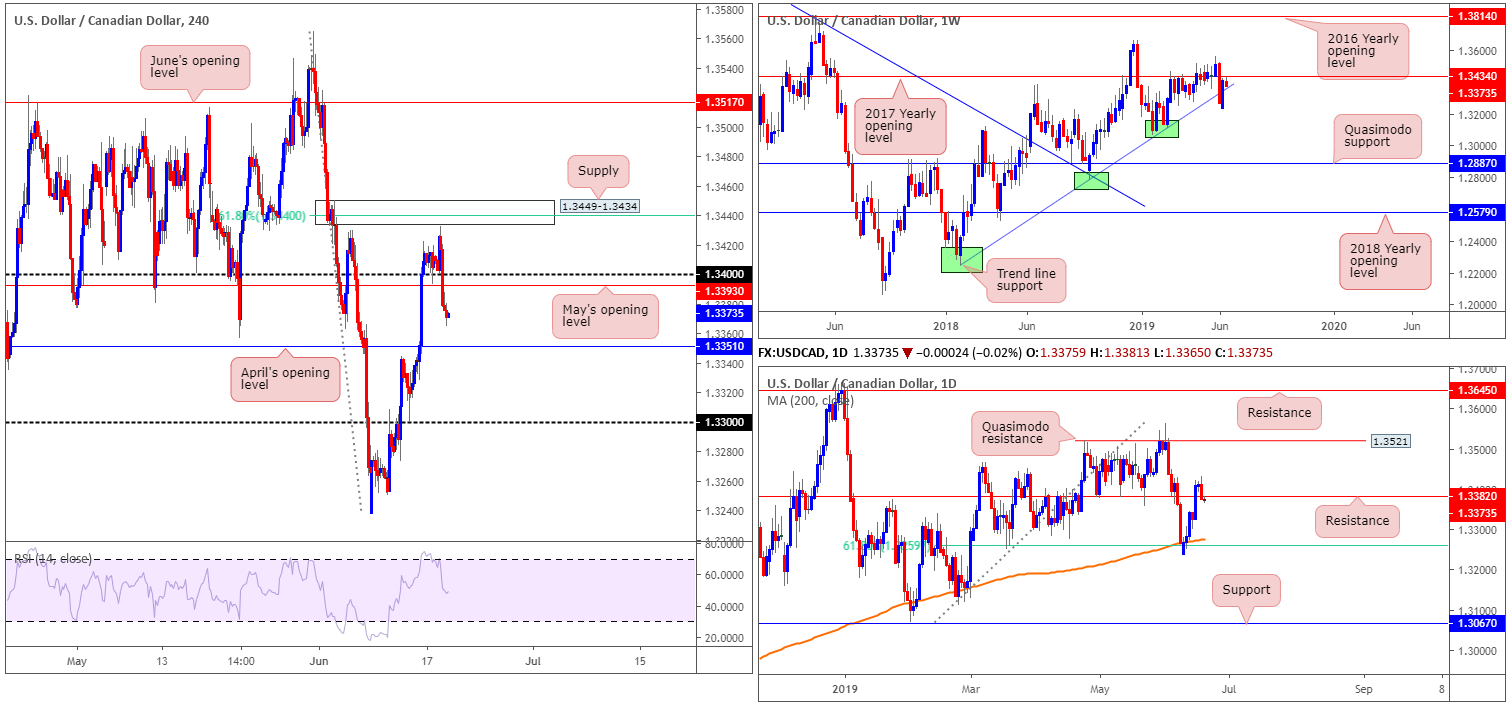
According to H4 technicals, price action came within two points of connecting with supply at 1.3449-1.3434 (and merging 61.8% Fibonacci resistance at 1.3440), before turning lower and reclaiming 1.34/May’s opening level at 1.3393. The next support target can be seen at April’s opening level fixed from 1.3351.
On a wider perspective, weekly flow came within touching distance of shaking hands with the 2017 yearly opening level at 1.3434 (the underside of H4 supply), before heading southbound. The recent break of nearby trend line support (extended from the low 1.2247) likely tripped a large portion of protective stop-loss orders and cleared the path lower. Therefore, further selling could be in store.
A closer reading of price action on the daily timeframe has recent movement climbing back beneath support at 1.3382, potentially unlocking downside to the 200-day SMA (currently trading around 1.3278).
Areas of consideration:
With all three timeframes expressing an interest to the downside today, a retest at 1.34 as resistance is likely eyed by many traders, targeting a test of April’s opening level at 1.3351. Beyond here, we have the 1.33 handle in sight. Conservative traders concerned about being taken out on a whipsaw above 1.34 may opt to wait for additional confirmation to form before pulling the trigger (preferably a H4 bearish candlestick signal, allowing entry and risk to be based on its structure).
In the event 1.34 is taken out, however, the H4 supply mentioned above at 1.3449-1.3434 is of interest for possible shorting opportunities, having seen the base merge with a 61.8% Fibonacci resistance at 1.3440 and the 2019 yearly opening level on the weekly timeframe at 1.3434.
Today’s data points: FOMC Economic Projections; FOMC Statement; Federal Funds Rate and FOMC Press Conference; Canadian CPI m/m; Canadian Common CPI y/y; Canadian Median CPI y/y; Canadian Trimmed CPI y/y.
USD/CHF:
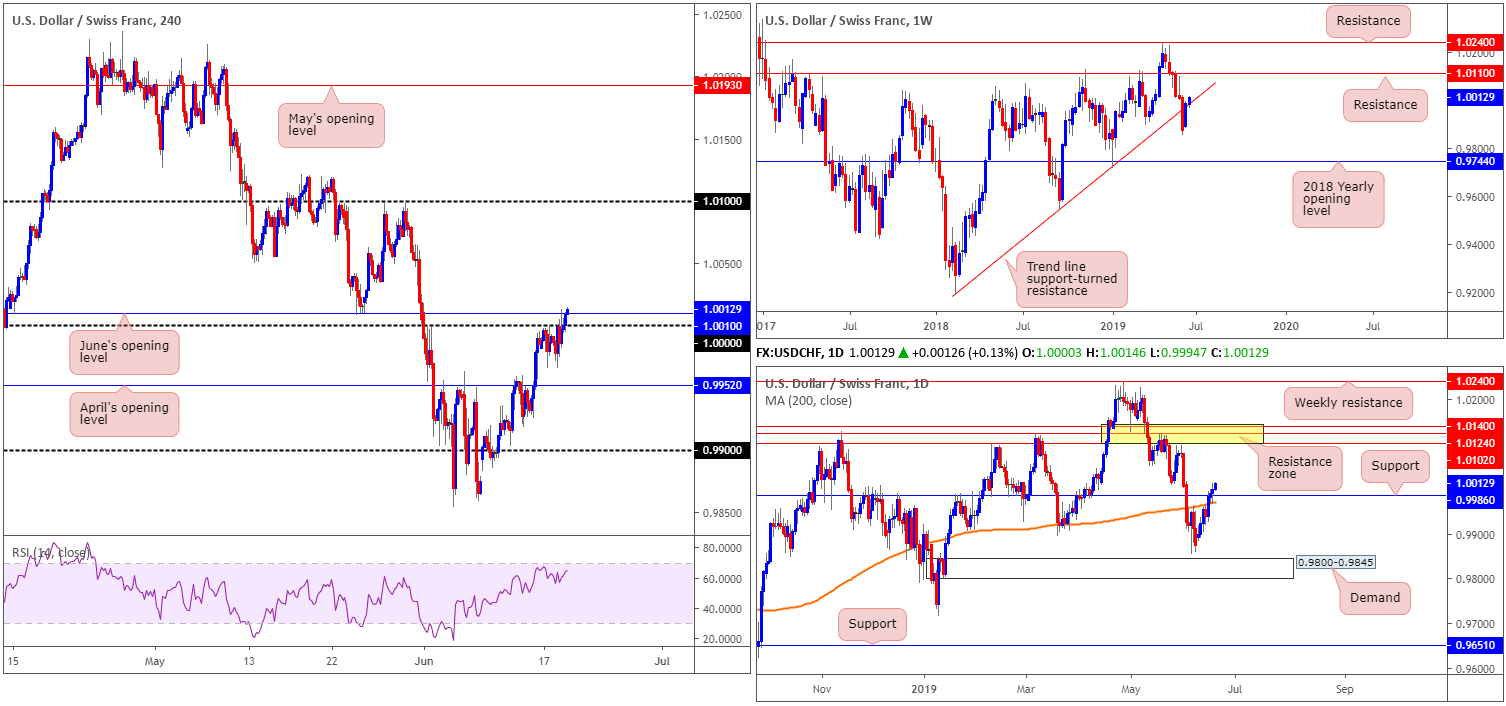
Selling pressure surrounding the euro intensified Tuesday, following ECB’s President Draghi opening the door for further monetary stimulus, as well as the ZEW Indicator of economic sentiment for Germany decreasing sharply in June 2019. This helped lift the USD/CHF higher. Following a failed attempt to breach 1.0000 (parity) in early trading Tuesday, the USD/CHF gained traction amid US hours and overthrew the critical level, reaching highs of 1.0012. As of writing, the H4 candles are seen trying to press above June’s opening level at 1.0010.
On more of a broader perspective, the daily candles also conquered notable resistance at 0.9986 and appears poised to approach a resistance area marked in yellow at 1.0140/1.0102. Weekly movement, on the other hand, is seen trying to reclaim an upside presence above its trend line support taken from the low 0.9187, with the next upside target coming in at 1.0110.
Areas of consideration:
Having witnessed 1.0000 be taken out yesterday, and June’s opening level at 1.0010 having a hard time capping upside, as well as the unit’s position on the higher timeframes (see above), further buying could be on the menu today, traders.
Entering long at current price is an option, targeting the 1.01 handle on the H4 timeframe, which happens to converge with the underside of the daily resistance area at 1.0140/1.0102. Another alternative is to wait and see if a correction forms to retest 1.0000 as support. A retest play in the shape of a H4 bullish candlestick pattern would be ideal, as this not only helps identify buyer intent, it also provides entry and risk levels to work with.
Today’s data points: FOMC Economic Projections; FOMC Statement; Federal Funds Rate and FOMC Press Conference.
Dow Jones Industrial Average:
Global equity indexes advanced Tuesday, as positive sentiment took hold of the market. Several news outlets reported US President Trump and President Xi of China had a productive telephone conversation and will be having an extended meeting next week at the G-20. The Dow Jones Industrial Average closed higher by 1.35%; the S&P 500 also added 0.97%, along with the tech-heavy Nasdaq 100 advancing 1.45%.
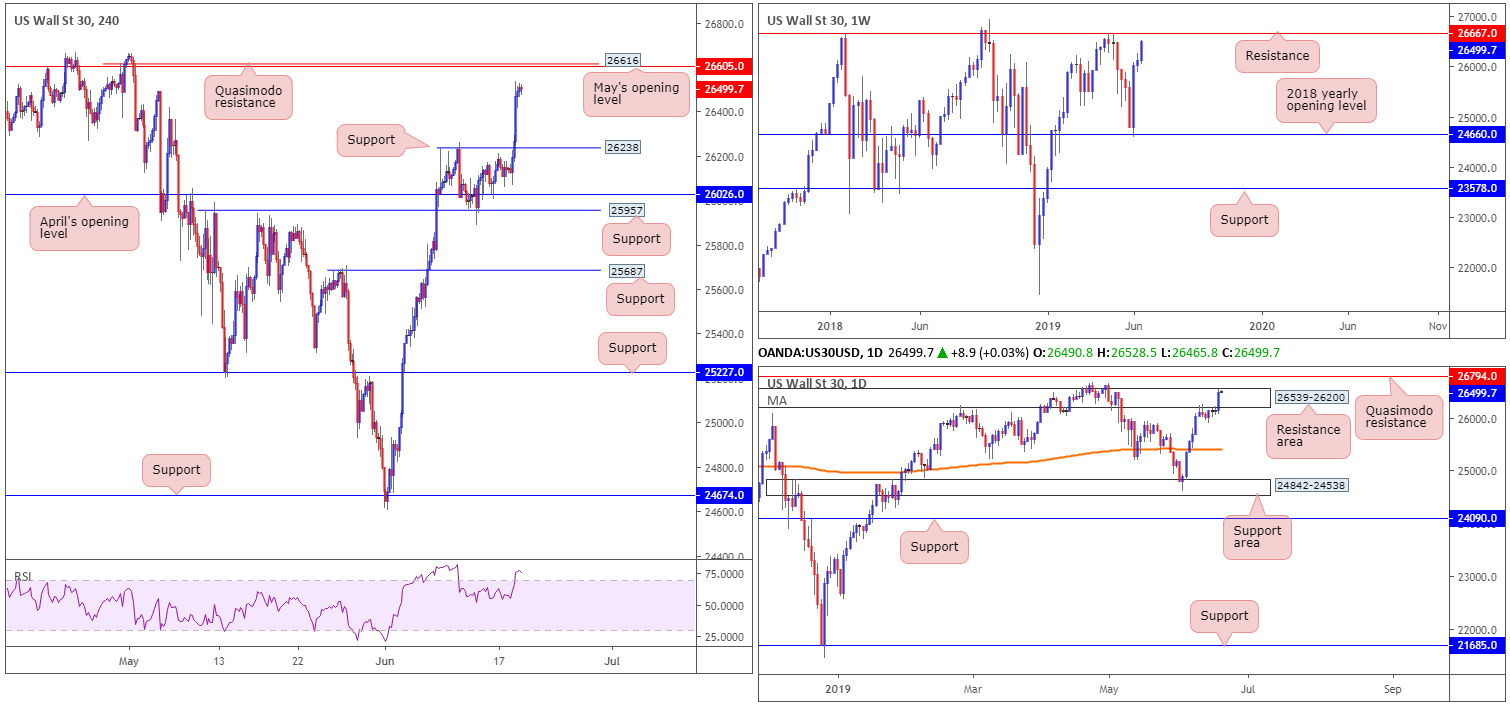
The recent run higher has positioned the H4 candles within close proximity of May’s opening level at 26605 and a Quasimodo resistance level at 26616. This area is interesting, as it aligns closely with the weekly timeframe’s next upside target: resistance at 26667.
The story on the daily timeframe has the unit trading within the upper boundary of a resistance area at 26539-26200. A violation of this area exposes Quasimodo resistance at 26794. Therefore, this could foretell a possible fakeout scenario through the aforementioned H4 and weekly resistances.
Areas of consideration:
Between the weekly resistance at 26667 and May’s opening level on the H4 timeframe at 26605 is an area of interest for potential selling opportunities today. To help avoid being whipped out of a position on a deep fakeout to the daily Quasimodo resistance mentioned above at 26794, traders are urged to wait for additional confirmation to take shape before initiating a position. This could be anything from a H4 or H1 bearish candlestick configuration, a lower-timeframe MA crossover or even drilling down to the lower timeframes and attempting to trade local (price action) structure within the zone.
The next downside target from 26605 falls in around H4 support at 26238.
Today’s data points: FOMC Economic Projections; FOMC Statement; Federal Funds Rate and FOMC Press Conference.
XAU/USD (GOLD):
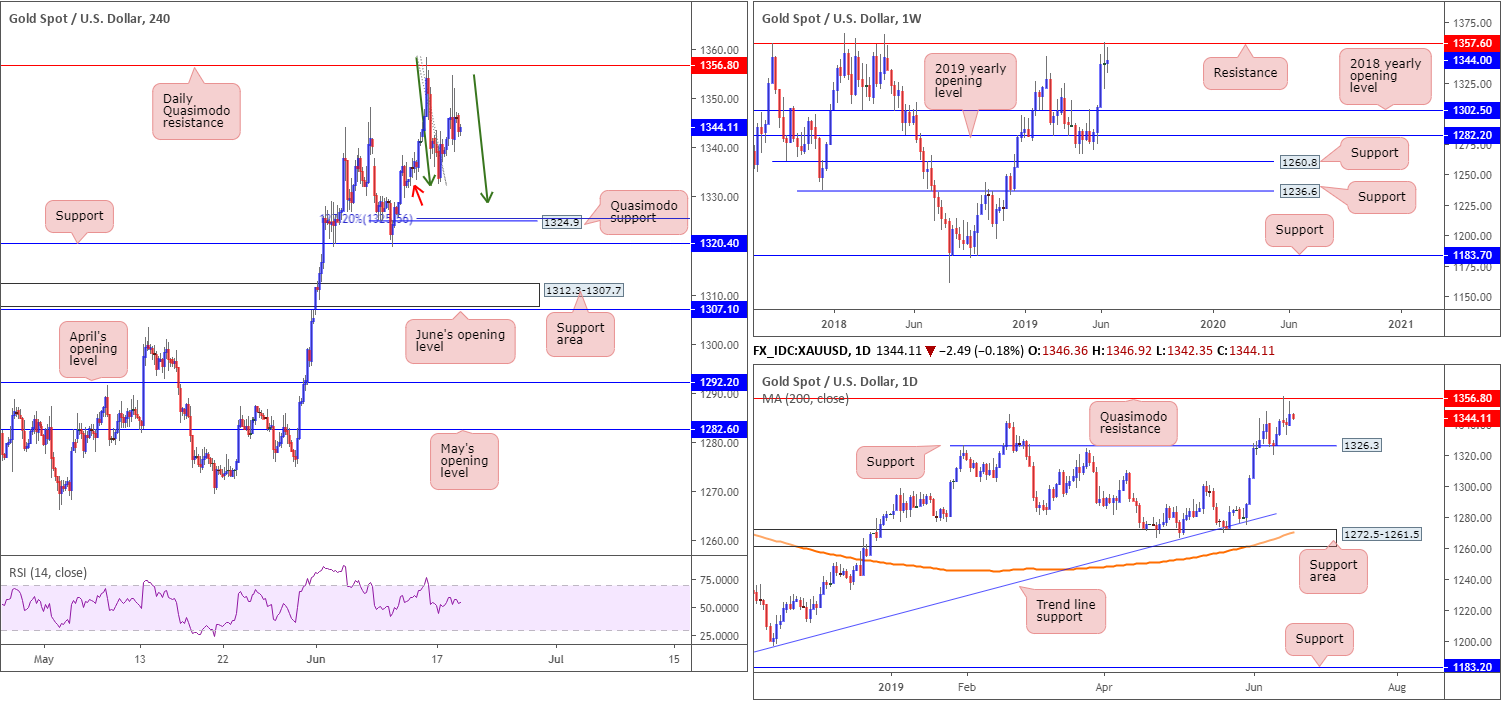
Kicking things off from the weekly timeframe, as highlighted in Monday’s weekly report, the weekly picture finished by way of a clear-cut indecision candle last week. What is interesting from a technical perspective, though, is resistance at 1357.6 entered the mix, which happens to boast strong historical significance. This, technically speaking, may entice sellers into the market this week, with an eventual test possibly seen at support drawn from the 2018 yearly opening level at 1302.5.
From the daily timeframe, however, Friday’s shooting star pattern formed off of the Quasimodo resistance at 1356.8 has so far failed to entice sellers into the market. This has likely left candlestick traders battling with drawdown at the moment as the low of the shooting star was penetrated Monday, perhaps triggering sell orders. The next support target on this timeframe can be seen close by at 1326.3.
Lower-timeframe flows has the H4 candles meandering south of the daily Quasimodo resistance mentioned above at 1356.8. Tuesday found a ledge of support from demand marked with a red arrow at around 1334.1 and has remained supportive since. Beneath here, though, the research team notes additional layers of support residing around a Quasimodo formation at 1324.9 and support at 1320.4.
Areas of consideration:
With the US dollar index trading at weekly resistance around 97.72, a dollar selloff may take form and likely lift the yellow metal to higher ground. The problem with this theory is weekly price on gold also displays strong resistance at 1357.6.
Short-term movement on the H4 timeframe, however, may put in for a bullish 127.2% ABCD (green arrows) pattern that terminates around the H4 Quasimodo support at 1324.9. This level, coupled with nearby H4 support at 1320.4, provides a strong area to work with for longs, should we reach this low today. What’s also interesting is the daily support underlined above at 1326.3 also aligns closely with the area.
For traders who feel the confluence present between 1320.4/1324.9 is sufficient enough to take a trade, entry and risk can be determined according to the structure. Those who feel weekly sellers may enter the fight from resistance at 1357.6, nonetheless, have the choice of waiting for additional price action to form before pressing the buy button. This could be anything from a H4 or H1 bullish candlestick configuration, a lower-timeframe MA crossover or even drilling down to the lower timeframes and attempting to trade local (price action) structure within the zone.
The accuracy, completeness and timeliness of the information contained on this site cannot be guaranteed. IC Markets does not warranty, guarantee or make any representations, or assume any liability with regard to financial results based on the use of the information in the site.
News, views, opinions, recommendations and other information obtained from sources outside of www.icmarkets.com.au, used in this site are believed to be reliable, but we cannot guarantee their accuracy or completeness. All such information is subject to change at any time without notice. IC Markets assumes no responsibility for the content of any linked site. The fact that such links may exist does not indicate approval or endorsement of any material contained on any linked site.
IC Markets is not liable for any harm caused by the transmission, through accessing the services or information on this site, of a computer virus, or other computer code or programming device that might be used to access, delete, damage, disable, disrupt or otherwise impede in any manner, the operation of the site or of any user’s software, hardware, data or property.


