
Key risk events today:
UK CPI y/y; UK PPI Input m/m; UK Core CPI y/y; Canada CPI m/m, Common CPI y/y, Median CPI y/y, Trimmed CPI y/y; US Building Permits; US Core PPI m/m; US PPI m/m; FOMC Meeting Minutes.
(Previous analysis as well as outside sources – italics).
EUR/USD:
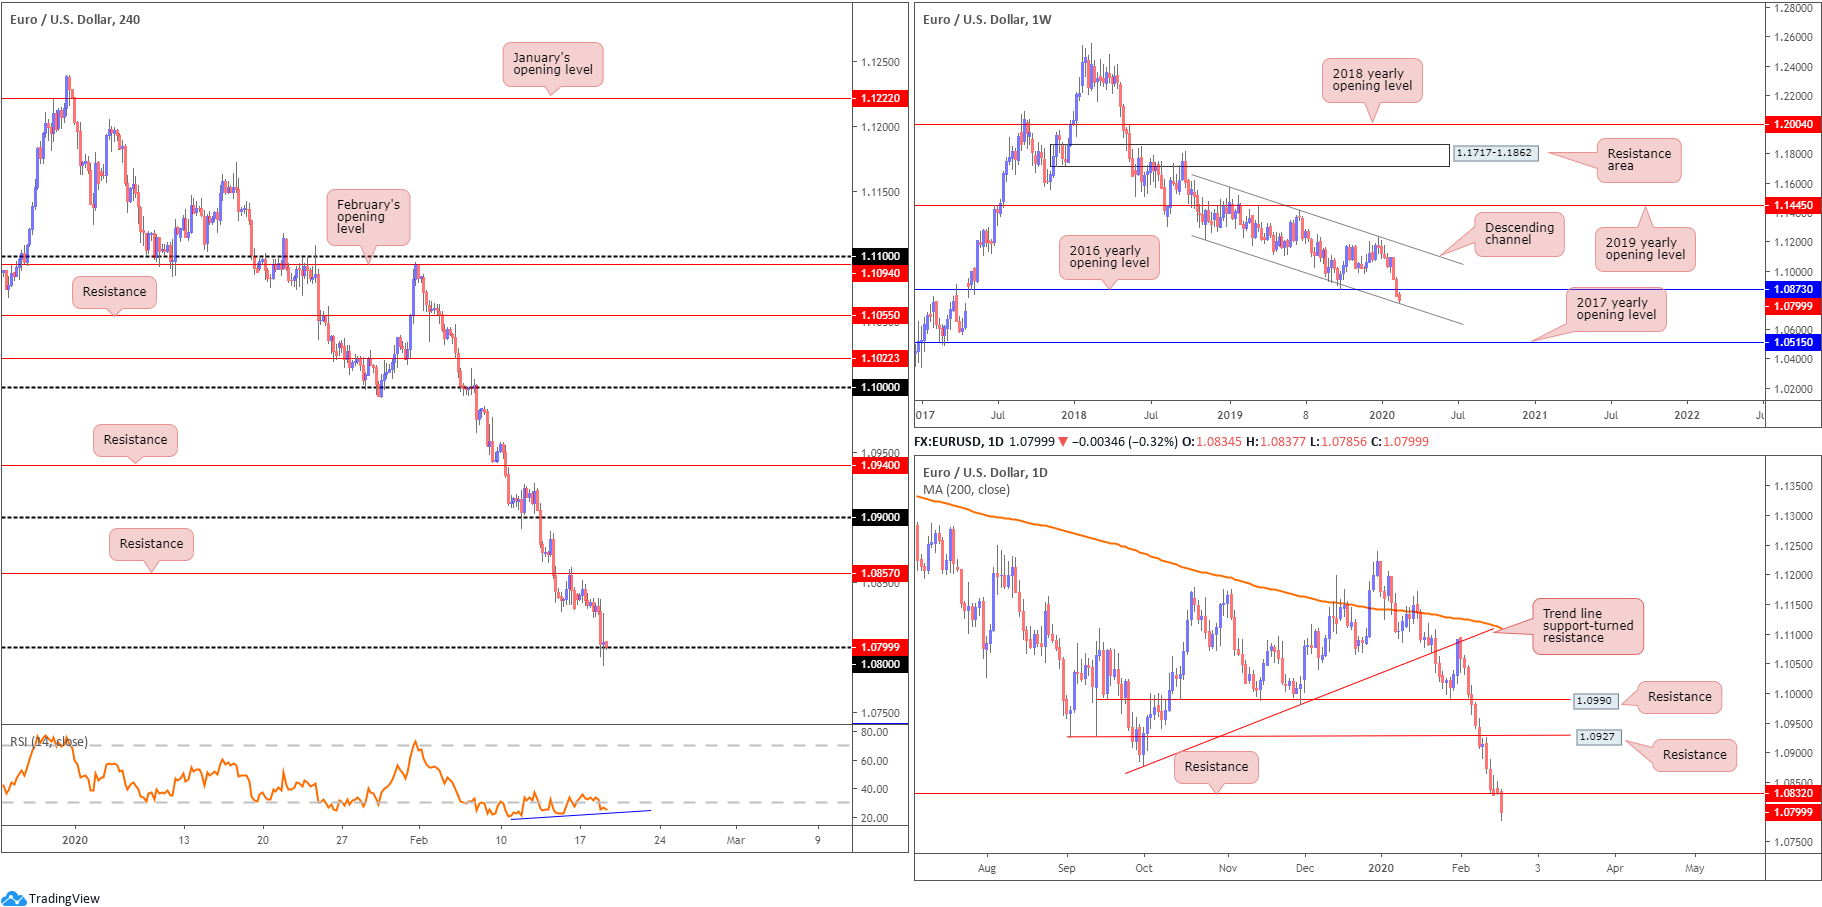
Europe’s shared currency tumbled for a fifth successive session against the buck Tuesday, pulled lower on weak German ZEW Economic Sentiment for February and the Federal Reserve Bank of New York’s Empire State Manufacturing Index also rising sharply in February. With respect to the US dollar index, the unit tested highs just shy of 99.50, closing in on daily resistance around 99.62.
Technically, weekly price extended losses beneath the 2016 yearly opening level from 1.0873 and is poised to shake hands with channel support, taken from the low 1.1109.
Daily flow has price trading below support priced in at 1.0832, now a serving resistance. The next port of call, in terms of supportive structure on the daily timeframe, falls in at 1.0677.
A closer examination of price movement on the H4 timeframe has the candles attempting to grip the 1.08 handle, following last Friday’s retest at resistance from 1.0857. This round number support is also confirmed by the relative strength index (RSI) producing mild bullish divergence (blue line). While the next support on this scale can be found at 1.0735, traders may also want to acknowledge the weekly channel support highlighted above hovers just south of the 1.08 level between 1.0770/80.
Areas of consideration:
1.08, while a downside target for any short sales off 1.0857, is also a potential barrier of support, having seen channel support on the weekly timeframe coincide closely with the round number (1.0770/80).
A dip through 1.08, triggering sell-stop liquidity, to the aforementioned channel support on the weekly timeframe is certainly a scenario worth keeping an eye out for. A test at the weekly channel support followed up with a close above 1.08 would, for most price-action based traders, be considered a reliable countertrend signal to the upside, with daily resistance at 1.0832 positioned as the initial upside target.
GBP/USD:
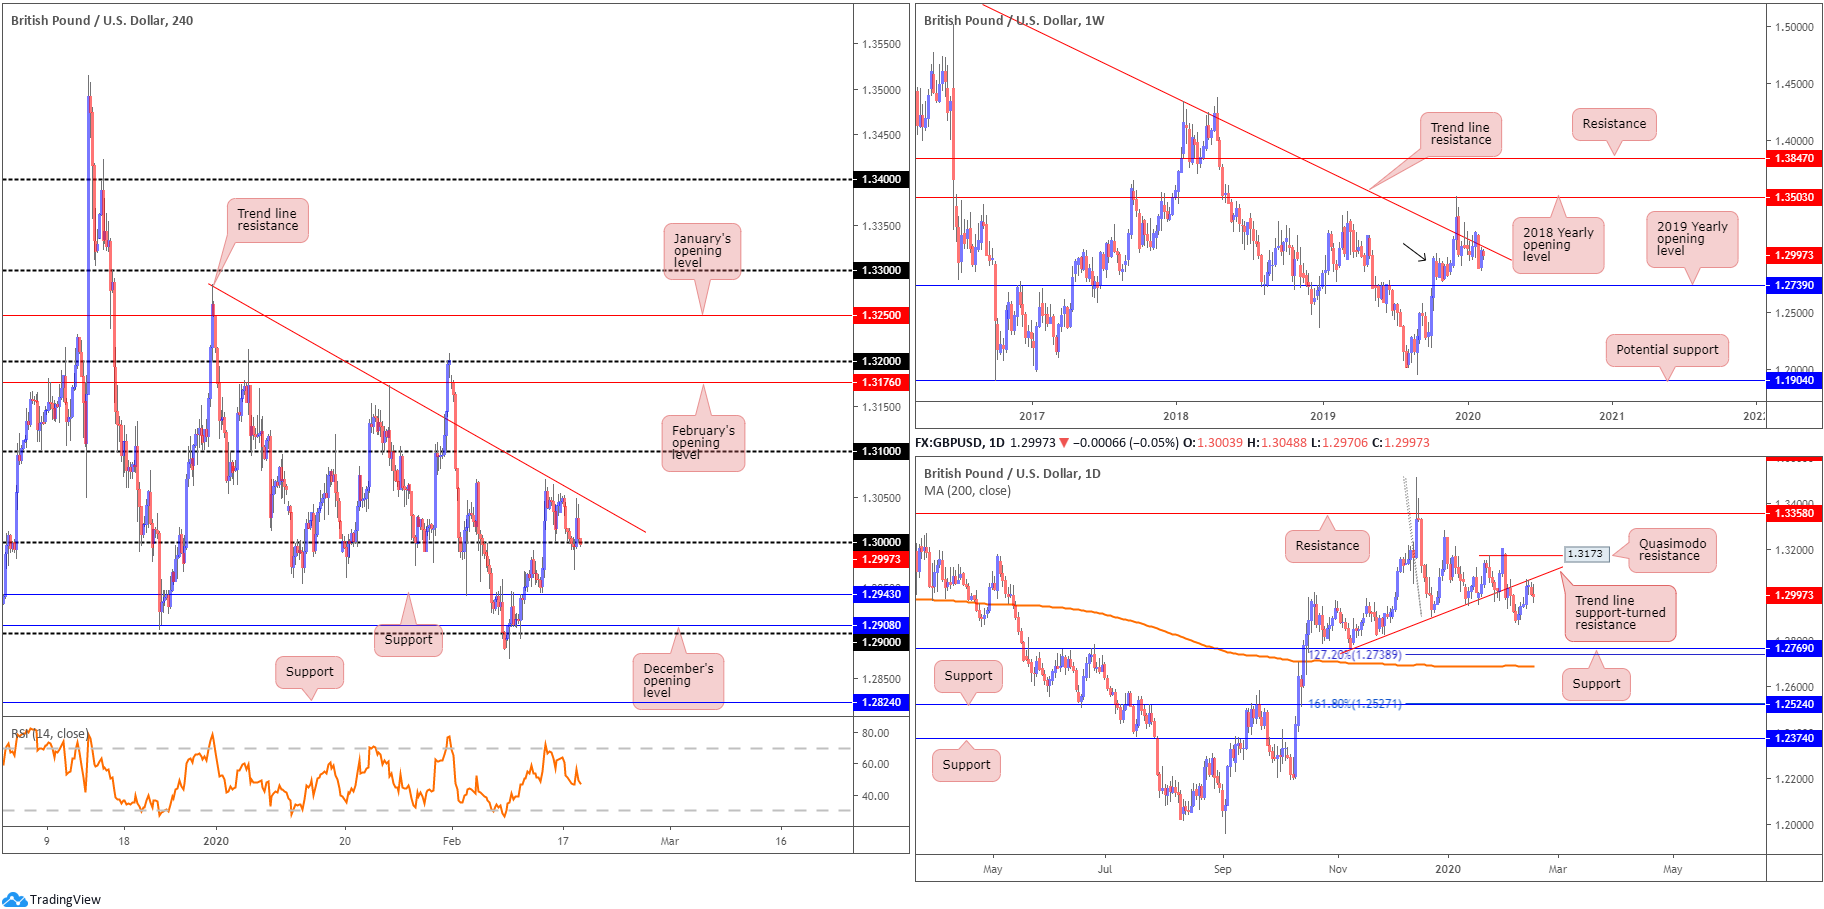
Despite marking a range between 1.3048/1.2970, GBP/USD wrapped up Tuesday unmoved, consequently chalking up a doji indecision candle on the daily timeframe.
1.30 on the H4 timeframe proved a tough nut to crack, in spite of the unit clocking a session low at 1.2970 and likely tripping sell-stop liquidity. While there were very clearly traders attempting to fade the round number, the run to 1.2970 likely ended that dream. And for those who decided to flip the position and try selling the breakout were also burnt.
H4 trend line resistance, extended from the high 1.3284, is still in sight, as is the 1.31 handle in the event we pop higher. Beyond 1.30, however, key levels of support fall in at 1.2943, December’s opening level at 1.2908 and the 1.29 handle.
On a wider perspective, we have the weekly timeframe languishing beneath long-standing trend line resistance, pencilled in from the high 1.5930, though demand around the 1.2939 region is also still in motion (black arrow). Continued downside may imply a break of the said demand, tripping sell stops and testing the 2019 yearly opening level at 1.2739. A break higher, on the other hand, could see the 2018 yearly opening level enter the fight at 1.3503.
Last week on the daily timeframe ended at the underside of a trend line support-turned resistance, extended from the low 1.2768. Although sellers stepped in on Monday and appeared poised to challenge lower levels, daily price signified hesitance on Tuesday. Aside from the 1.2872 February 10th low, further selling may set the stage for a run to support fixed at 1.2769, a 127.2% Fibonacci extension at 1.2738 and the 200-day SMA (1.2688). Note the said SMA has been flattening since mid-October 2019.
Areas of consideration:
Short sales off the underside of the current H4 trend line resistance may be an option today, with the expectation of a break below 1.30 to follow. This is simply due to both weekly and daily timeframes displaying trend line resistances close by.
A H4 close below 1.30 may also serve as an entry trigger for some sellers; others may require additional confirmation, such as a retest at 1.30, followed by a H4 bearish candlestick signal (entry and risk levels can be found on the back of the candlestick pattern’s structure).
Irrespective of the entry trigger, immediate support targets can be found on the H4 timeframe, highlighted above in bold.
AUD/USD:
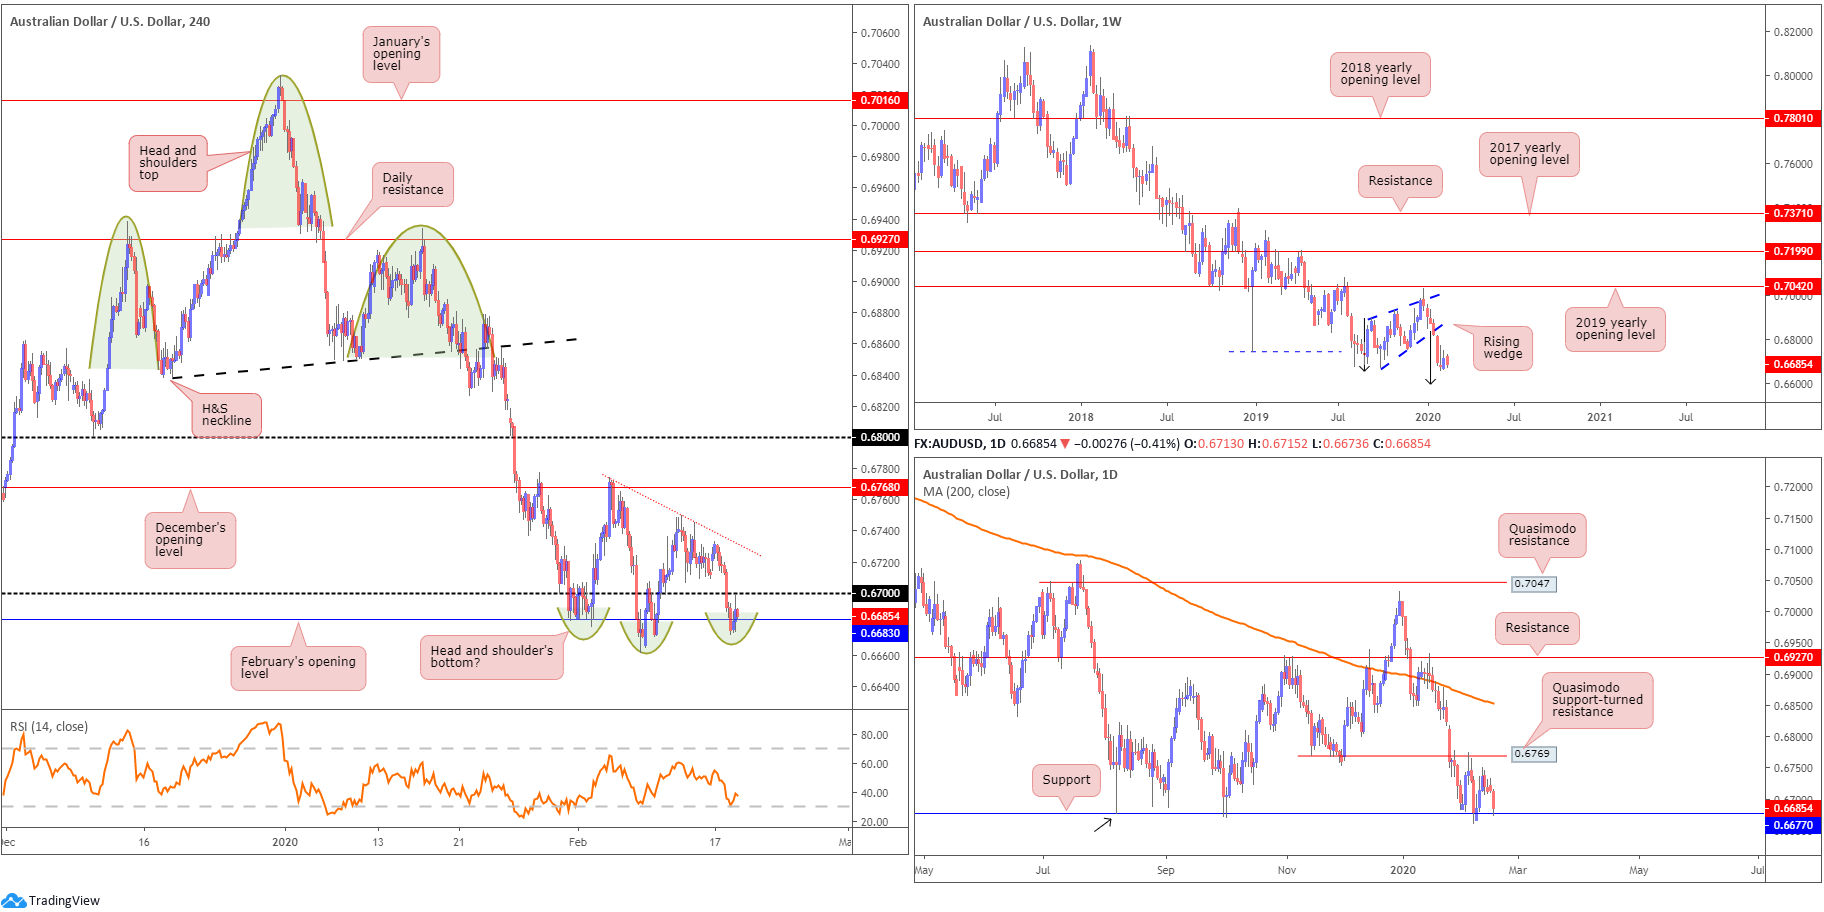
Early hours Tuesday witnessed the Australian dollar plunge lower vs. the US dollar, following RBA meeting minutes. The H4 candles ran through the 0.67 handle with relative ease, clocking a session low at 0.6673 in London, followed by an attempted recovery amid US hours. Despite an earnest attempt to regain lost ground, price topped a few points south of 0.67, turning lower into the close.
H4 structure is seen toying with February’s opening level at 0.6683, echoing the possibility of forming a right shoulder to a head and shoulder’s bottom formation (green arcs) – the neckline is seen between the 0.6774 February 5th high and the 0.6750 February 12th high.
The story on the weekly timeframe remains unchanged. Since registering a bottom in late September at 0.6670 (2019), weekly price carved out a rising wedge formation, typically considered a continuation pattern within a trending environment. The past six weeks witnessed price decline back into the rising wedge and extend beyond the lower boundary. With the primary downtrend having been in full force since topping at 0.8135, in early 2018, further downside is possible, despite last week’s modest recovery. Assuming a close beneath the 0.6670 September 30th low, the rising wedge take-profit (black arrows – calculated by taking the height of the base and adding it to the breakout point) is seen at 0.6599, followed by support at 0.6359 (not visible on the screen).
The daily timeframe has buyers and sellers squaring off at support drawn from 0.6677, after a failed attempt to reach Quasimodo support-turned resistance at 0.6769. The next support target beyond 0.6677, in the event of further selling, falls in around 0.6508 (not visible on the screen).
Areas of consideration:
Weekly price invites further selling, according to our chart studies, suggesting a move south of 0.67 on the H4 timeframe to 0.66 (not visible on the screen). Daily price could, nonetheless, defend support at 0.6677 and reinforce a possible H4 H&S bottom pattern.
Either scenario is possible, though further selling being the more likely theme given the primary downtrend and the weekly timeframe’s structure usually taking precedence over the lower timeframes. Therefore, keep eyes on 0.67 for retest scenarios today, though consider waiting for additional candlestick confirmation to form before pulling the trigger as daily price could still attempt a recovery off support off 0.6677.
USD/JPY:
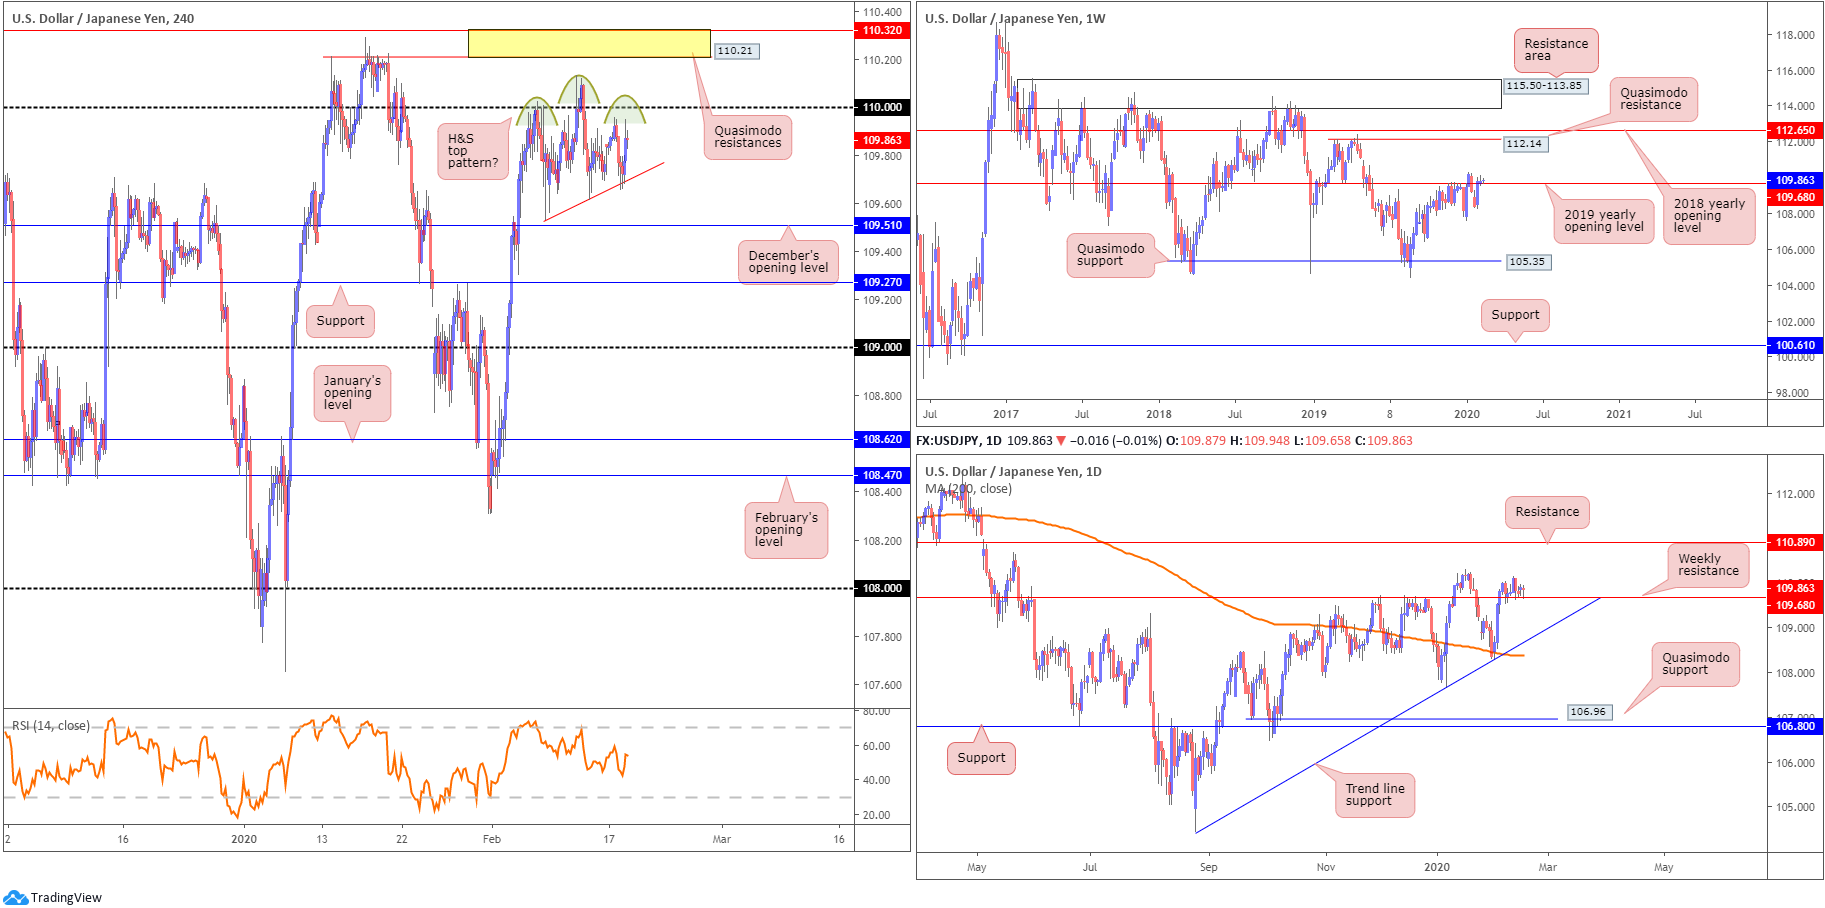
The US dollar eked out modest upside against the Japanese yen Tuesday, following recovery gains off session lows at 109.65. The Federal Reserve Bank of New York’s Empire State Manufacturing Index rose sharply in February, elevating the broad dollar index higher, along with USD/JPY.
With respect to the weekly timeframe, the pair continues to hover a few points above the 2019 yearly opening level at 109.68. As evident from the weekly chart, though, buyers lacked enthusiasm last week. A decisive push north of the said barrier underlines a possible approach towards Quasimodo resistance at 112.14, closely followed by the 2018 yearly opening level at 112.65. A significant rejection, however, could entice moves to the 107.65 January 6th low. Beneath the aforementioned low, limited support is evident until reaching the 106.48 September 30th low, followed by Quasimodo support coming in at 105.35.
Technical action on the daily timeframe continues to offer a somewhat non-committal tone off the top edge of the recently broken weekly resistance at 109.68. Failure to hold has trend line support, extended from the low 104.44, in view, followed by the 200-day SMA (orange – 108.38). Moves higher, on the other hand, could have resistance at 110.89 enter the mix.
Across the page on the H4 timeframe we have a possible right shoulder (complex right shoulder?) for a head and shoulder’s top (green arcs) forming, south of the round number 110. The ascending red line, assuming respect below 110, should act as the pattern’s neckline. Outside of this configuration, two layers of Quasimodo resistances are seen at 110.32 and 110.21 (yellow). Downside supports also remain located at December’s opening level drawn from 109.51, support at 109.27 and the 109 handle.
Areas of consideration:
Based on the weekly timeframe’s structure, the 2019 yearly opening level at 109.68 remains a probable resistance. Recent movement above the aforementioned level is not a cause for concern (for those with long-term shorts, that is) given the recent weekly close above the level is less than 10 points, and unlikely sufficient to excite breakout buying.
Daily price shows the unit retesting the weekly level as support, but has yet to pencil in anything of note to the upside, therefore pushing buyers to the sidelines for now.
This leaves H4 movement, which, as highlighted above, threatens a possible retest at 110 and formation of a right shoulder to a head and shoulder’s top. This, according to the pattern’s rules of engagement, is only active ONCE the neckline has been penetrated. Aggressive traders, nonetheless, may try to forecast the right shoulder and secure more favourable risk/reward.
USD/CAD:
Canadian manufacturing sales unexpectedly sank in December, a disappointing end to an already weak year for the sector. In addition, the Federal Reserve Bank of New York’s Empire State Manufacturing Index rose sharply in February, elevating the dollar across the board Tuesday.
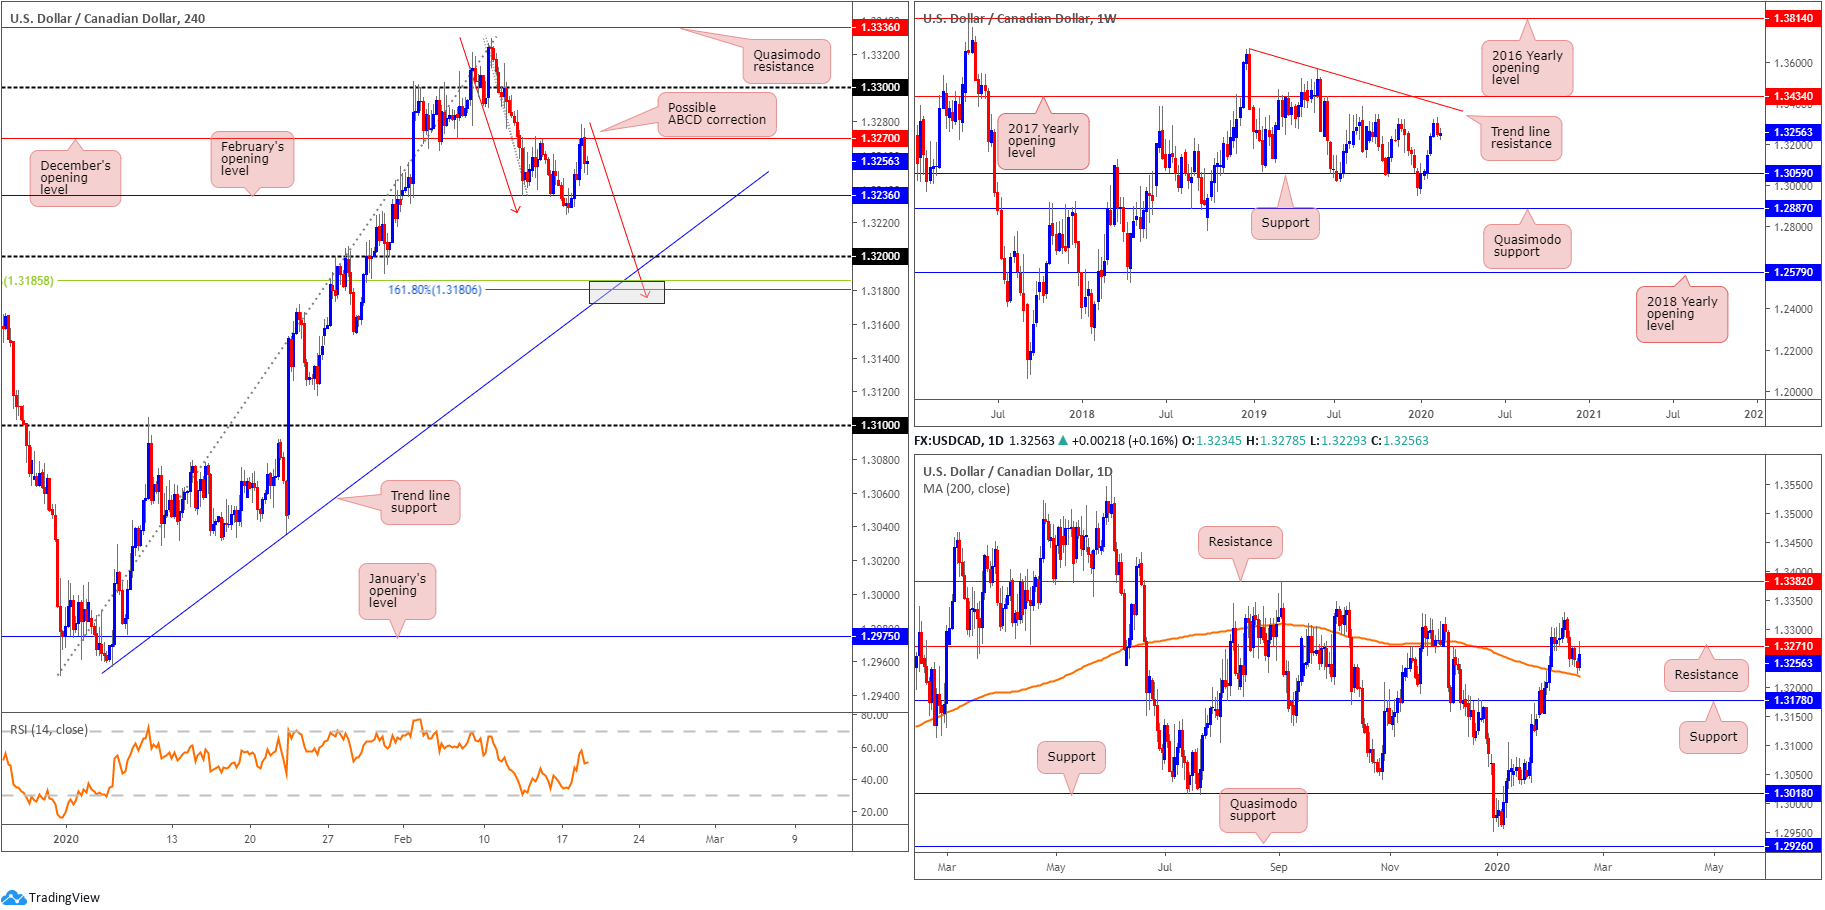
The two reports, released simultaneously, prompted a USD/CAD bid to highs at 1.3278, before declining into the close. Following this, we may have a possible 161.8% ABCD (red arrows) correction at hand, terminating south of the round number 1.32 at 1.3180. Also worthy of note is the closely converging trend line support, etched from the low 1.2957 and a 38.2% Fibonacci retracement at 1.3185 (grey zone).
Further afield, we can see weekly price remains pretty much unchanged, in terms of structure. Price on the weekly timeframe halted just south of tops around 1.3340 last week. Additional resistance resides at a trend line formation (1.3661) and the 2017 yearly opening level at 1.3434. Support can be found around the 1.3059 neighbourhood.
In conjunction with weekly flow, the daily timeframe recently overthrew support at 1.3271 and retested the level as resistance yesterday. Downside has the 200-day SMA (orange – 1.3219) as potential support, with a break perhaps unlocking the trapdoor to a well-rounded support from 1.3178.
Areas of consideration:
Owing to yesterday’s response off December’s opening level at 1.3270 on the H4 and off daily resistance at 1.3271, a break south of February’s opening level at 1.3236 may excite intraday selling today, targeting 1.32 and the H4 ABCD correction around 1.3180. However, caution to the downside is warranted knowing the 200-day SMA, currently circling the 1.3219ish region, could also offer support.
Longs off 1.3180 are also likely on the watchlists of some traders; however, most will want to view a close back above 1.32 before committing.
USD/CHF:
Broad-based USD bidding, bolstered on the back of upbeat business activity picked up in New York State, according to firms responding to the February 2020 Empire State Manufacturing Survey, bolstered USD/CHF Tuesday, adding more than 20 points, or 0.25%.
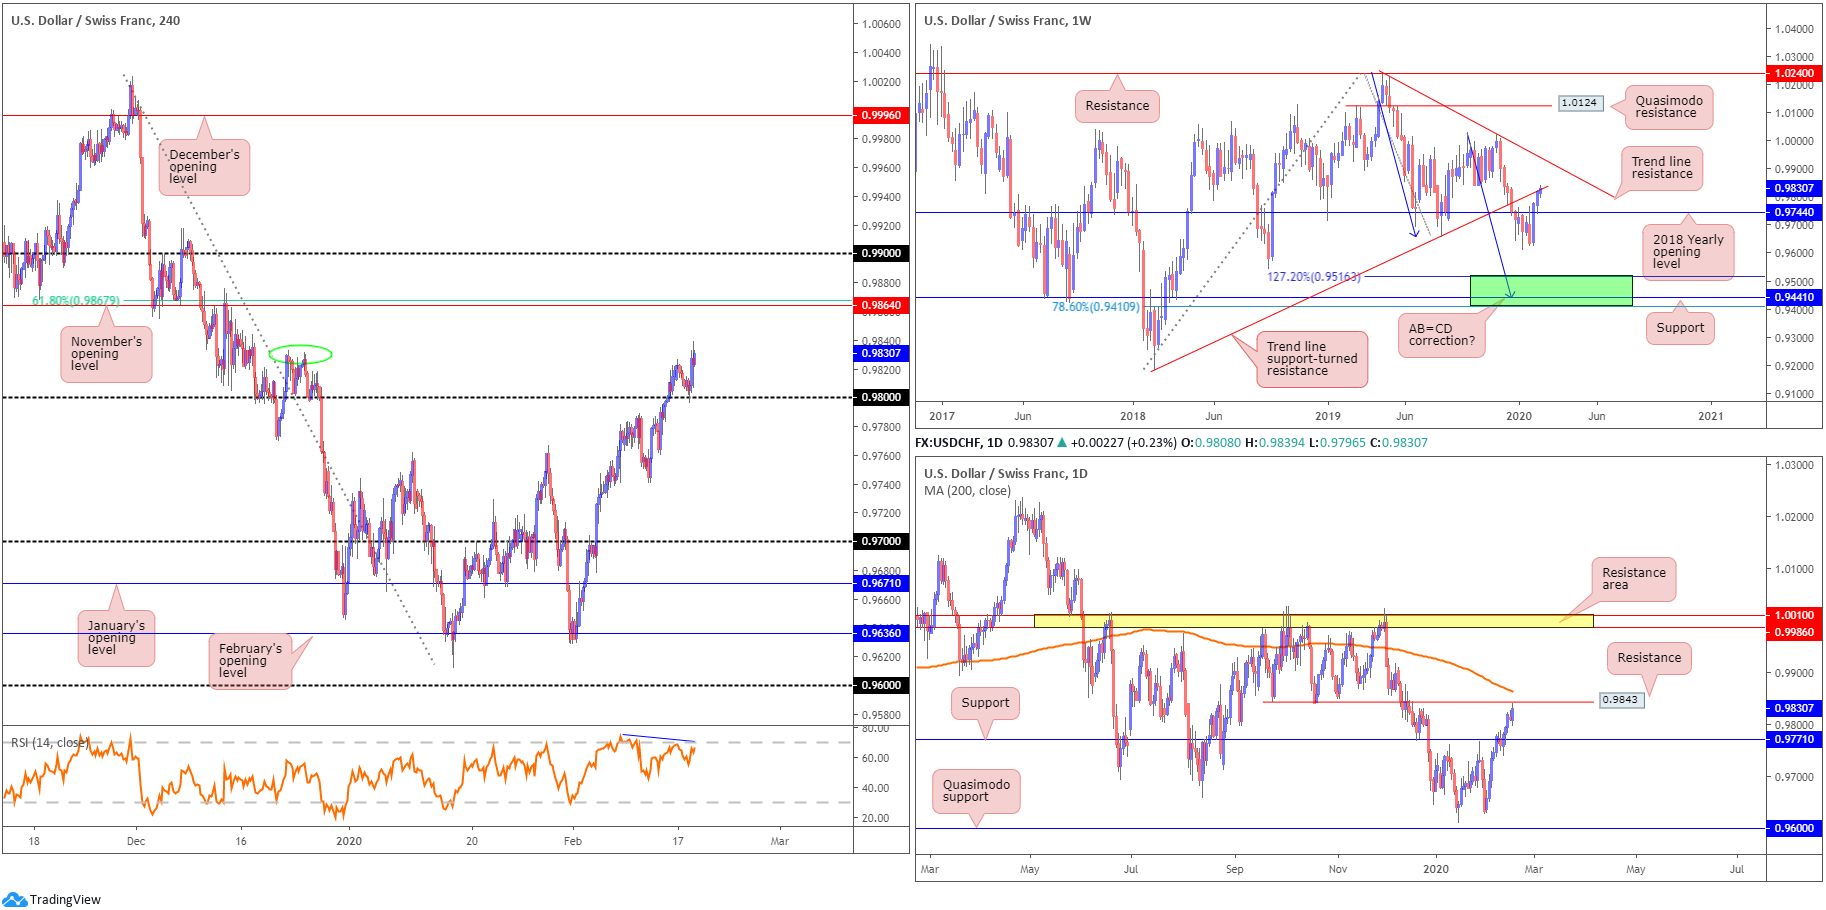
From the weekly timeframe, traders can see the trend line support-turned resistance, drawn from the low 0.9187, is under pressure, thanks to recent buying. Trend line resistance, etched from the high 1.0236, is next in line in terms of long-term resistance targets.
On to the daily timeframe, resistance at 0.9843 is stationed within touching distance, closely trailed by the 200-day SMA (orange – 0.9864). This follows last week’s break of resistance at 0.9771, now a serving support base. Continued bidding through the said resistances may encourage additional US dollar upside to a resistance area coming in at 1.0010/0.9986.
Tuesday saw the H4 candles retest 0.98, almost to-the-point in the shape of a half-hearted hammer candlestick pattern (a bullish signal at troughs), and advance to highs at 0.9839. This was a noted scenario to keep an eye on in Tuesday’s technical briefing, therefore well done to any reader who took advantage of this move here. Local tops around 0.9830 (green oval) are currently in play, with a break possibly clearing the path for a run to November’s opening level at 0.9864. What’s interesting is this level also comes with a 61.8% Fibonacci retracement at 0.9867 and the said 200-day SMA. Indicator-based traders may also wish to acknowledge we still view the relative strength index (RSI) as producing bearish divergence.
Areas of consideration:
Traders long the 0.98 retest on the H4 timeframe may consider reducing risk to breakeven after price tested H4 tops at 0.9830ish, and came within a whisker of testing daily resistance at 0.9843. Ultimately, though, the next upside target on the H4 timeframe rests at 0.9864.
Not only is 0.9864 an upside target, the level could also represent a sell zone. Aligning closely with the 200-day SMA and a H4 61.8% Fibonacci retracement, a pullback from here is considered high probability, targeting 0.9830ish as the initial downside target, followed by 0.98.
Dow Jones Industrial Average:
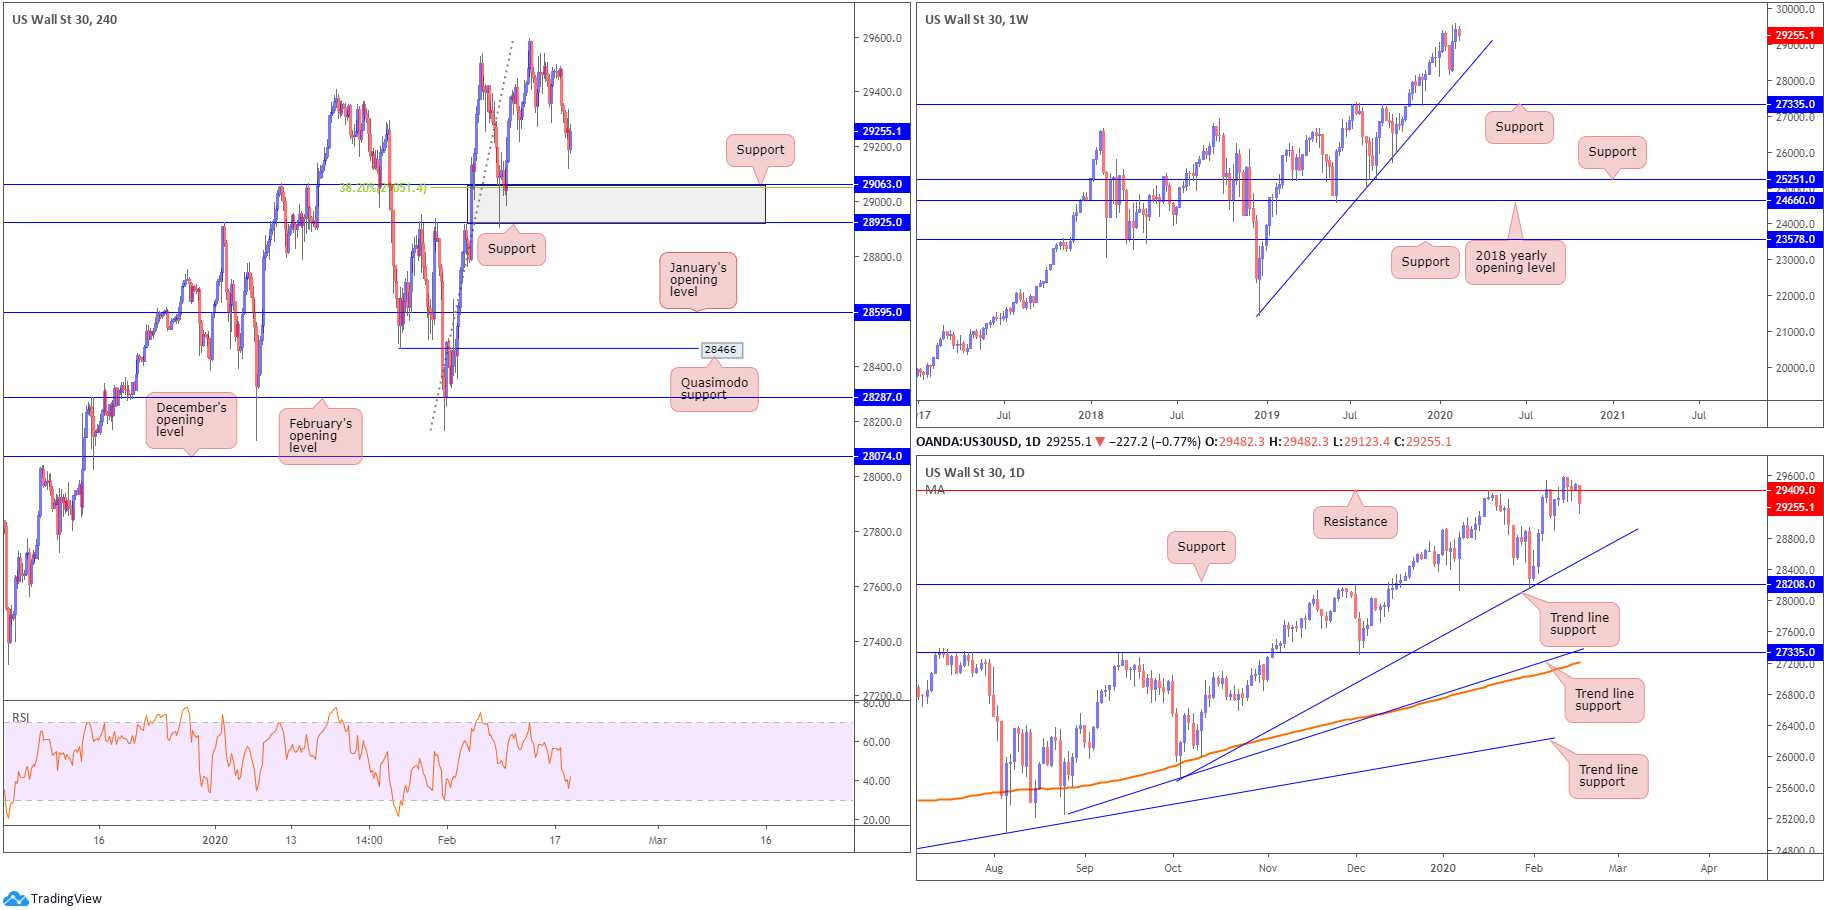
Tuesday had the average lower following Apple’s warning that disruption in China from the coronavirus will mean revenues falling short of forecasts. The Dow Jones Industrial Average erased 165.89 points, or 0.56%; the S&P 500 lost 9.87 points, or 0.29% though the tech-heavy Nasdaq 100 ended higher by 6.22 points, or 0.06%.
From a technical perspective, the H4 timeframe eyes a support area coming in at 28925/29063 (grey), which houses a 38.2% Fibonacci value at 29051. South of here, January’s opening level at 28595 is in the offing, as is Quasimodo support at 28466. Indicator studies has the relative strength index (RSI) poised to shake hands with oversold levels.
Further out, the weekly candles remain in a healthy position north of trend line support, taken from the low 21452. Outside of the aforementioned trend line, support rests at 27335.
Closer analysis of price action on the daily timeframe has current action exploring ground beneath support at 29409, now a serving resistance. Should sellers strengthen their grip, trend line support, extended from the low 25710, may enter view, with a break possibly clearing the pathway to support coming in at 28280.
Areas of consideration:
Though daily support recently broke down, with downside estimating a move to trend line support, the H4 support area at 28925/29063 remains in the fold and could see price action garner backing from the zone.
Traders who feel the daily timeframe’s recent actions may affect a long entry from 28925/29063 could seek further confirmation before pulling the trigger. This could be something as simple as a bullish candlestick signal, to a more complex harmonic bullish pattern on the lower timeframes. It’s trader dependent.
XAU/USD (GOLD):
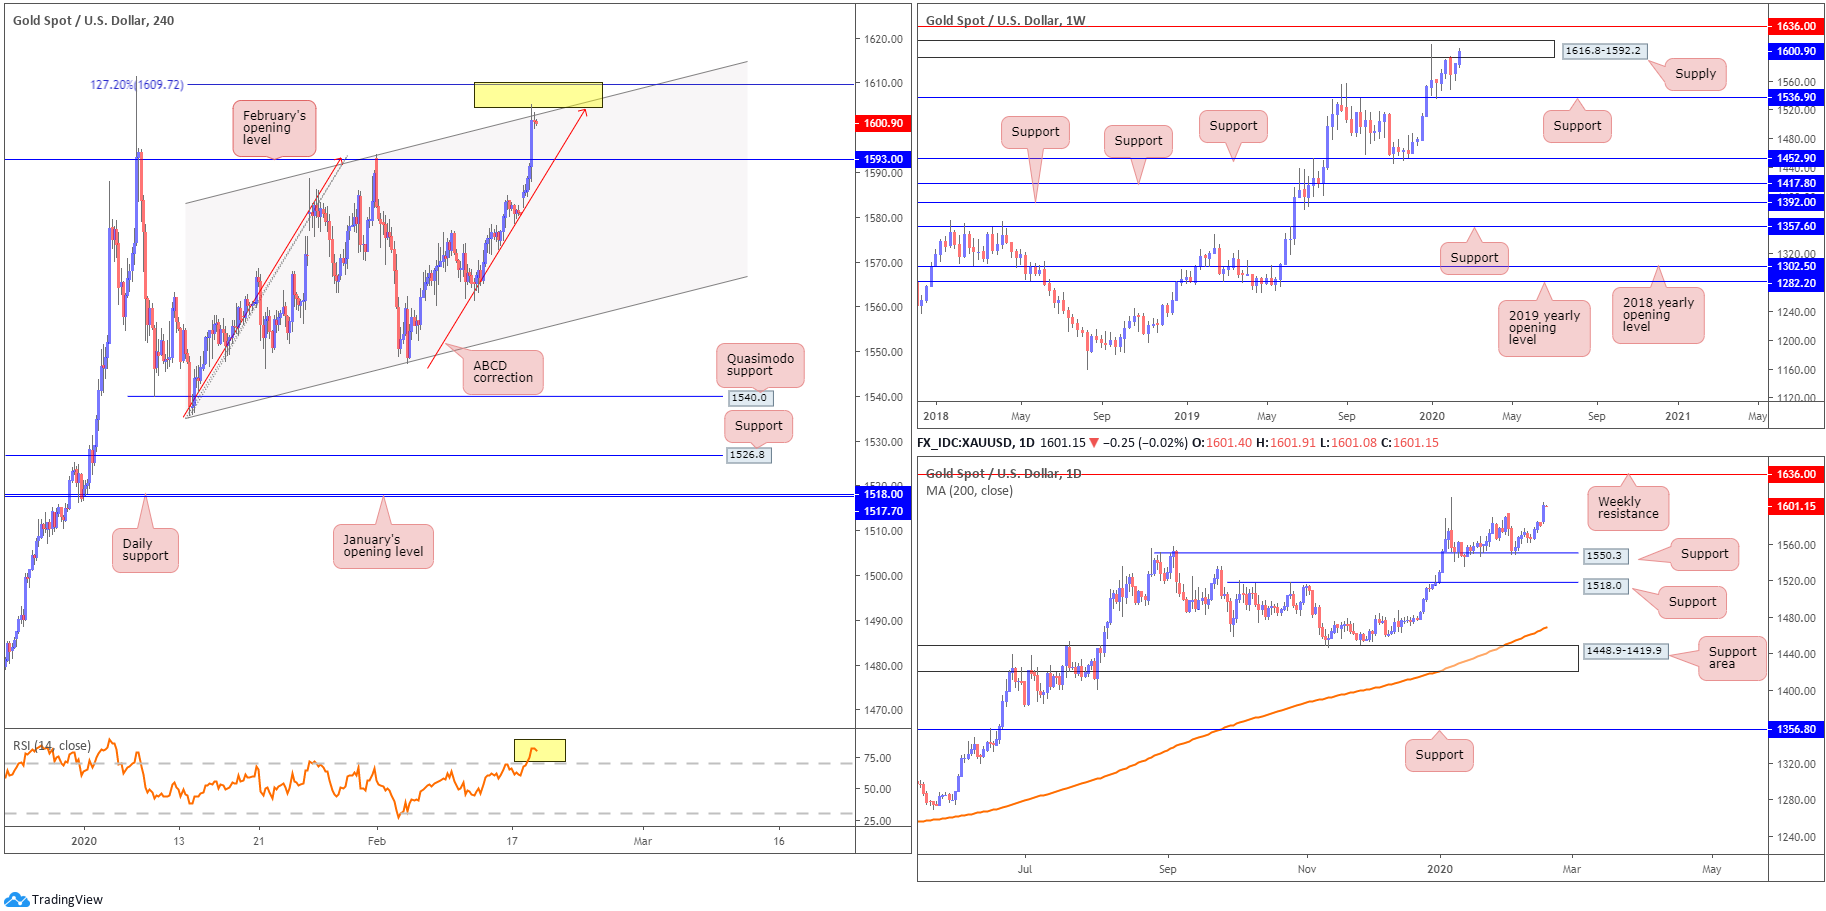
Demand for the yellow metal increased against the US dollar Tuesday, scoring highs at 1605.1, levels not seen since the beginning of this year. Technically, this has placed us at an interesting juncture.
Although the primary trend remains strong and in motion since late 2015, structure has a weekly supply zone in view at 1616.8-1592.2, following a rebound off weekly support at 1536.9 mid-January. Further bidding, however, may reveal resistance at 1636.0.
Closer analysis of price action on the daily timeframe has the unit extending recovery gains off support at 1550.3, fixed north of another layer of support at 1518.0. Aside from the 1611.3 January 8th high, held by an area of supply drawn from mid-February 2013, the next level of resistance falls in on the weekly timeframe mentioned above at 1636.0.
Over on the H4 timeframe, potentially interpreted as a bearish signal, we have a recently completed ABCD correction at 1604.4 (red arrows), which happens to converge with a channel resistance, taken from the high 1593.9, and a nearby 127.2% Fibonacci extension at 1609.7 (yellow). What’s also notable from a technical perspective is the relative strength index (RSI) testing overbought territory, currently trading north of 80.00.
Areas of consideration:
Keeping things simple this morning, the combination of H4 structure around 1604.0ish, encapsulated within weekly supply, is likely enough to generate an intraday pullback to at least February’s opening level at 1593.0
Conservative traders may seek additional confirmation before pulling trigger, as let’s not forget the primary trend remains healthy.
The accuracy, completeness and timeliness of the information contained on this site cannot be guaranteed. IC Markets does not warranty, guarantee or make any representations, or assume any liability regarding financial results based on the use of the information in the site.
News, views, opinions, recommendations and other information obtained from sources outside of www.icmarkets.com.au, used in this site are believed to be reliable, but we cannot guarantee their accuracy or completeness. All such information is subject to change at any time without notice. IC Markets assumes no responsibility for the content of any linked site.
The fact that such links may exist does not indicate approval or endorsement of any material contained on any linked site. IC Markets is not liable for any harm caused by the transmission, through accessing the services or information on this site, of a computer virus, or other computer code or programming device that might be used to access, delete, damage, disable, disrupt or otherwise impede in any manner, the operation of the site or of any user’s software, hardware, data or property.


