
Key risk events today:
OPEC-JMMC Meetings; Crude Oil Inventories; FOMC Meeting Minutes.
(Previous analysis as well as outside sources – italics).
EUR/USD:
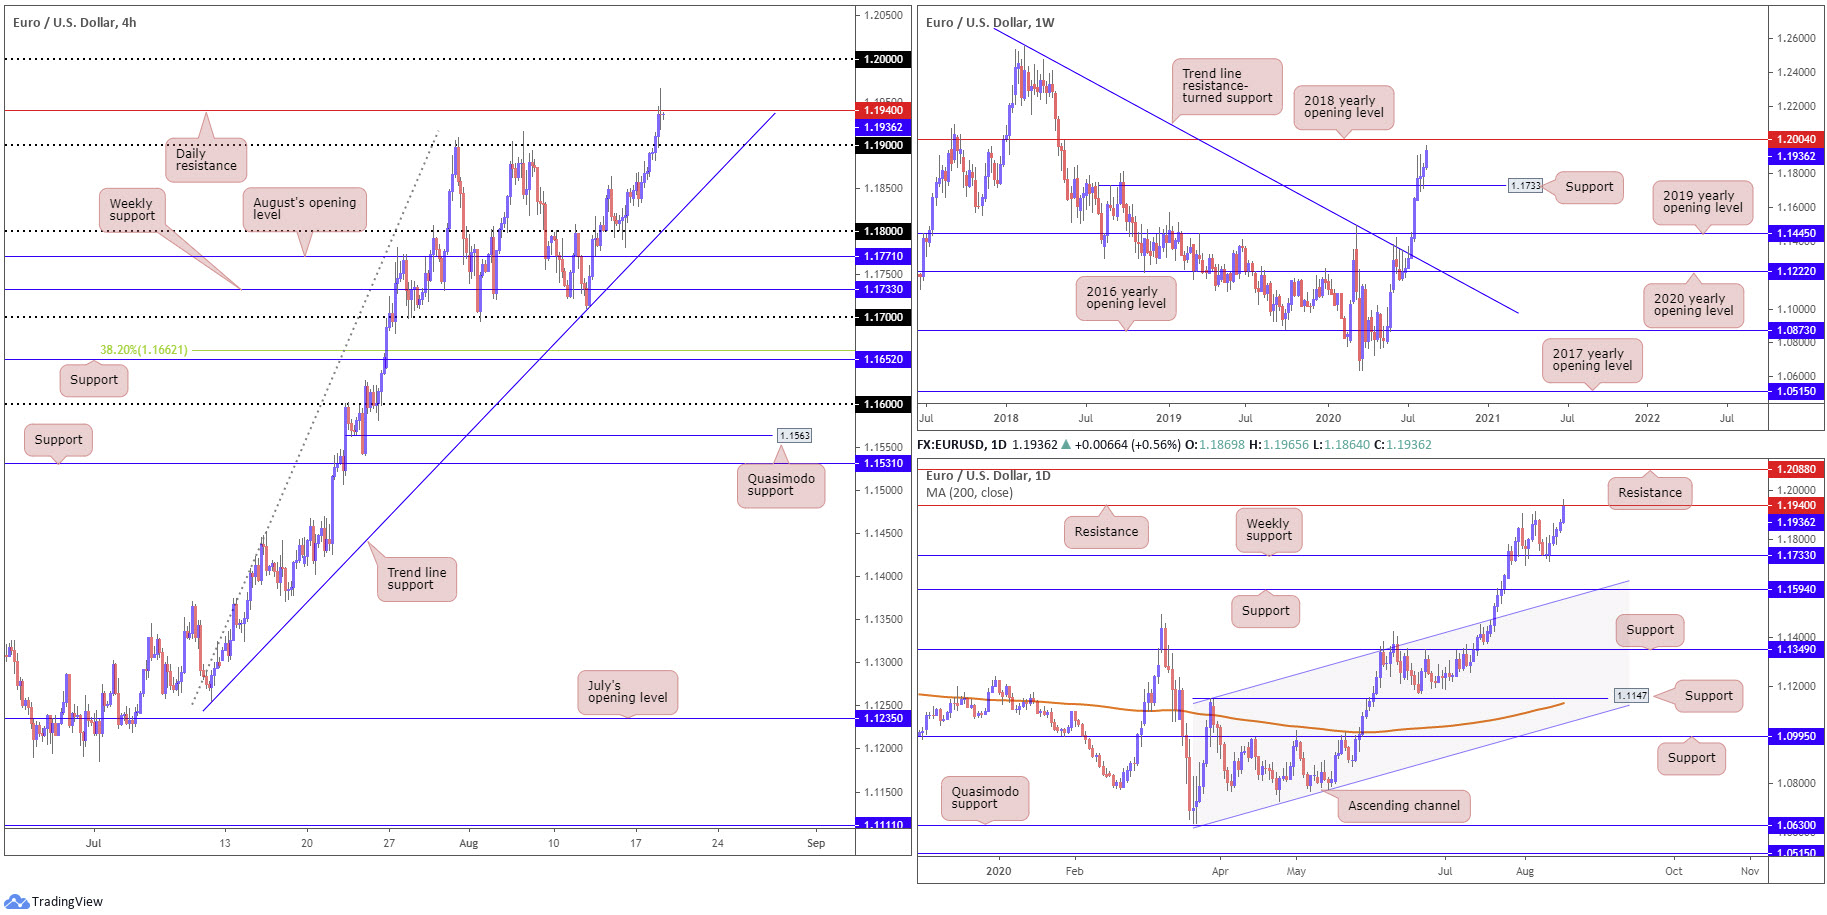
Further declines in US Treasury yields and persistent USD softness – the US dollar index crunched through 92.50 – witnessed Europe’s shared currency extend recovery gains Tuesday. Posting fresh pinnacles at 1.1965 and registering a sixth consecutive daily gain, 1.19 resistance moved aside on the H4 timeframe leaving the pair free to connect with daily resistance at 1.1940.
Recent bidding also shines the spotlight on weekly resistance by way of the 2018 yearly opening level at 1.2004, followed by daily resistance positioned at 1.2088 (above 1.1940). Traders will also want to acknowledge weekly resistance mentioned above at 1.2004 shares its range with the key figure 1.20 on the H4.
Areas of consideration:
For those who read Tuesday’s technical briefing you may recall the following (italics):
Traders long from either 1.1733, the 1.18 breakout or the retest (all noted setups in previous reports) will likely be watching 1.19 as an initial target, followed by daily resistance at 1.1940 and then possibly weekly resistance at 1.2004 (and key figure 1.20 on the H4). Therefore, a break of 1.19 will likely be interpreted as a cue to seek bullish scenarios to at least daily resistance. Likewise, penetrating 1.1940 may also ignite bullish themes to weekly resistance.
Going into the early hours of London yesterday a break of 1.19 occurred, followed by a retest an hour ahead of the US session (check H1) – a move that clearly attracted buyers. Going forward, traders are now likely to watch for a H4 close above daily resistance at 1.1940 to prompt additional bullish themes to the 1.20 handle (H4) and weekly resistance at 1.2004.
GBP/USD:
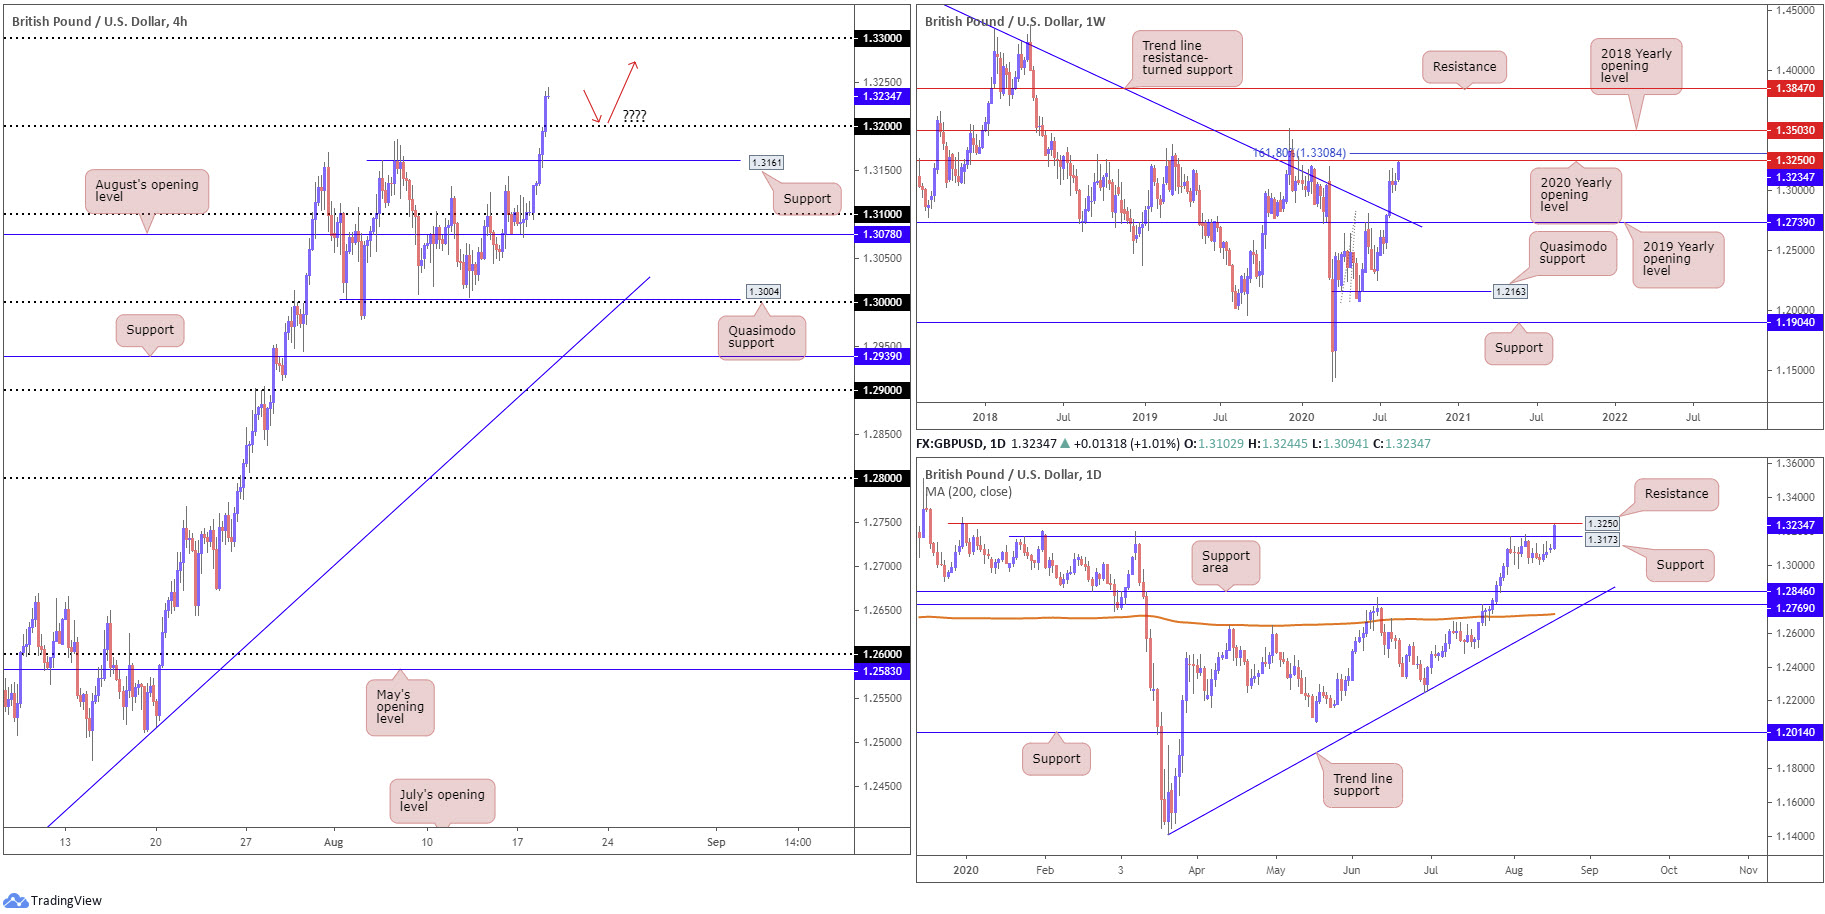
The British pound extended to a fourth consecutive daily gain Tuesday amid an ongoing USD slump and sliding US Treasury yields.
H4 Quasimodo resistance at 1.3161 moved aside (now a serving support), as did the 1.32 handle, potentially setting the technical stage for a run to 1.3284 (December 31 high), closely followed by the 1.33 handle.
From the weekly timeframe, the July 27 trend line resistance (1.5930) break has likely stirred long-term bullish themes. Fresh resistance is seen by way of the 2020 yearly opening level at 1.3250, closely stalked by a 161.8% Fibonacci extension point at 1.3308. Note, thanks to recent buying, 1.3250 is now within striking distance.
Quasimodo resistance at 1.3173 on the daily timeframe was also engulfed yesterday (now a serving support), consequently clearing room for daily resistance at 1.3250, a barrier sharing the same space with resistance on the weekly timeframe, the 2020 yearly opening level. The 200-day SMA (orange – 1.2713) is also showing signs of rotating higher.
Areas of consideration:
Before reaching H4 resistances, the 1.3284 peak and 1.33 handle, buyers must contend with weekly (and daily) resistance plotted at 1.3250, the 2020 yearly opening level.
As a result of this, traders may observe a H4 retest at 1.32 materialise today, with the possibility of also pencilling in a fakeout to H4 support at 1.3161. Buyers will be guarded around this point, (despite the immediate trend pointing north) due to weekly/daily resistances in play.
AUD/USD:
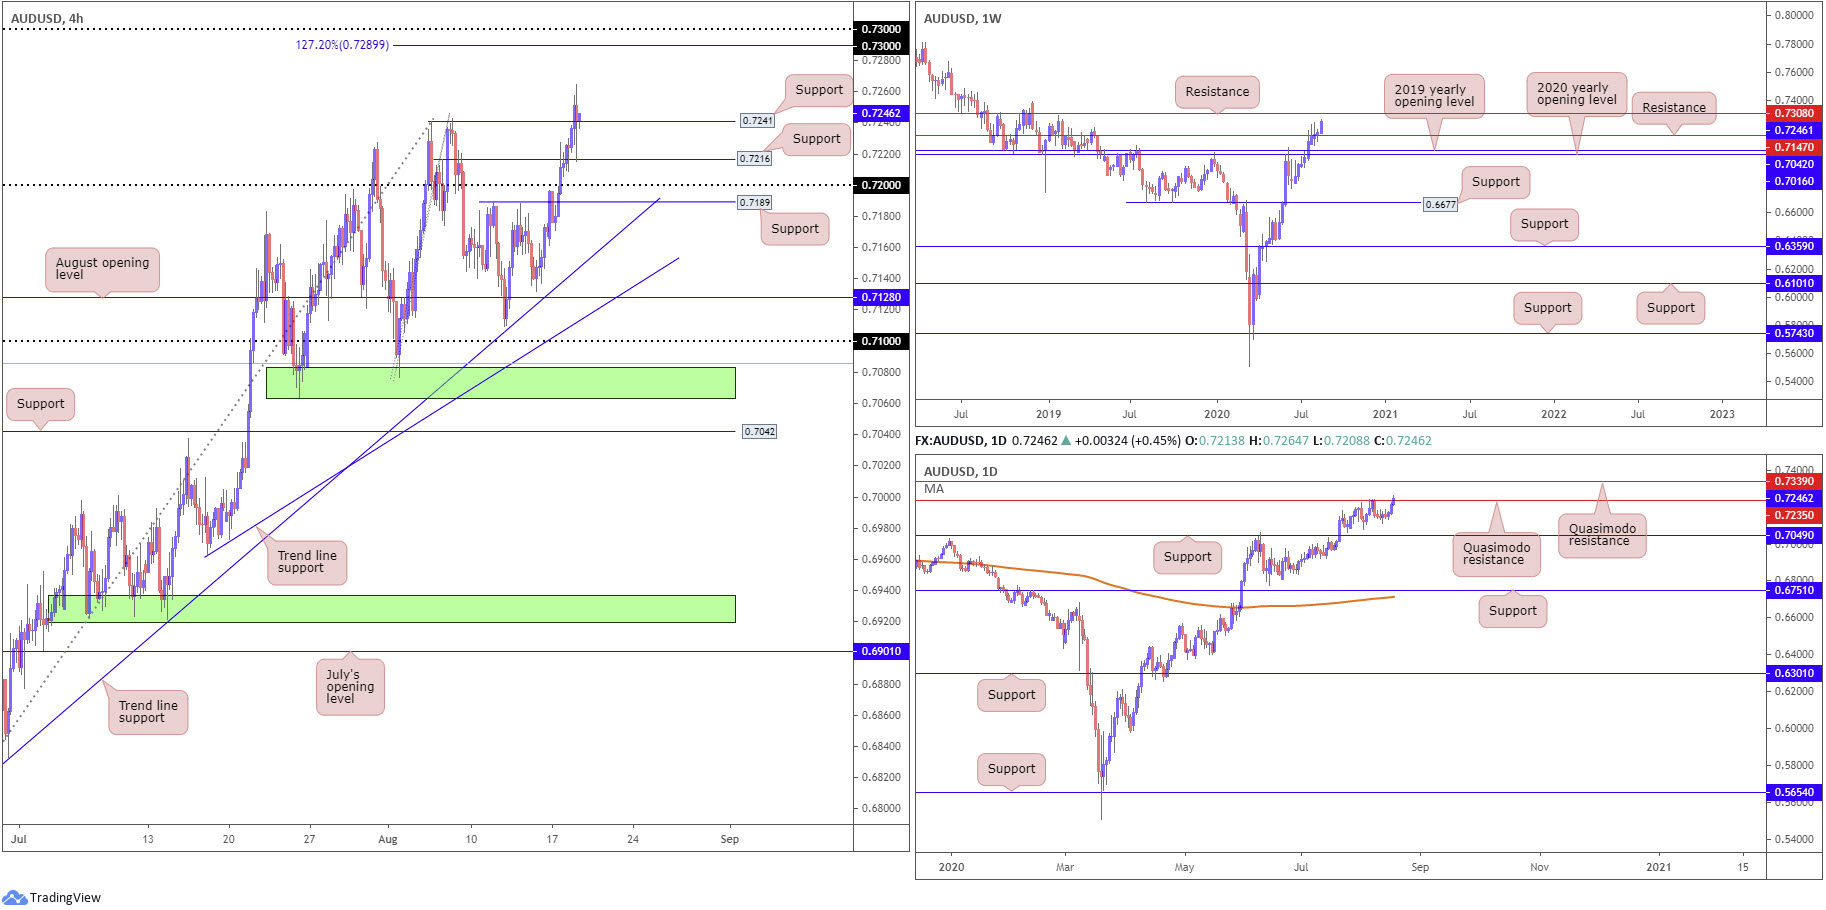
The Australian dollar continued to gather support on the back of persistent USD weakness Tuesday. This had AUD/USD extend space north of 0.72 on the H4 timeframe, with action taking out the 0.7243 peak (August 7) and recently retesting 0.7216 local support. To the upside, H4 resistances can be found at the 127.2% Fibonacci extension point from 0.7290 and the 0.73 base.
Technical structure on the daily timeframe recently walked through Quasimodo resistance at 0.7235. In view of the current trend facing north since March 19, the modest 0.7235 violation emphasises the likelihood of crossing swords with Quasimodo resistance at 0.7339. Price action, based on the weekly timeframe, has, as you can see, made strong headway above resistance at 0.7147 so far this week, swerving moves to resistance at 0.7308 into the range of possibility.
Areas of consideration:
Buyers appear to be in the driving seat, according to technical studies.
The retest at local H4 support from 0.7216 has clearly interested buyers, with enough fuel behind the move to perhaps remove daily Quasimodo resistance at 0.7235. Technical eyeballs, therefore, are likely on the 0.73 handle, a level that not only converges with the 127.2% Fibonacci extension point from 0.7290 (H4), but also weekly resistance parked at 0.7308.
As we write, H4 action is also retesting 0.7241 support, a recently submerged Quasimodo resistance level. This, given the likelihood of climbing to the 0.73ish region, could be a location we see additional buyers make an appearance.
USD/JPY:
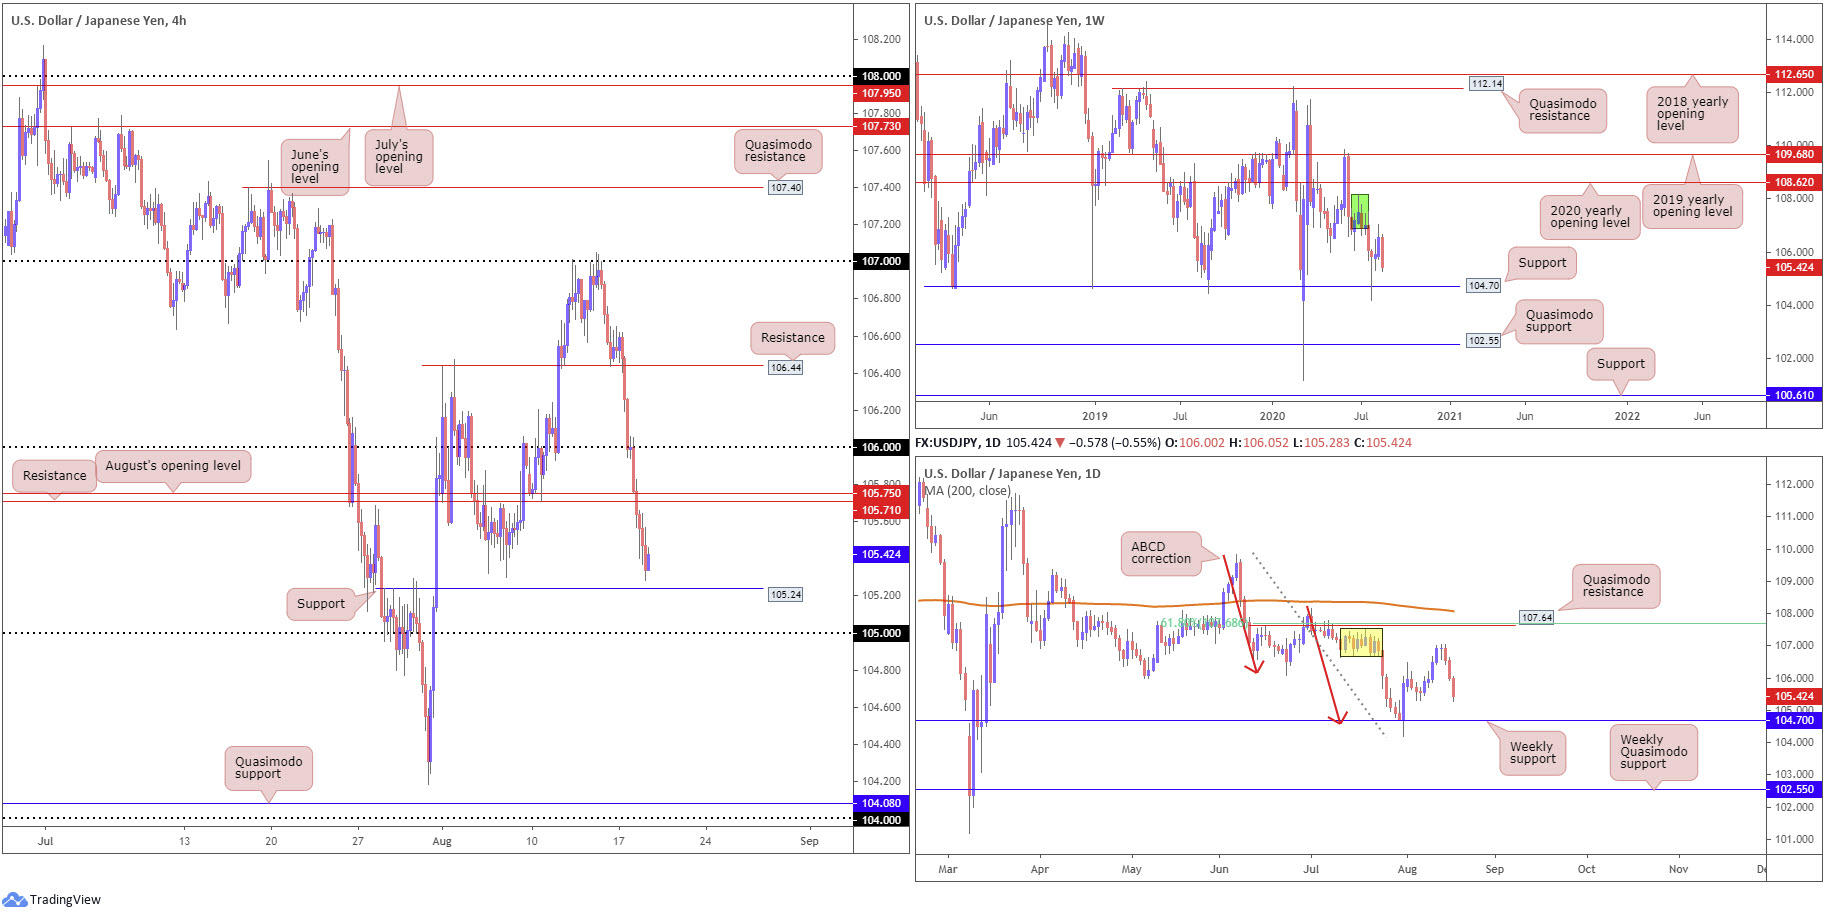
Amidst another wave of USD depreciation and tumbling US Treasury yields, USD/JPY shook hands with near-two-week lows at 105.30 on Tuesday.
Intraday action burrowed through H4 support at 105.71 (now a serving resistance) and August’s opening level at 105.75, bringing light to support at 105.24, a prior Quasimodo resistance level. A break here throws 105 support in the mix.
Further afield, supply at 106.88-108.16 (green) has proven a tough nut to crack on the weekly timeframe. Similarly, on the daily timeframe, supply at 107.54-106.67 (yellow), an area glued to the lower base of the aforementioned weekly supply, also made a show last Friday, with Monday and Tuesday following through and chalking up near-full-bodied daily bearish candles. Downside targets from here expose a possible revisit to weekly support at 104.70.
Areas of consideration:
H4 support at 105.24 could make a stand today, given sell-stop liquidity taken from under 105.30. How much of a reaction will be seen from here, though, is difficult to judge, as the higher timeframes could pressure the unit towards weekly support at 104.70. As such, buyers off 105.24 are likely to adopt a cautious stance and wait for additional confirmation to form before pulling the trigger, such as a bullish candlestick signal.
USD/CAD:
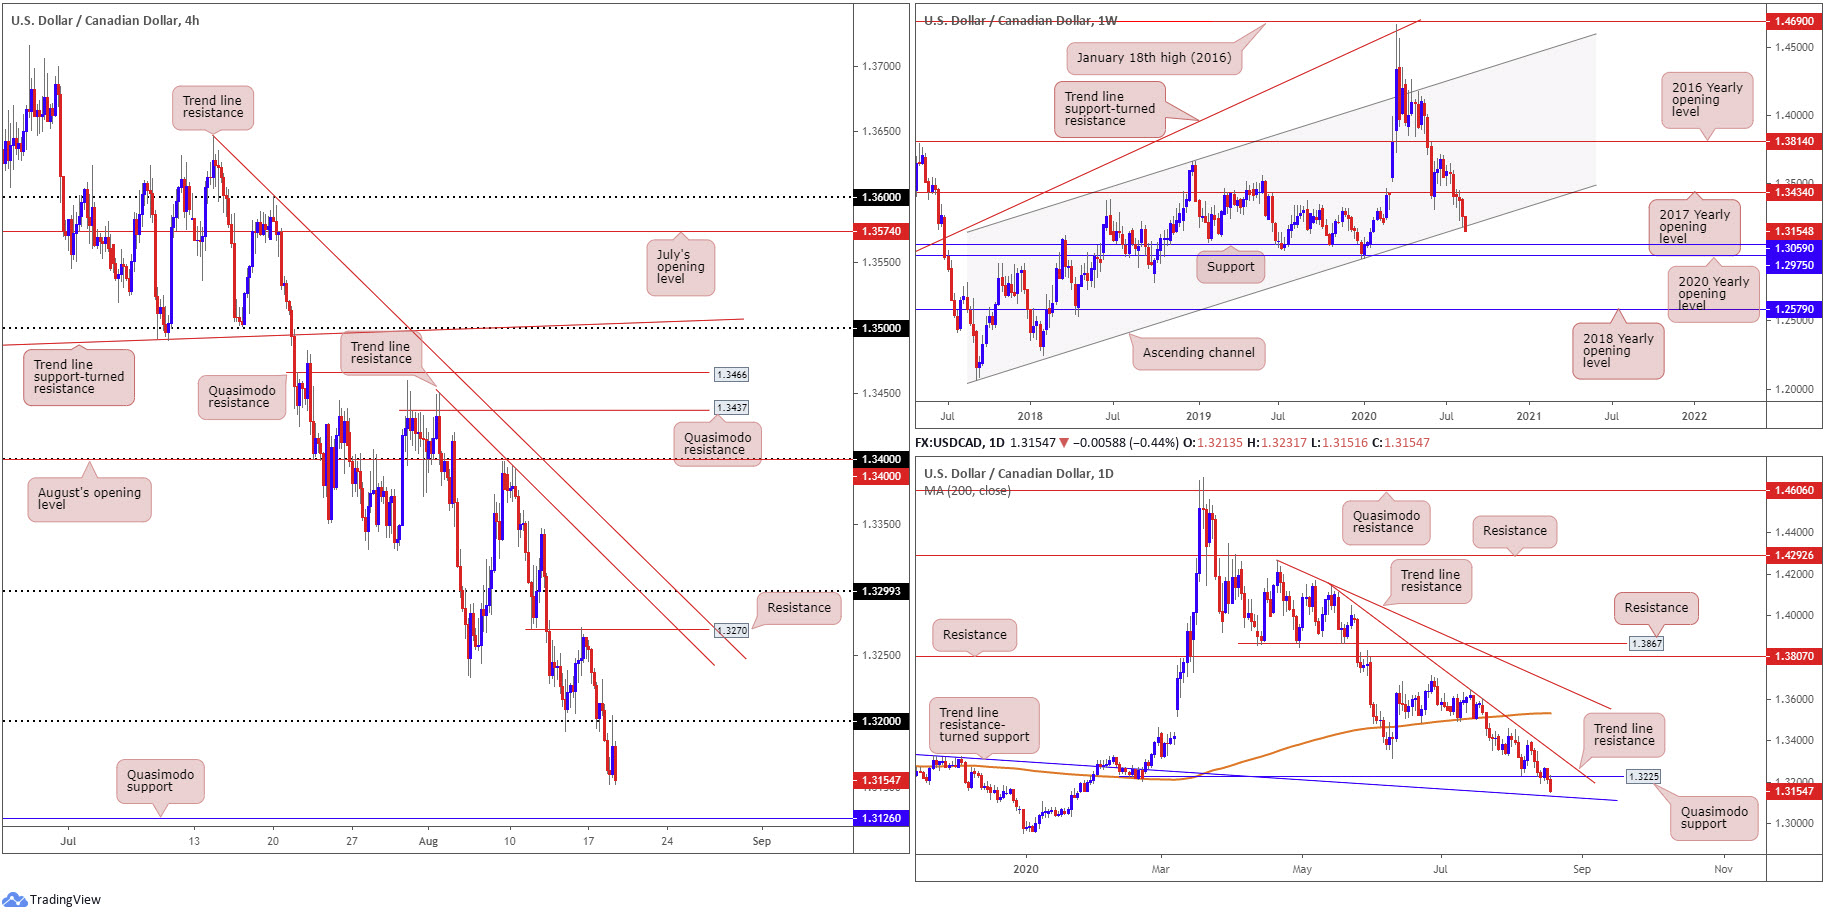
USD/CAD sunk to fresh multi-month lows at 1.3151 on Tuesday, as the US dollar index swept through 92.50 and oil prices were elevated off worst levels ($42.13 a barrel).
From the weekly timeframe, in line with the immediate downtrend, channel support, extended from the low 1.2061, recently ceded ground, with the pair on track to record a sixth consecutive weekly loss. Splitting the channel formation, as evident from the chart, moves support at 1.3059 in sight as a possible downside target.
Quasimodo support at 1.3225 on the daily timeframe put up little fight in recent movement, consequently suggesting a visit to trend line resistance-turned support (around 1.3130), extended from the high 1.3382. Breaking here exposes weekly support at 1.3059.
Across the page, H4 candles, following last Friday’s rejection from resistance at 1.3270, made way through 1.32 yesterday with the unit swiftly retesting the latter as resistance in fine form. Quasimodo support at 1.3126 represents the next floor in the firing range, according to chart studies, a level located nearby the 1.31 handle.
Areas of consideration:
The retest at 1.32 as resistance on the H4, coupled with weekly price exploring waters beyond channel support and daily price heading for trend line resistance-turned support (1.3344), could have price manoeuvre to H4 Quasimodo support at 1.3126 today. Not only is this level a downside target for bearish strategies off 1.32, it forms a potential reversal zone for countertrend strategies, having seen the base converge with current daily trend line support (1.3130).
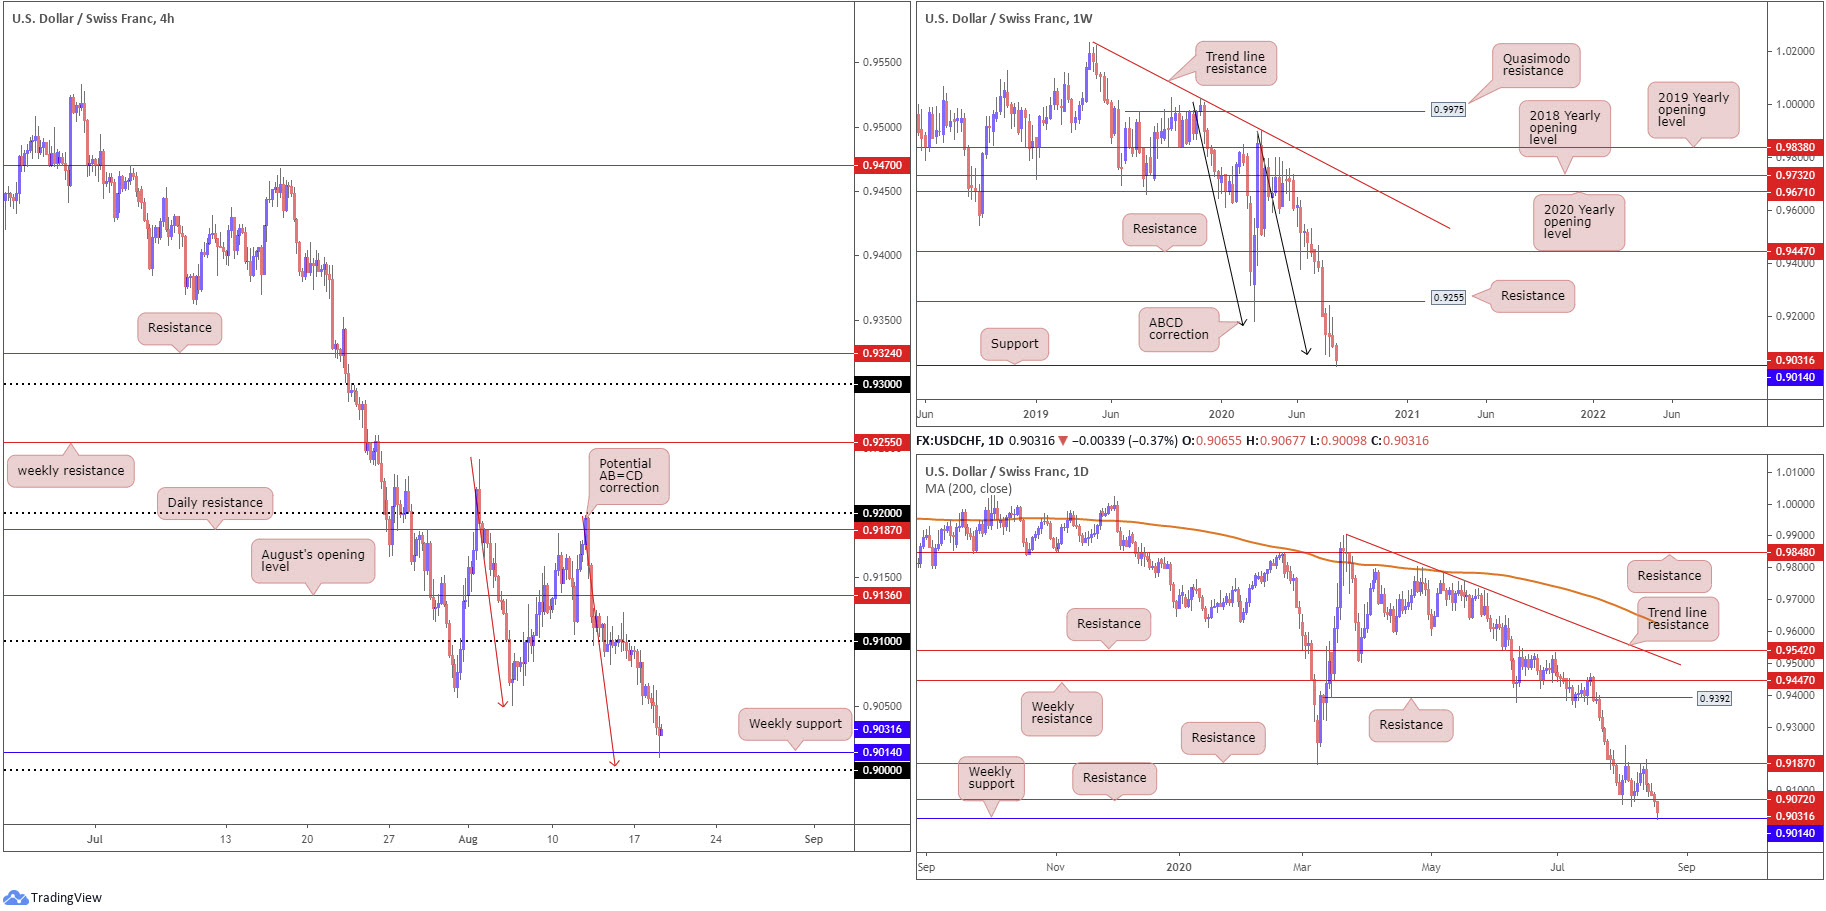
USD/CHF:
Pressured lower, in line with the US dollar index splitting the 92.50 level, USD/CHF extended its retracement slide from daily resistance priced in at 0.9187 Tuesday and shook hands with weekly support coming in at 0.9014. This level, a key hurdle by and of itself, also brings together a number of additional supports, including a weekly ABCD support at 0.9051 (black arrows), a H4 AB=CD support at 0.9003 (red arrows) and the 0.90 figure on the H4 timeframe.
Areas of consideration:
The combination of strong support coating the 0.90 neighbourhood today is likely appealing to buyers, particularly countertrend strategies. While the area may not stimulate a major reversal, owing to the immediate downtrend in play, it is still a base that could prompt a recovery back to at least daily resistance at 0.9072 and the 0.91 handle (H4).
Dow Jones Industrial Average:
US equities traded mostly higher on Tuesday, despite ongoing concerns surrounding the economic impact of the coronavirus pandemic. The Dow Jones Industrial Average declined 66.84 points, or 0.24%; the S&P 500 rallied 7.79 points, or 0.23% and the tech-heavy Nasdaq 100 traded higher by 110.46 points, or 0.98%.
Taking into consideration that price movement has been limited so far this week, much of the following report will echo thoughts aired in Monday’s technical briefing.
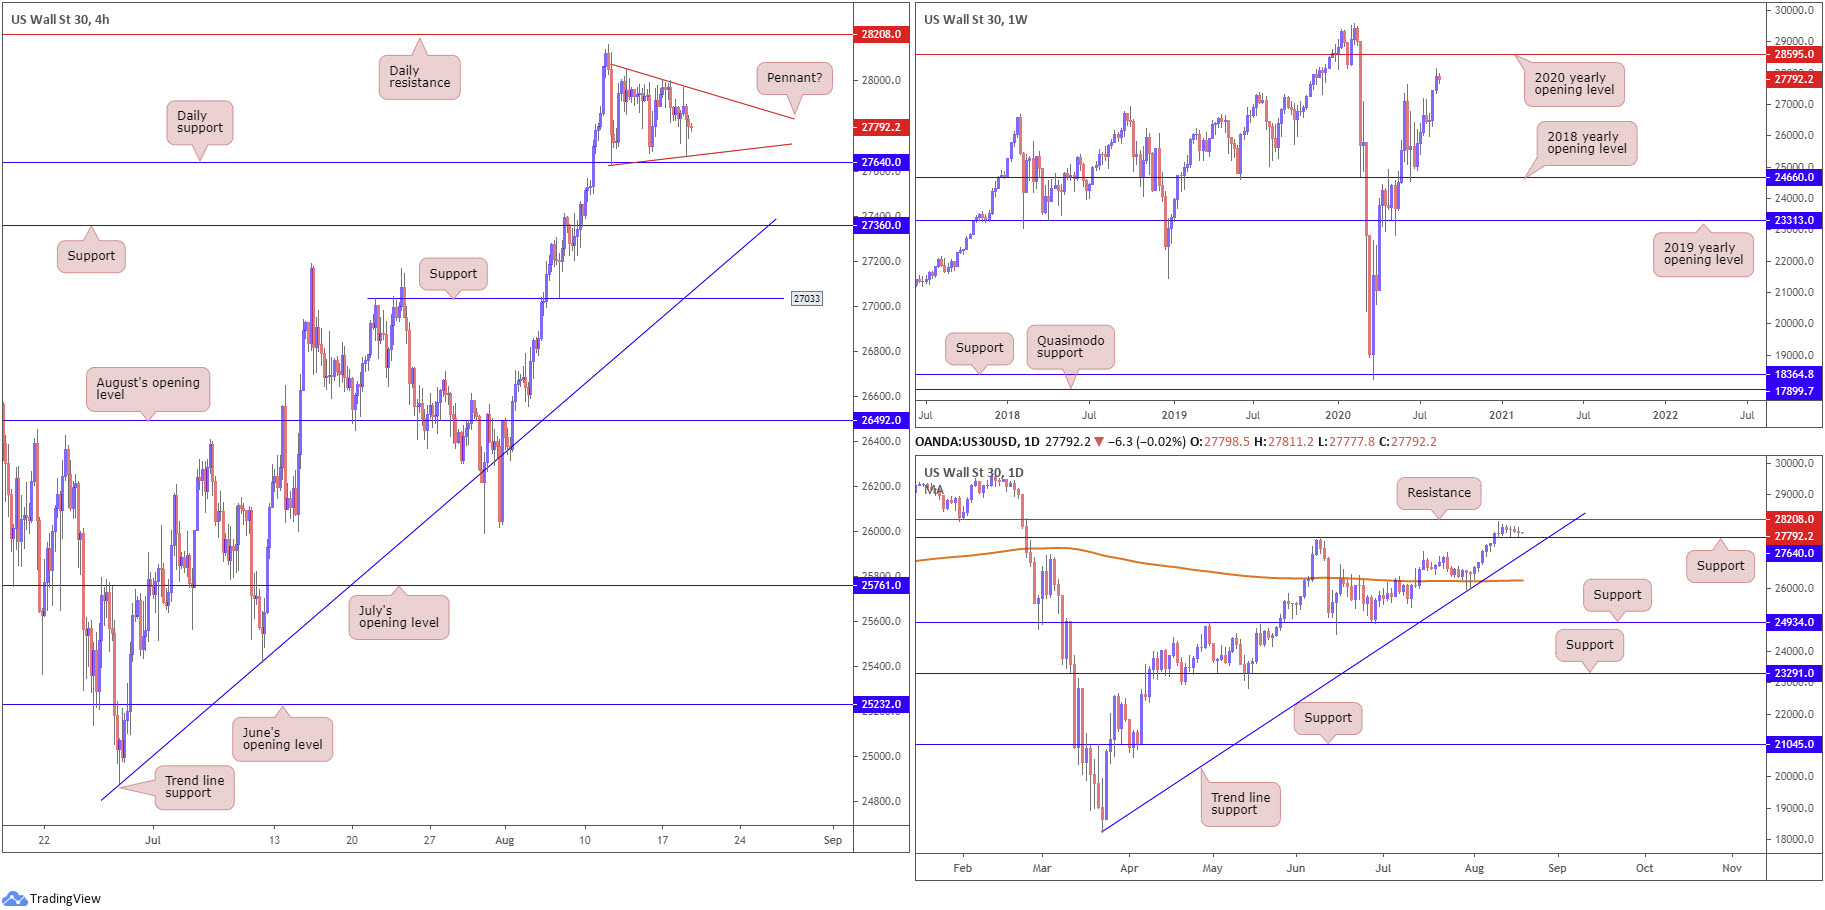
From the weekly timeframe:
US equities traded strong last week, extending the prior week’s 3.5% advance and overthrowing the 27638 high. Although a 27638 retest could develop, the unit is poised to make a run for the 2020 yearly opening level at 28595.
Daily timeframe:
A closer examination of price action on the daily timeframe reveals resistance is seen at 28208, with support placed at 27640. Breaking resistance could have action make its way towards the 2020 yearly opening level on the weekly timeframe at 28595, while tunnelling through support has trend line support, extended from the low 18213, to contend with.
H4 timeframe:
Activity on the H4 timeframe established position off daily support at 27640 last Wednesday and closed a touch off session peaks.
Candle action is now seen compressing between two converging trend lines (28051/27628), forming what appears to be a bullish pennant chart pattern. Breaking the upper edge of the aforementioned pattern will likely lead price movement towards daily resistance mentioned above at 28208, while a decisive break lower, moves that overthrow daily support at 27640, could push the unit towards H4 support at 27360.
Areas of consideration:
An additional test of daily support at 27640 may form, though H4 candles will likely remain within the current pennant formation. Breaking the pennant pattern to the upside today may fuel bullish scenarios to at least daily resistance at 28208, with a break, as highlighted above, likely pushing for weekly resistance at 28595, the 2020 yearly opening level.
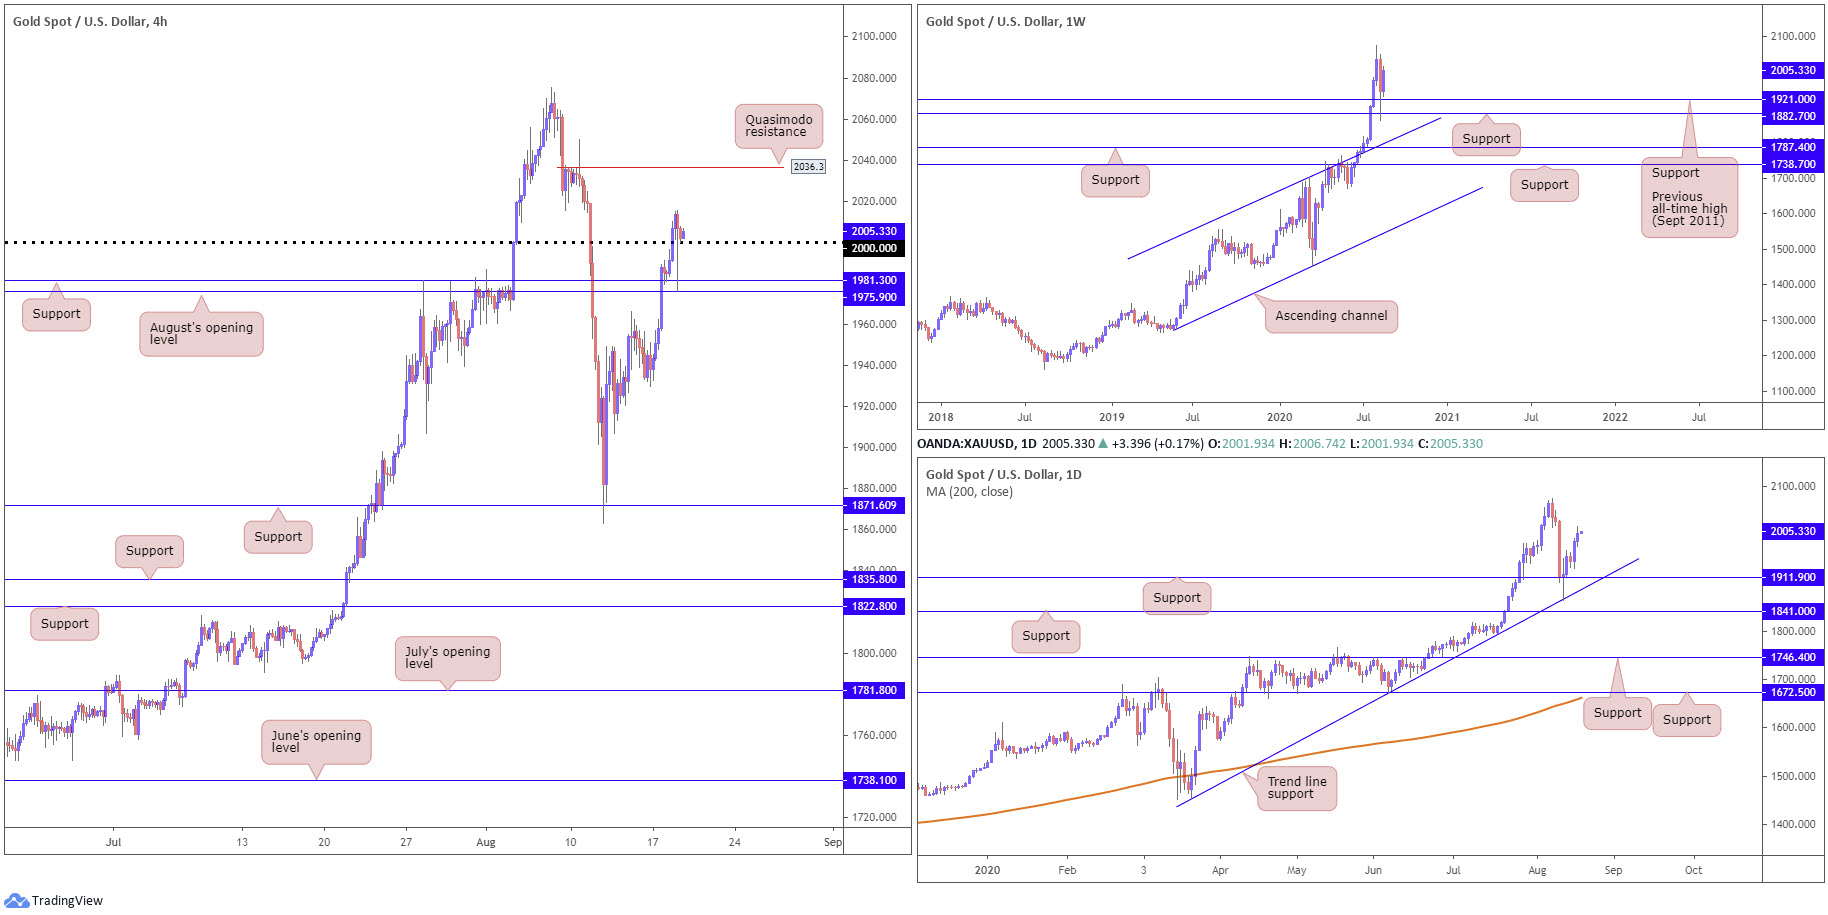
XAU/USD (GOLD):
Spot gold extended recovery gains Tuesday, reclaiming $2,000.00 to the upside.
The latter, as you can see, holds form, despite a rigorous push to test the range seen between August’s opening level at $1,975.90 and support at $1,981.30 on the H4 timeframe. This unlocks potential intraday bullish themes towards Quasimodo resistance at $2,036.30.
As for the higher timeframes, after strong dip-buying materialised off the following structures: $1,921.00, the previous all-time high (September 2011), weekly support coming in at $1,882.70, daily trend line support, extended from the low $1,455.32, along with converging support from $1,911.90, we can see limited resistance until reaching all-time peaks at $2,075.28.
Areas of consideration:
With scope to explore higher levels on the bigger picture, together with H4 price retesting $2,000.00 as support, this area will likely have active buyers seek bullish strategies today, targeting H4 Quasimodo resistance at $2,036.30 as an initial take-profit zone.
The accuracy, completeness and timeliness of the information contained on this site cannot be guaranteed. IC Markets does not warranty, guarantee or make any representations, or assume any liability regarding financial results based on the use of the information in the site.
News, views, opinions, recommendations and other information obtained from sources outside of www.icmarkets.com.au, used in this site are believed to be reliable, but we cannot guarantee their accuracy or completeness. All such information is subject to change at any time without notice. IC Markets assumes no responsibility for the content of any linked site.
The fact that such links may exist does not indicate approval or endorsement of any material contained on any linked site. IC Markets is not liable for any harm caused by the transmission, through accessing the services or information on this site, of a computer virus, or other computer code or programming device that might be used to access, delete, damage, disable, disrupt or otherwise impede in any manner, the operation of the site or of any user’s software, hardware, data or property.


