
Key risk events today:
German Prelim GDP q/q; French Final CPI m/m; RBA Assist Gov Debelle Speaks; UK CPI y/y; UK PPI Input m/m.
EUR/USD:
In recent sessions, the US dollar strengthened in the wake of firm CPI data and positive developments on the US/China trade front. US Trade Representative Lighthizer announced that additional tariffs on some Chinese imports will be delayed until December 15. US President Trump later stated the decision was taken to prevent an impact on the Christmas shopping season.
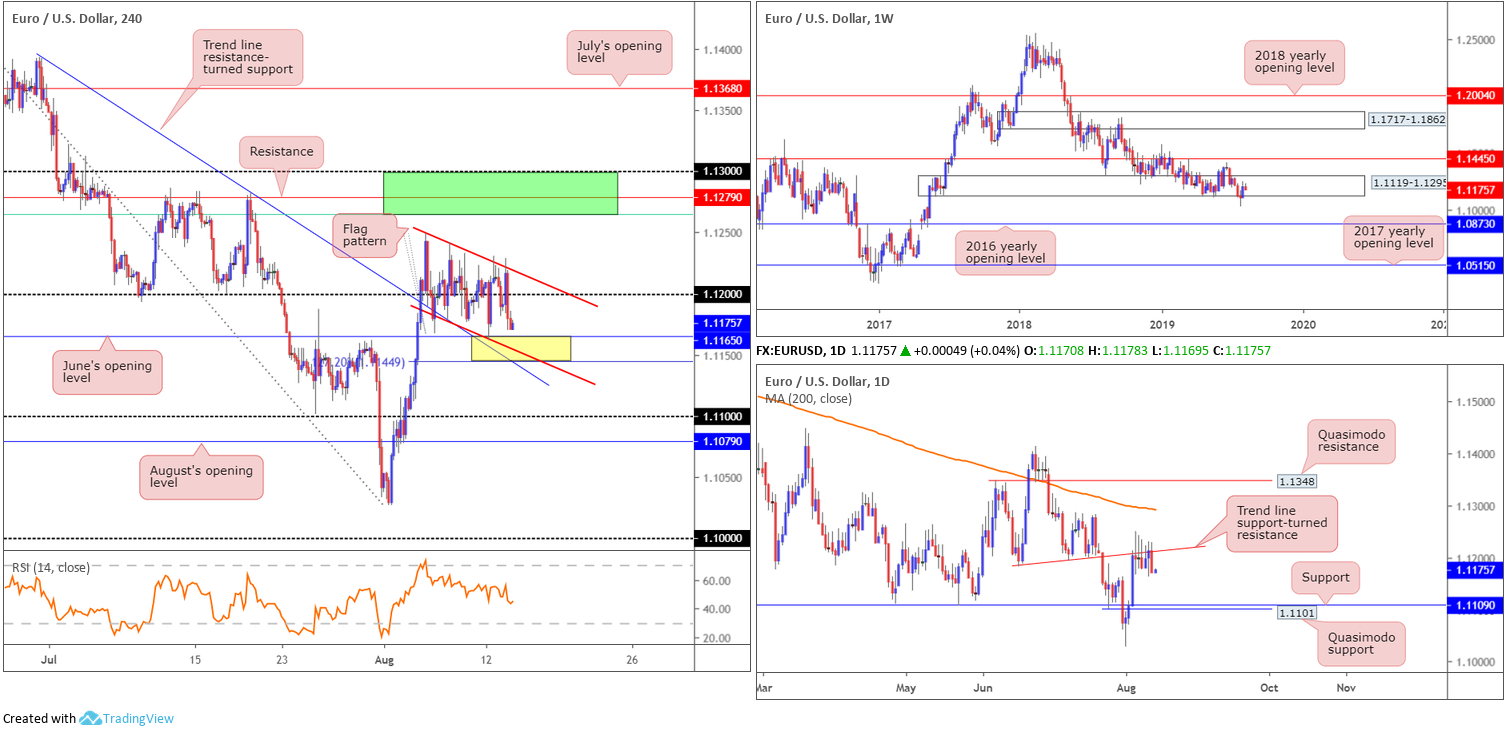
This weighed on the EUR/USD market, hauling the H4 candles sub 1.12 to close just north of June’s opening level at 1.1165. Since Tuesday (last week), the H4 space has been busy sculpting a clear-cut bullish flag formation (1.1249/1.1179). As a flag is typically considered a continuation pattern, a breakout north is likely eyed by many traders today/this week. What’s also interesting from a technical standpoint is the lower edge of the flag pattern merges with (yellow) an area of support comprised of June’s opening level mentioned above at 1.1165, a 127.2% Fibonacci ext. point at 1.1144 and an intersecting trend line resistance-turned support (taken from the high 1.1392).
The technical climate on the EUR/USD remains unaltered on the weekly timeframe:
(Extracted from Monday’s weekly outlook).
Despite clocking multi-year lows of 1.1026 and long-standing demand at 1.1119-1.1295 having its lower edge submerged, price movement staged an impressive recovery last week and snapped a three-week losing streak. Continued bidding could eventually see the unit knock on 1.1445’s door again, the 2019 yearly opening level, whereas support is not expected to emerge until shaking hands with the 2016 yearly opening level at 1.0873.
In addition to this, it is worth noting the long-term trend remains facing a southerly bearing since topping in early 2018.
From the daily timeframe, Tuesday’s session wrapped up at its lows, capped by a local trend line support-turned resistance (taken from the low 1.1181. Continued selling may call for a run towards support at 1.1109, closely shadowed by Quasimodo support at 1.1101.
Areas of consideration:
Medium-term flow (H4) remains biased to the upside, according to the forming flag structure. Traders have the choice of buying early at from the support area at 1.1144/1.1165 (protective stop-loss orders can be positioned beneath the intersecting trend line resistance-turned support [taken from the high 1.1392]) underlined above in yellow in anticipation of a breakout higher, or conservatively wait for the H4 candles to push outside of the flag before making a decision.
The first port of call to be aware of, in terms of upside structure, is H4 resistance between the round number 1.13, a resistance level at 1.1279 and a 61.8% Fibonacci retracement value at 1.1265 (1.13/1.1265 – green).
GBP/USD:
UK’s pound traded marginally in the red Tuesday against the US dollar, languishing beneath the 1.21 mark. While the jobless rate moved 0.1ppts higher to 3.9% in the three-months to June, against a consensus view for unchanged, the wages data was more encouraging, coming in line with expectations at 3.7%.
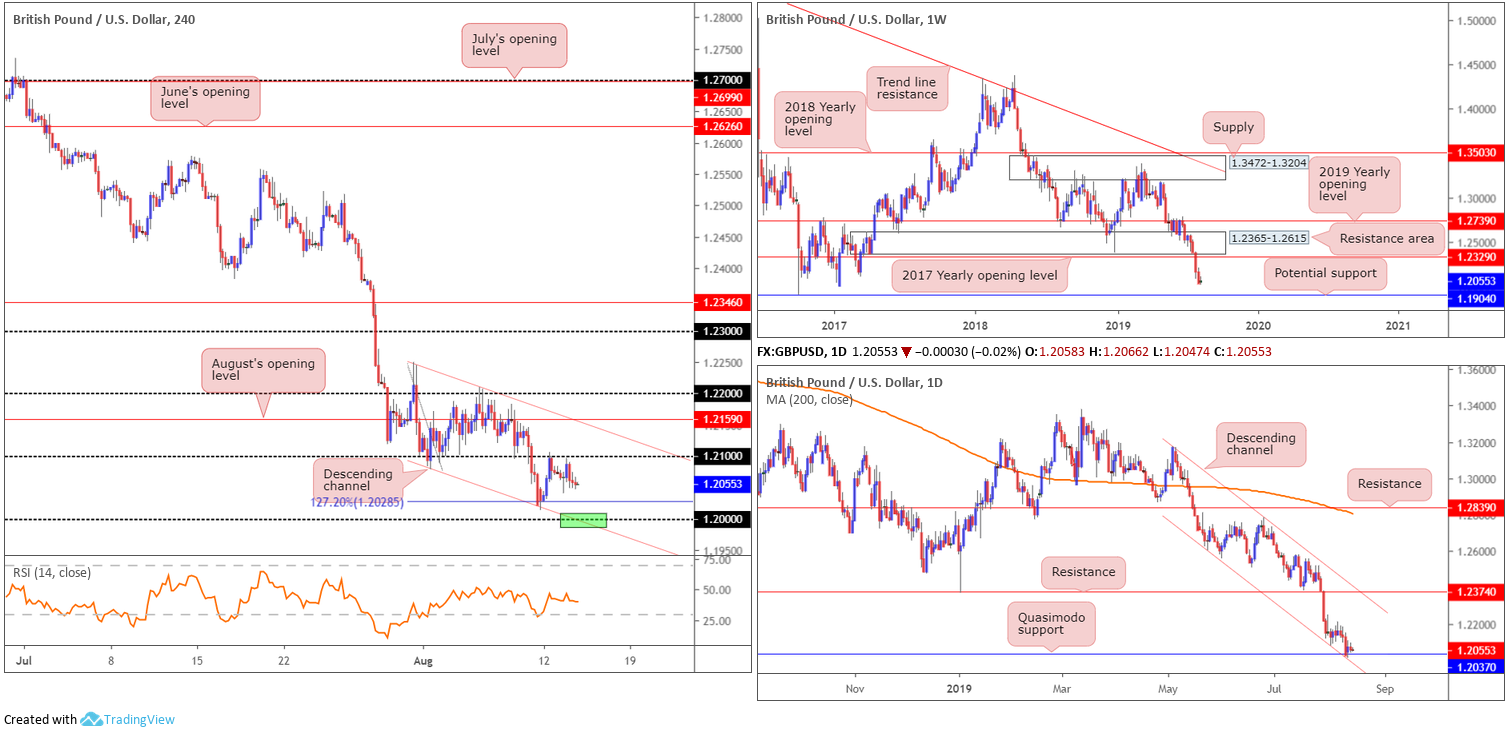
Shifting focus to the technical landscape, the H4 candles have support eyed at a 127.2% Fibonacci ext. point at 1.2028, closely followed by the key figure 1.20. It is also worth noting the H4 chart remains compressing within a descending channel formation taken from the high 1.2249 and a low of 1.2079.
The weekly timeframe’s outlook remains unchanged:
(Extracted from Monday’s weekly outlook).
The British pound retained a heavy tone last week, erasing more than 130 points and recording its fourth consecutive losing week. After tunnelling through bids residing within long-standing demand at 1.2365-1.2615 (now acting resistance area) and overthrowing the 2017 yearly opening level at 1.2329, the next downside objective on the weekly timeframe falls in around support from 1.1904: a standout low clocked in early October 2016.
Regarding the daily timeframe, limited movement was seen yesterday, therefore Tuesday’s outlook remains in motion:
As is evident from the daily timeframe, before reaching 1.1904 on the weekly timeframe, daily movement must contend with channel support (taken from the low 1.2605) and Quasimodo support close by at 1.2037. This, particularly on the daily timeframe, is the last line of defence for buyers it seems as a clear run beneath here is visible to 1.1904.
Areas of consideration:
The following was also taken from Tuesday’s briefing as it remains valid given the lacklustre performance yesterday:
Entering long at 1.20 is still an option, specifically at the point the round number aligns with the current H4 channel support (green). By doing so, nevertheless, take into account that while you have additional support on the daily timeframe from channel support/Quasimodo support at 1.2037, directional flow on the weekly timeframe portends further downside to 1.1904. A H4 bullish candlestick printed from 1.20 would likely encourage buying and provide a base for you to set entry and risk levels, though whether price will reach 1.21 again is difficult to judge.
In the event we overthrow 1.20 on a H4 closing basis, this would likely put a test of 1.19 in view. A retest at 1.20 as resistance by way of a H4 bearish candlestick formation is ideal for sellers, allowing traders to position entry and risk levels according to the pattern.
AUD/USD:
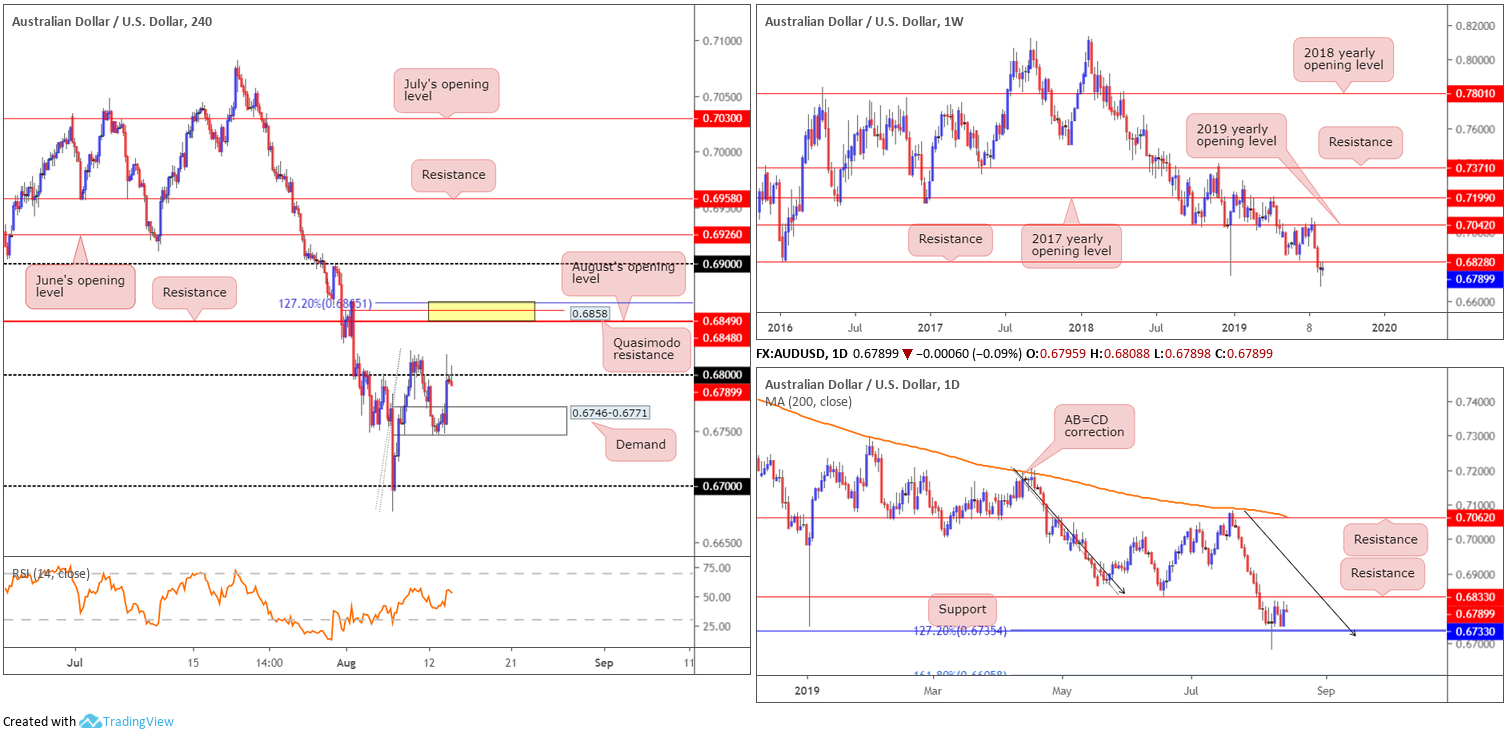
Underpinned by fresh H4 demand at 0.6746-0.6771, the Australian dollar climbed higher against its US counterpart Tuesday, adding 0.69%. Further helping sentiment was news of positive developments on the US/China trade front. US Trade Representative Lighthizer announced that additional tariffs on some Chinese imports will be delayed until December 15, confirmed later by US President Trump stating the decision was taken to prevent an impact on the Christmas shopping season.
In terms of weekly structure, limited movement has been observed this week, with the AUD/USD continuing to languish sub resistance at 0.6828, extending the pullback from the 2019 yearly opening level (resistance) at 0.7042. As highlighted in Tuesday’s report, the pair recently refreshed multi-year lows at 0.6677, and with the long-term downtrend remaining intact, further selling is likely on the cards as the next support is not visible until 0.6395 on this timeframe (not seen on the screen).
Elsewhere, daily price is sandwiched between support at 0.6733 (merges with a 127.2% AB=CD [black arrows] formation at 0.6735) and resistance fixed at 0.6833 (June 18 low).
H4 movement, on the other hand, connected with its 0.68 handle after finding a floor of support within the H4 demand area mentioned above at 0.6746-0.6771. Beyond 0.68, thin air is present until reaching August’s opening level/resistance at 0.6849/48. Note this area converges closely (yellow) with a Quasimodo resistance at 0.6858 and a 127.2% Fibonacci ext. point at 0.6865.
Areas of consideration:
Although positioned slightly above the aforementioned higher-timeframe resistances, a H4 bearish candlestick configuration printed from 0.6865/0.6848 is likely enough to draw in sellers (entry/risk can be determined according to the candlestick’s structure) and reclaim the higher-timeframe levels.
USD/JPY:
Market sentiment dramatically improved Tuesday on the back of US-China trade headlines. The 10-year US Treasury bond yield added more than 3% Tuesday, with the USD/JPY market gaining 1.37% in the hour following the United States Trade Representative’s (USTR) announcement to delay additional tariffs on some Chinese imports.
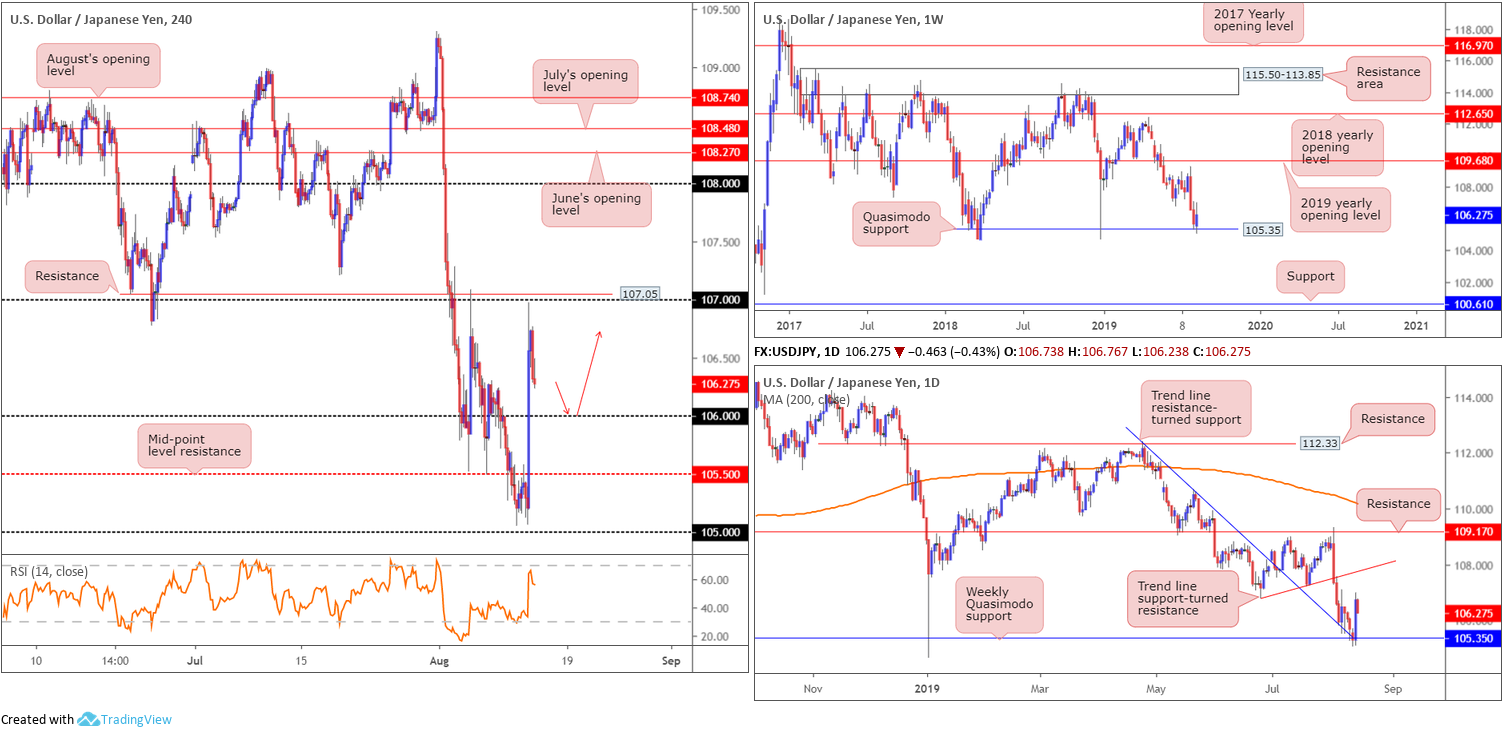
Weekly Quasimodo support at 105.35 is, as you can see, holding ground – this level already proved its worth by holding the unit higher at the beginning of the year. Outside of this base, limited support is evident until 100.61. In tandem with the weekly Quasimodo support, as highlighted in Monday’s weekly report, traders may have noted the merging daily trend line resistance-turned support (extended from the high 112.40) is also in play now. The next upside target on the higher timeframes can be seen at a daily trend line support-turned resistance taken from the low 106.78.
The H4 candles drove through 105.50: a mid-point resistance and the 106 handle Tuesday, though fell short a few points of connecting with 107 before paring a portion of the day’s gains into the close. As of current price, the unit is posed to revisit 106, which could, owing to higher-timeframe support, be enough to entice buying into this market today.
Areas of consideration:
Keeping things simple this morning, traders are urged to keep an eye on the 106 handle for a possible retest play (red arrows). A H4 bullish candlestick configuration printed from here will, given the bigger picture (see above), likely be sufficient to draw in buyers and push for 107. The reason for needing additional candlestick confirmation is simply due to the threat of a fakeout occurring at the round number (common viewing). In addition to this, a candlestick signal provides traders entry and risk levels to work with.
USD/CAD:
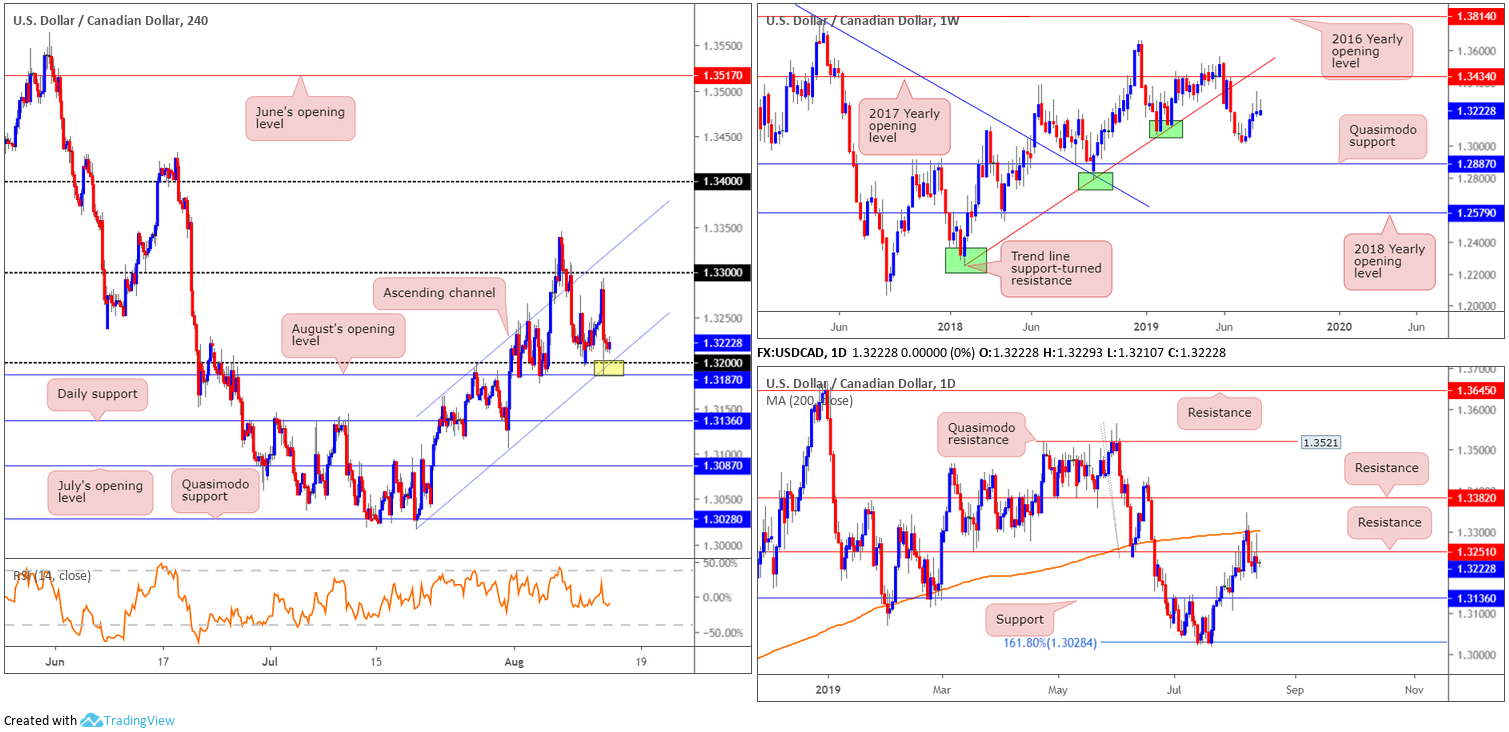
Pressured by rising WTI prices on trade headlines, the USD/CAD pulled back and shook hands with a particularly interesting area of H4 support Tuesday between August’s opening level at 1.3187, an intersecting channel support (extended from the low 1.3015) and the round number 1.32 (yellow). For those who read Tuesday’s briefing you may recall the piece highlighting this zone as a potential buy, targeting daily resistance at 1.3251 as the initial take-profit zone.
As is evident from the charts, the said daily resistance level has yet to enter the fold. In terms of where the unit is positioned on the weekly timeframe, however, upside momentum has diminished over the past couple of weeks, shaped in the mould of selling wicks south of the 2017 yearly opening level at 1.3434, closely shadowed by trend line support-turned resistance etched from the low 1.2247.
Areas of consideration:
Traders who remain long this market today, holding out for the daily resistance level at 1.3251 is certainly an idea. At this point, reducing risk to breakeven is something to consider, with the option of liquidating a portion of the profits. A run above 1.3251 has the 200-day SMA to target close by at 1.3301, sited just above the 1.33 handle on the H4 chart, so traders can simply use 1.33 as the next upside target for ease of reference.
USD/CHF:
For traders who read Tuesday’s briefing you may recall the following:
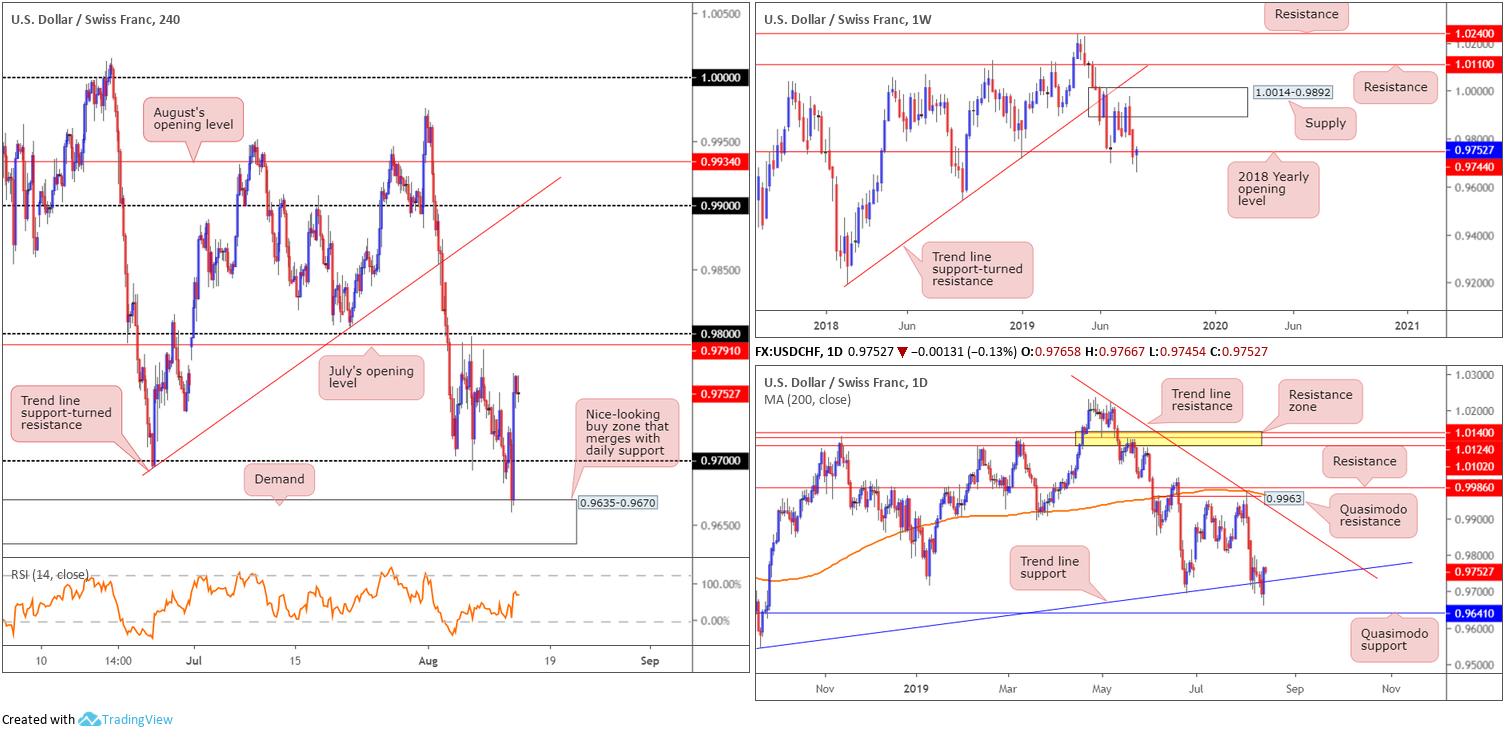
An appealing area of support comes in at H4 demand drawn from 0.9635-0.9670. Not only is the zone a high-probability base in and of itself, it aligns with Quasimodo support on the daily timeframe at 0.9641. This potentially offers enough ‘juice’ to entice buying to at least 0.97, providing sufficient room to reduce risk to breakeven at the first target. Do remember, though, by entering long here you are effectively buying into weekly (directional) flow beneath the 2018 yearly opening level at 0.9744. This simply means you are buying when weekly price shows room to press lower.
Well done to any of our readers who managed to jump aboard yesterday’s advance. This morning has you at a favourable risk/reward, with further buying towards July’s opening level at 0.9791/the 0.98 handle on the H4 timeframe potentially on the cards today.
Areas of consideration:
While further buying is certainly a possibility, traders are urged to take into account the 2018 yearly opening level underlined above at 0.9744 (resistance) on the weekly timeframe. With room seen to explore lower ground on the weekly chart, active selling from here is something to watch out for. With that being the case, reducing risk to breakeven on current longs is an idea, as well as liquidating a portion of the position at current price.
Dow Jones Industrial Average:
US equity indexes closed sharply higher Tuesday after the Trump administration backed off on imposing tariffs on some Chinese imports. The Dow Jones Industrial Average added 372.54 points, or 1.44%; the S&P 500 also added 42.57 points, or 1.48% and the Nasdaq advanced 166.47 points, or 2.20%.
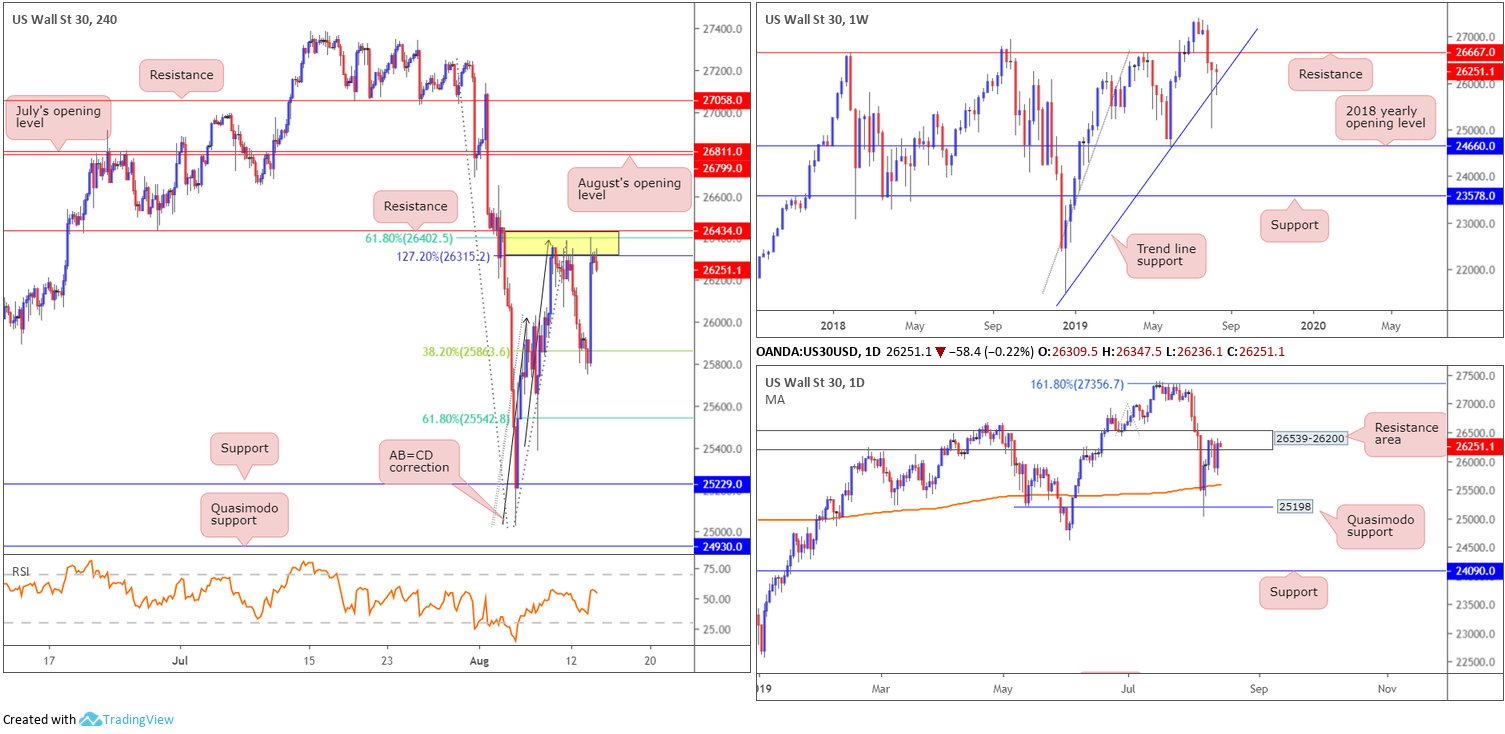
Technically, price action staged a recovery off the 38.2% Fibonacci retracement value at 25863 Tuesday and retested a familiar area of resistance. Between resistance at 26434, a 127.2% AB=CD (black arrows) correction point at 26315 and a 61.8% Fibonacci retracement value at 26402, this zone held price action lower Monday, and could do so again today. What’s also notable from a technical perspective is the converging daily resistance area in the mix at 26539-26200.
The only grumble to selling the current H4 sell zone, also highlighted in Monday’s report, is the weekly timeframe showing price could potentially run as far north as weekly resistance at 26667 after finding a floor off trend line support etched from the low 21452.
Areas of consideration:
Should the current H4 candle close as is, a short on the back of this movement from the H4 resistance area mentioned above at 26434/26315 is an option, targeting 25863, followed by the 61.8% Fibonacci retracement value at 25542.
XAU/USD (GOLD):
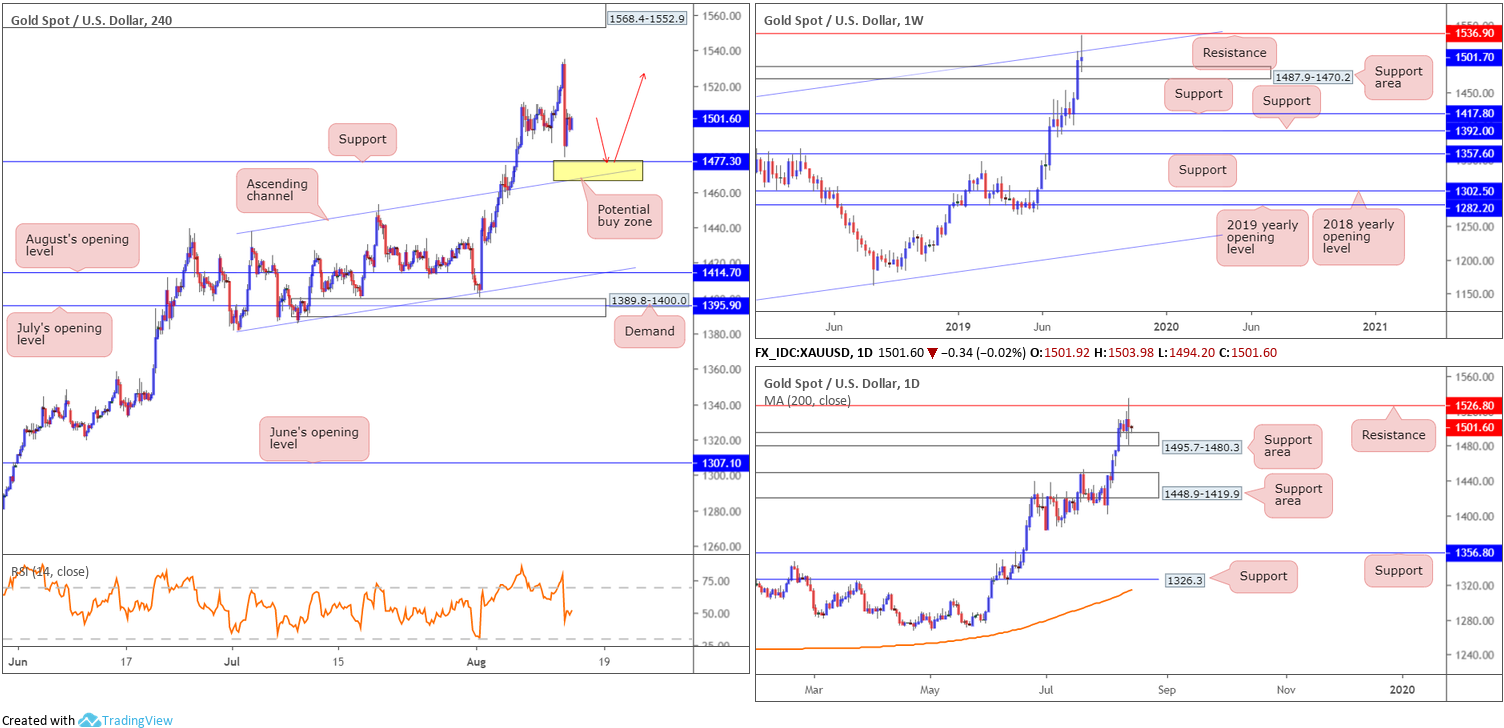
Demand for the yellow metal diminished Tuesday, plummeting below 1500.0 on renewed trade optimism. As of current price on the H4 timeframe, the candles are meandering just north of support coming in at 1477.3. Note this level is positioned just ahead of an ascending channel resistance-turned support extended from the high 1437.7. The yellow zone, therefore, marks a possible reversal area to be aware of today.
Moving up the ladder to the higher timeframes, daily price recently crossed swords with resistance at 1526.8 and pulled back to a support area linked at 1495.7-1480.3. A similar theme exists on the weekly timeframe. Price action whipsawed through channel resistance (taken from the high 1375.1) and came within a cat’s whisker of connecting with resistance at 1253.9. As of now, the unit is confined between the said upper levels and an area of support coming in at 1487.9-1470.2.
Areas of consideration:
With gold’s action entrenched within a strong uptrend right now, and having noted support areas present on both the weekly and daily timeframes (see above), a bounce from the yellow zone mentioned above on the H4 timeframe between the channel resistance-turned support/support at 1477.3ish is certainly an option today. To avoid falling victim to a fakeout, however, the research team recommends waiting for additional candlestick confirmation to form before pulling the trigger. Not only does this help identify buyer intent, it also provides entry/risk levels to work with as well. As for upside targets, expect some selling to materialise around the 1507ish region, followed by daily resistance at 1526.8/weekly resistance at 1536.9.
The accuracy, completeness and timeliness of the information contained on this site cannot be guaranteed. IC Markets does not warranty, guarantee or make any representations, or assume any liability regarding financial results based on the use of the information in the site.
News, views, opinions, recommendations and other information obtained from sources outside of www.icmarkets.com.au, used in this site are believed to be reliable, but we cannot guarantee their accuracy or completeness. All such information is subject to change at any time without notice. IC Markets assumes no responsibility for the content of any linked site.
The fact that such links may exist does not indicate approval or endorsement of any material contained on any linked site. IC Markets is not liable for any harm caused by the transmission, through accessing the services or information on this site, of a computer virus, or other computer code or programming device that might be used to access, delete, damage, disable, disrupt or otherwise impede in any manner, the operation of the site or of any user’s software, hardware, data or property.


