
EUR/USD:
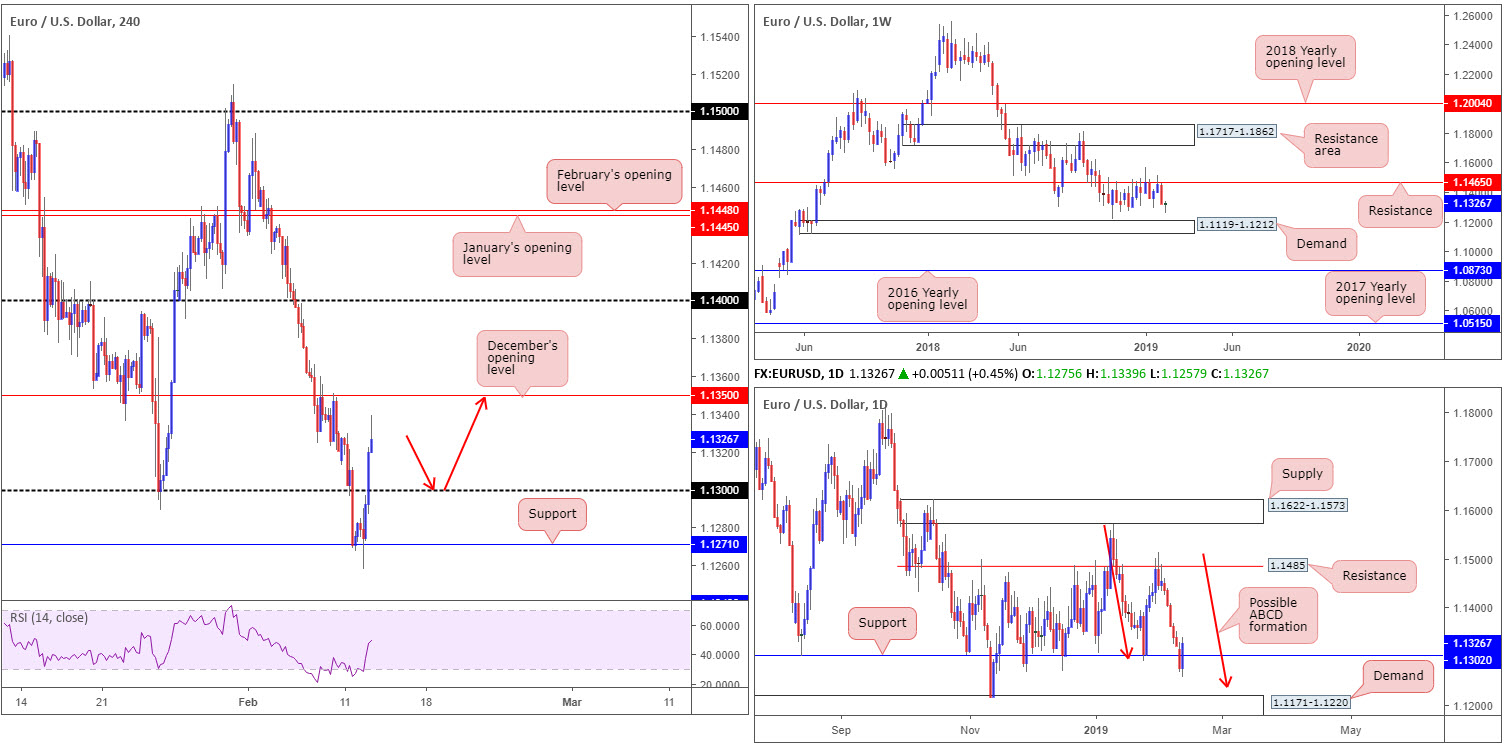
The EUR/USD dipped its toe into bullish territory Tuesday, staging a modest rebound off H4 support at 1.1271 and recapturing the 1.13 handle. Shattering a six-day losing streak, the pair took advantage of broad-based USD weakness (as the US dollar index reclaimed 97.00 to the downside) and reached highs at 1.1339 into the close.
With 1.13 firmly in the rear view mirror, the H4 candles will soon be knocking on the door of December’s opening level plotted at 1.1350. Let’s bear in mind this level held beautifully as resistance in the later stages of last week, therefore could potentially hold once again if brought into the mix.
Recent buying on the daily timeframe produced a nice-looking bullish engulfing formation that witnessed the unit take back resistance at 1.1302 (now labelled support). Upside from this angle has resistance plotted at 1.1485 to target, while weekly flow is eyeing long standing weekly support/resistance at 1.1465.
Areas of consideration:
The 1.13 handle, alongside its nearby daily support pictured at 1.1302 (and the bullish engulfing candle recently formed), offers a platform of possible support to work with. A retest of 1.13, preferably in the shape of something sexy in terms of a H4 bullish candlestick formation (entry/stop parameters can be defined according to this structure), is certainly worthy of consideration for longs, targeting December’s opening level at 1.1350 as the initial port of call (red arrows).
Why the research team feels the need for additional candlestick confirmation at 1.13 is due to round numbers attracting stop runs (fakeouts).
Today’s data points: US CPI m/m; US Core CPI m/m.
GBP/USD:
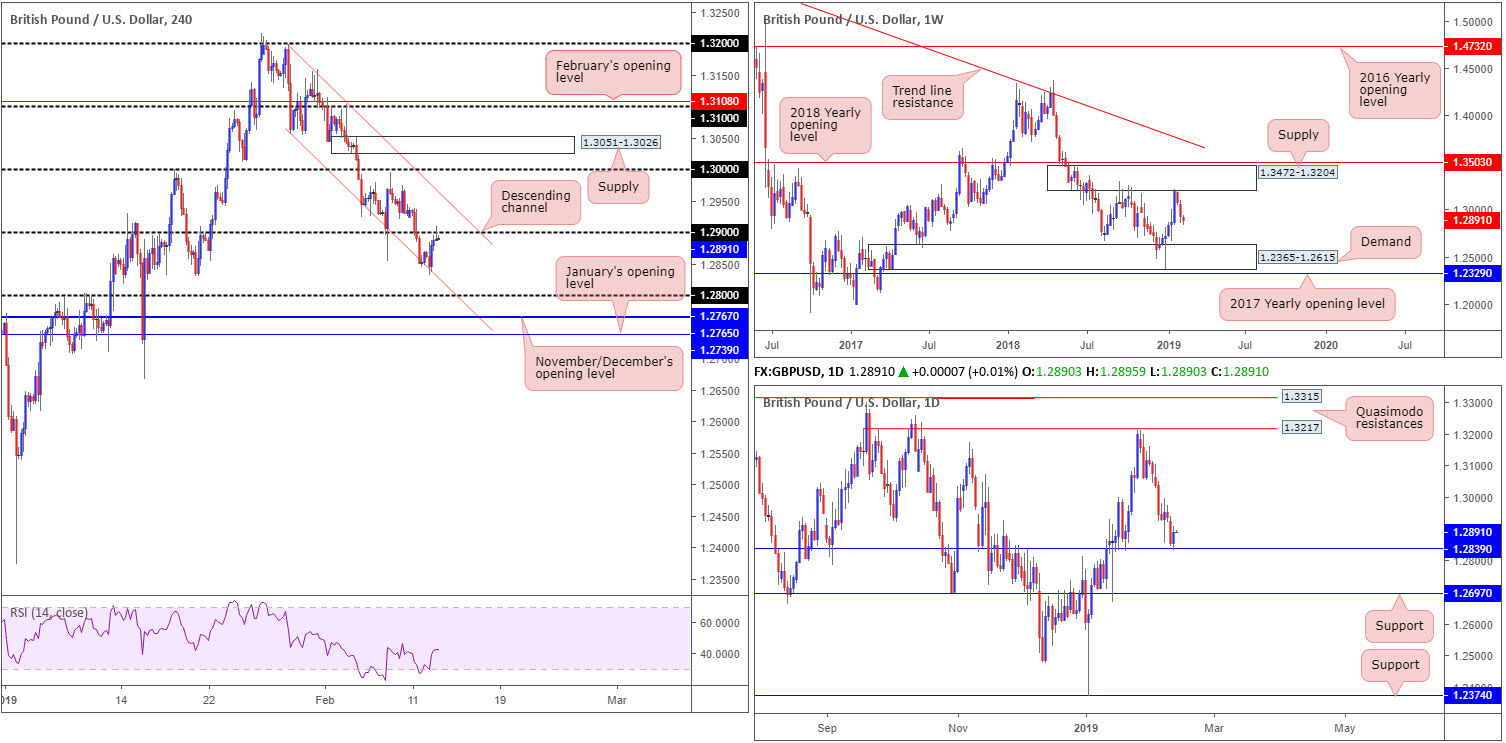
In recent sessions, cable breached local lows ahead of the latest Commons update from UK PM May on Brexit ‘progress’ that revealed nothing new. The pair regrouped following BoE Governor Carney taking the spotlight, underscoring the base case for gradual and limited tightening to ensure inflation meets target.
H4 activity topped around its 1.29 handle, following the day’s advance, and drew in a nice-looking bearish pin-bar formation into the close. Although the research team noted this to be a strong sell zone in yesterday’s briefing, which aligns with directional flow on the weekly timeframe as the unit shows room to trade as far south as demand coming in at 1.2365-1.2615, daily support is present at 1.2839. Therefore, having observed daily buyers enter the fold, a run above 1.29 could be seen towards the descending H4 channel resistance (etched from the high 1.3199).
Areas of consideration:
From a technical standpoint, both longs and shorts are an option. A sell from the underside of 1.29 could take shape, targeting 1.28, knowing the bears have weekly flow on side. On the flip side to this, nonetheless, daily buyers could explore higher ground off its support mentioned above at 1.2839. With higher timeframes generally taking precedence over its lower counterparts, downside from 1.29, or even the current H4 channel resistance, is higher probability, according to our technical studies.
To be on the safe side in regards to shorts, nevertheless, consider waiting for additional H4 candlestick confirmation to form before pulling the trigger. Not only will this ‘confirm’ seller intent it’ll also highlight entry and stop levels to trade.
Today’s data points: UK CPI y/y; UK PPI Input m/m; UK RPI y/y; US CPI m/m; US Core CPI m/m.
AUD/USD:
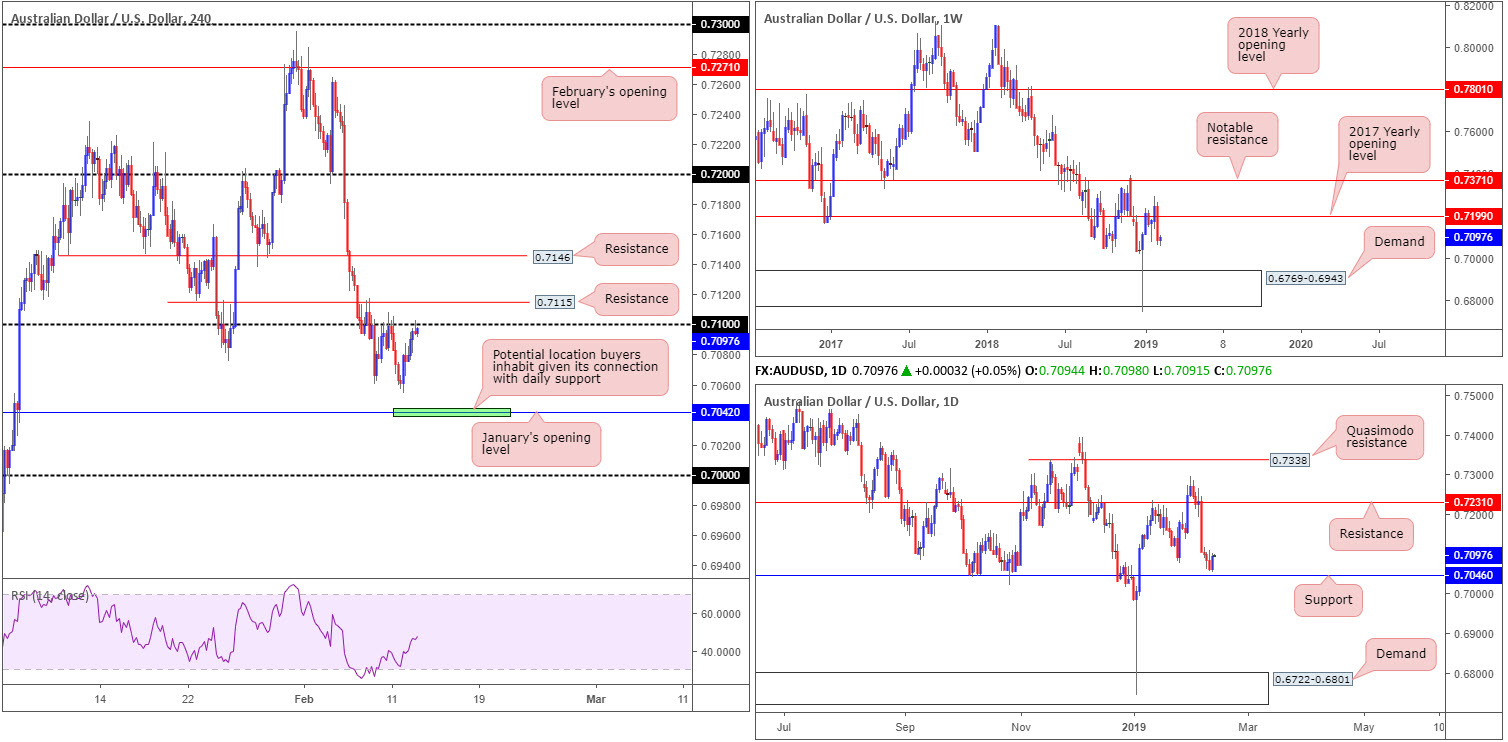
Recouping all of Monday’s losses and a large portion of Friday’s move, the AUD/USD gained nearly half a percent Tuesday on the back of US dollar weakness.
After breaching the 0.7060 Feb 7 low, the pair retraced ground and shook hands with 0.71 into yesterday’s close. In similar fashion to the GBP/USD’s H4 candles, the day also concluded forming a H4 bearish pin-bar formation off 0.71. This bearish signal places a question mark on recent buying, which on the daily timeframe developed a few pips north of support coming in at 0.7046. With respect to the weekly timeframe, however, room to stretch beyond this daily support level is visible as far south as demand plotted at 0.6769-0.6943.
Another important level worth underlining is January’s opening level on the H4 timeframe at 0.7042, given it coincides with daily support mentioned above at 0.7046. While the combination of these two levels may appear high probability, traders need to remind themselves weekly price displays room to press lower.
Areas of consideration:
A short on the back of the H4 bearish pin-bar formation (entry/stop levels can be defined according to this structure) off 0.71, knowing we have yet to tap daily support at 0.7046 and we’re showing room to move lower on the weekly timeframe, is certainly worthy of attention today.
Although weekly price appears poised to discover lower levels this week, a bounce from January’s opening level mentioned above on the H4 timeframe at 0.7042, knowing it aligns closely with daily support at 0.7046, is also a possible level for the watchlist today. On the whole, it is trader dependent on what entry method is used to confirm 0.7042 as support, if any. Some traders may prefer to drill down to the lower timeframes and search for a resistance-turned support setup to trade. Others may opt to wait for candlestick confirmation off the H4 timeframe. Both provide entry/stop parameters to work with and, by extension, confirm buyer intent.
Today’s data points: US CPI m/m; US Core CPI m/m.
USD/JPY:
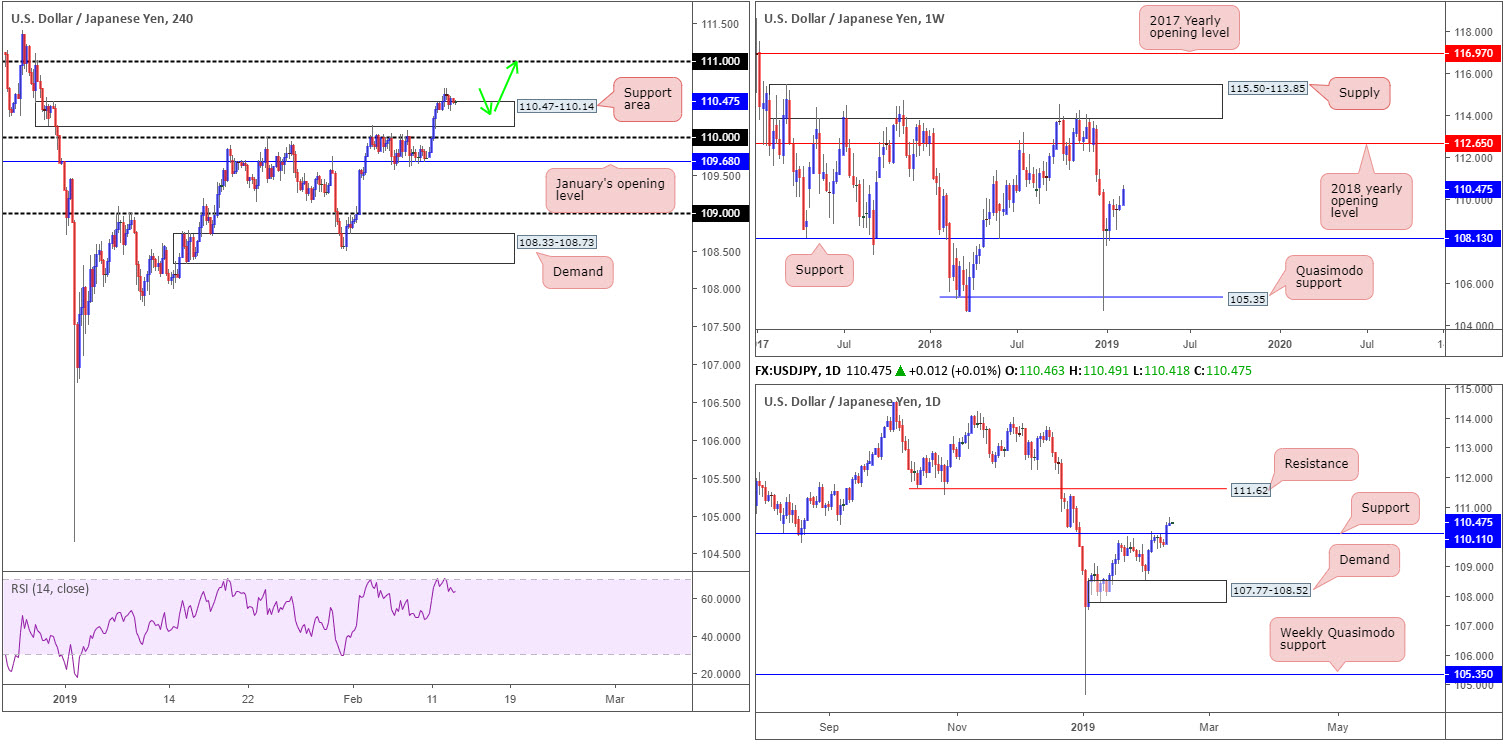
Despite a broad-based USD decline Tuesday, the USD/JPY managed to preserve its bullish tone. This could have something to do with US equities, particularly the Dow Jones Industrial Average, testing fresh 2019 highs. Having seen H4 price chew through stop-loss orders above H4 supply at 110.47-110.14, the next pit stop north falls in around the 111 handle.
On a wider perspective, weekly movement is eyeing further upside towards the 2018 yearly opening level at 112.65. Supporting this we have daily price recently clawing its way above resistance at 110.11 (now acting support), with the next upside target resting around 111.62.
Areas of consideration:
Having seen H4 supply overthrown in recent trade, it could potentially act as a support area going forward. A H4 bullish candlestick formation printed out of this zone is, in view of where we’re trading from on the higher timeframes, a high-probability buy signal, with the 111 handle in line as an initial upside objective. Beyond 111, the next port of call in terms of resistance is seen around 111.62 (daily timeframe) and then eventually, with a little bit of oomph from the buyers, 112.65 may enter the fold on the weekly timeframe.
Today’s data points: US CPI m/m; US Core CPI m/m.
USD/CAD:
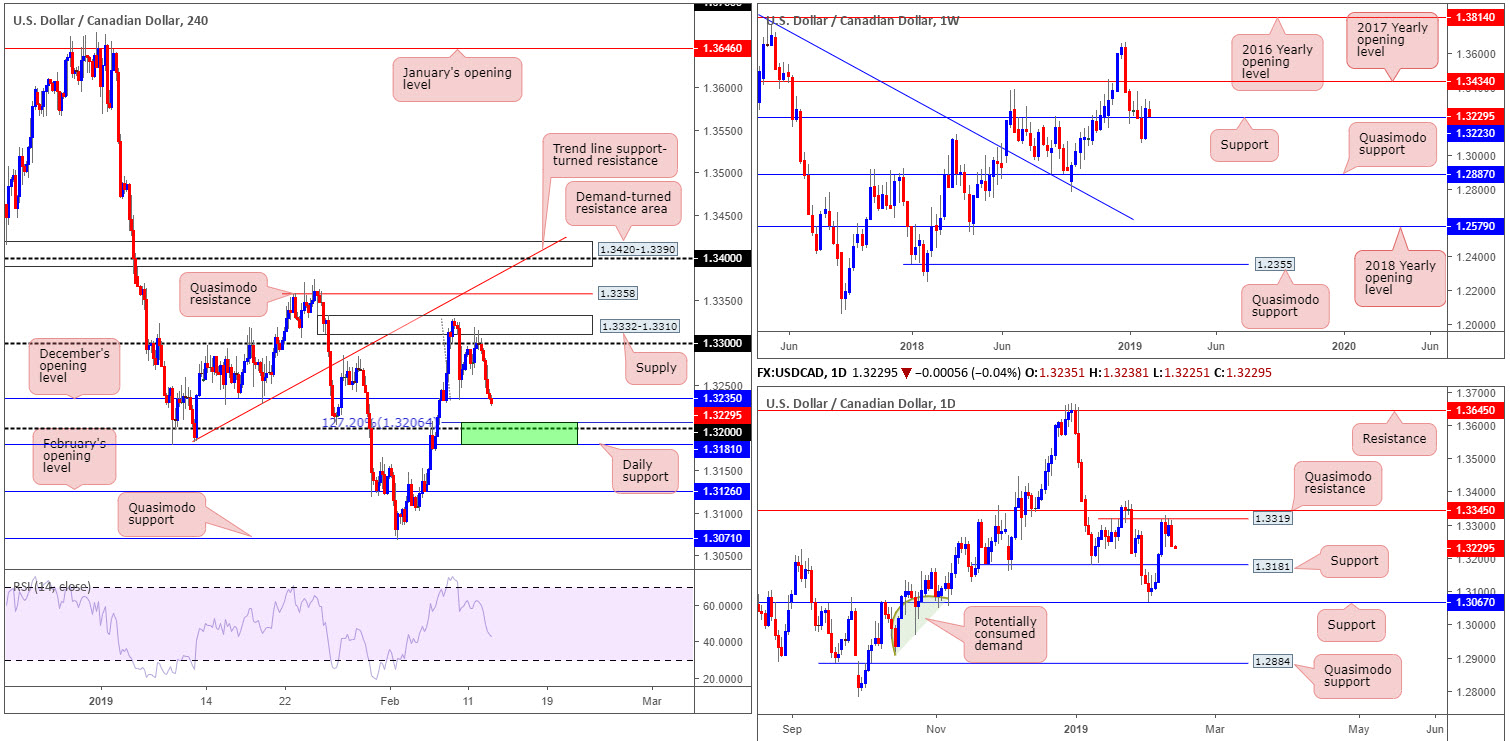
The USD/CAD, as you can see, went back to playing on the defensive Tuesday, concluding the session down 0.49%. A robust oil market along with a broad-based USD decline helped defend the underside of 1.33 and its nearby H4 supply zone at 1.3332-1.3310. This set the stage for a move towards December’s opening level at 1.3235, which judging by current action, appears fragile. The next port of call beyond this level can be seen around a 127.2% Fibonacci ext. point at 1.3206, shadowed closely by 1.32.
It is also worth noting down weekly price is seen retesting support at 1.3223 thanks to yesterday’s round of selling, whereas daily flow is seen poised to challenge nearby support fixed at 1.3181 after successfully fading Quasimodo resistance at 1.3319.
Areas of consideration:
Keeping it simple this morning, the research team, knowing we’re trading nearby weekly support at 1.3223, is highlighting the 1.3181/1.3206 region marked in green on the H4 timeframe as a possible buy zone. In addition to being formed by a 127.2% Fibonacci ext. point at 1.3206 and round number 1.32, it offers daily support mentioned above at 1.3181. Ultimately, traders will likely be watching for price to close above December’s opening level at 1.3235 (will be resistance at that point) before considering reducing risk to breakeven and taking partial profit.
Today’s data points: US CPI m/m; US Core CPI m/m.
The use of the site is agreement that the site is for informational and educational purposes only and does not constitute advice in any form in the furtherance of any trade or trading decisions.
The accuracy, completeness and timeliness of the information contained on this site cannot be guaranteed. IC Markets does not warranty, guarantee or make any representations, or assume any liability with regard to financial results based on the use of the information in the site.
News, views, opinions, recommendations and other information obtained from sources outside of www.icmarkets.com.au, used in this site are believed to be reliable, but we cannot guarantee their accuracy or completeness. All such information is subject to change at any time without notice. IC Markets assumes no responsibility for the content of any linked site. The fact that such links may exist does not indicate approval or endorsement of any material contained on any linked site.
IC Markets is not liable for any harm caused by the transmission, through accessing the services or information on this site, of a computer virus, or other computer code or programming device that might be used to access, delete, damage, disable, disrupt or otherwise impede in any manner, the operation of the site or of any user’s software, hardware, data or property.


