
EUR/USD:
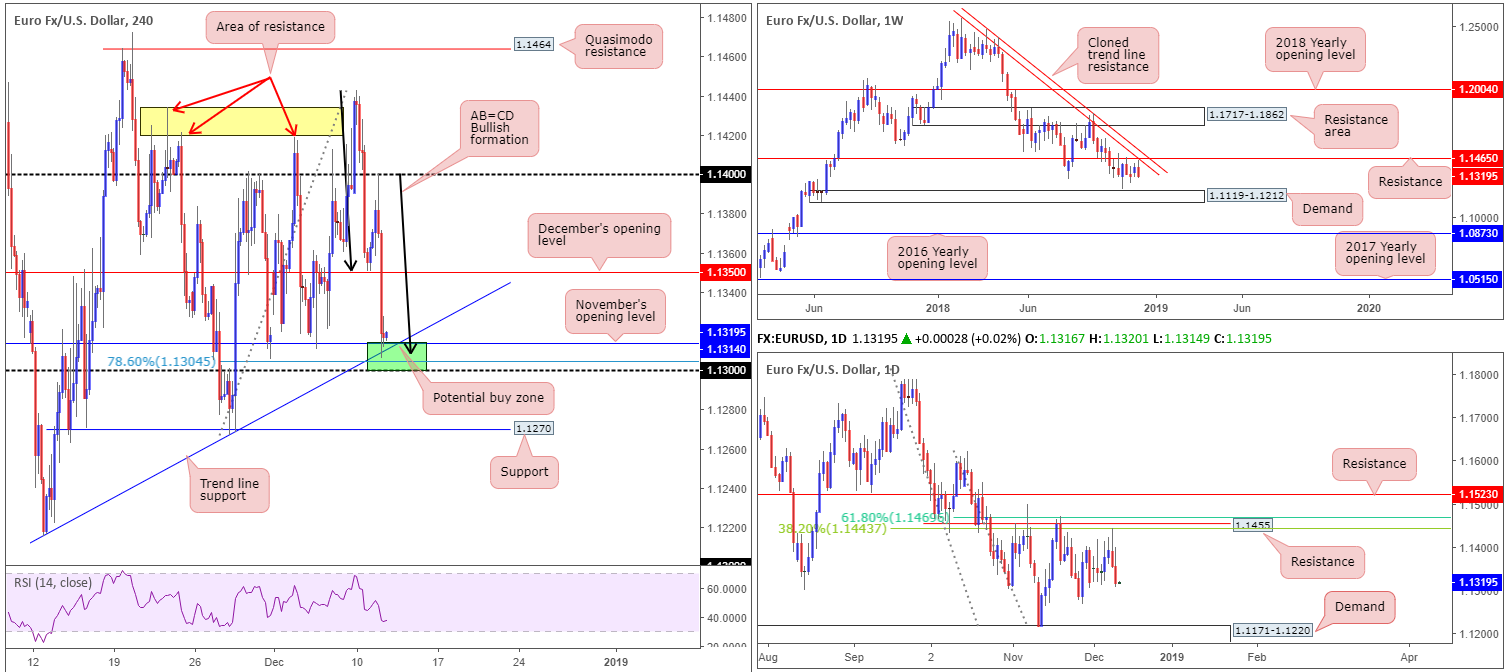
The single currency relinquished further ground to the US dollar Tuesday, recording its second consecutive daily loss. The pair met strong selling at 1.14 mid-way through London’s session and aggressively turned lower. The move was later exacerbated on hotter-than-expected US PPI numbers – US PPI rose 0.1% in November, decelerating from the 0.6% in October amid a slump in oil prices.
The US dollar index concluded the day clipping the underside of 97.50, while the EUR/USD H4 candles shook hands with a rather interesting base of support drawn from 1.13/1.1314 (green – comprised of November’s opening level at 1.1314, a trend line support (taken from the low 1.1215), a 78.6% Fibonacci support value at 1.1304 and a round number at 1.13). In addition to this, recent movement also chalked up a nice-looking AB=CD bullish pattern (black arrows) that terminates within the said green zone, therefore complementing the overall structure.
With respect to the higher timeframes, structure remains unchanged:
Weekly price turned south just ahead of resistance priced in at 1.1465, which, as you can probably see, brings with it a nearby cloned trend line resistance (extended from the high 1.2413). Further selling has demand at 1.1119-1.1212 to target. A closer reading on the daily timeframe adds a proven base of resistance circulating around the 1.1455 region. What’s appealing here, other than the fact the level capped upside three times in November and is closely linked to the weekly resistance mentioned above at 1.1465, is the merging Fibonacci resistances: a 61.8% and a 38.2% at 1.1469 and 1.1443, respectively. Note price recently turned lower just ahead of the 38.2% Fibonacci resistance. The next downside target on this scale falls in around demand at 1.1171-1.1220 (glued to the top edge of the current weekly demand area).
Areas of consideration:
Medium term, the 1.13/1.1314 region marked in green on the H4 timeframe appears a reasonable location for a bounce higher today. Why only a bounce comes down to both weekly and daily timeframes indicating a somewhat bearish vibe at the moment.
As for entry, traders have the choice of waiting for additional candlestick confirmation to form and entering based on the selected structure, or simply entering at 1.1314 and positioning stop-loss orders beneath 1.13.
1.1350 (December’s opening level) appears to be a logical starting point in terms of take-profit targets.
Today’s data points: US CPI m/m; US Core CPI m/m.
GBP/USD:
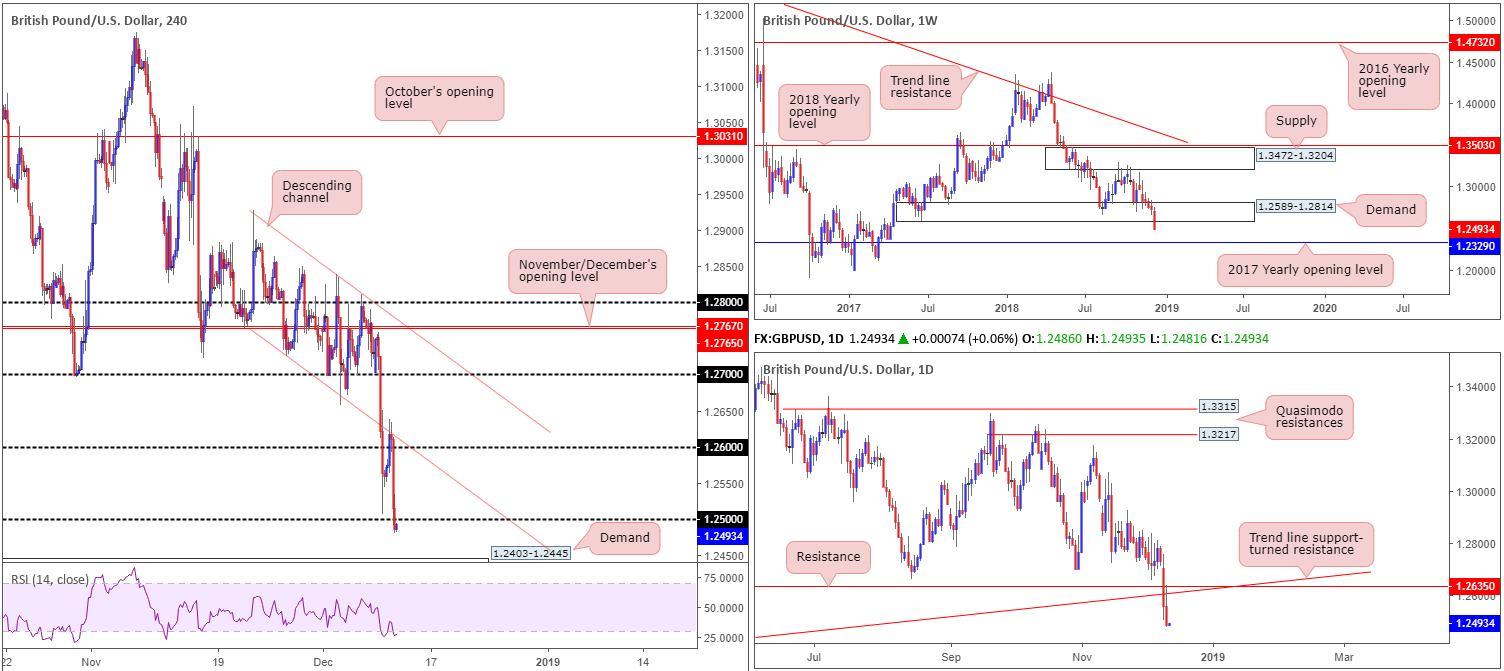
The British pound failed to sustain its return to 1.26+ status Tuesday, recoiling amidst ongoing Brexit uncertainty, despite UK average earnings printing an upbeat reading. News that Germany’s Merkel rejected UK PM May’s attempt to renegotiate a Brexit deal, along with renewed speculation MPs have sent 48 letters for a non-confidence vote, pulled sterling southbound.
From a technical perspective, the H4 candles crossed swords with the underside of a recently broken descending channel and then swiftly reclaimed 1.26, and eventually 1.25 into the closing stages of the day. The break of 1.25 has placed the spotlight on a possible run towards nearby demand at 1.2403-1.2445.
Higher-timeframe structure reveals weekly demand at 1.2589-1.2814 has likely relinquished the majority of its strength on yesterday’s selling, potentially setting the stage for further downside towards the 2017 yearly opening level at 1.2329. In similar fashion, Tuesday’s movement also extended Monday’s break of support at 1.2635 (now acting resistance) and a trend line support (taken from the low 1.1904). The next support target on the daily scale falls in around 1.2374 (not seen on the screen).
Areas of consideration:
In light of the bleak fundamental picture out of the UK right now, and both weekly and daily charts emphasizing additional selling might be at hand, shorts around the underside of the 1.25 handle on the H4 timeframe are an option today.
Knowing round numbers are prone to fakeouts, however, traders are urged to wait for additional candlestick confirmation before pulling the trigger (entry/stop parameters can be defined according to this pattern). From here, traders can look to target the H4 demand mentioned above at 1.2403-1.2445 as the initial port of call, followed by daily support plotted at 1.2374.
Today’s data points: US CPI m/m; US Core CPI m/m.
AUD/USD:
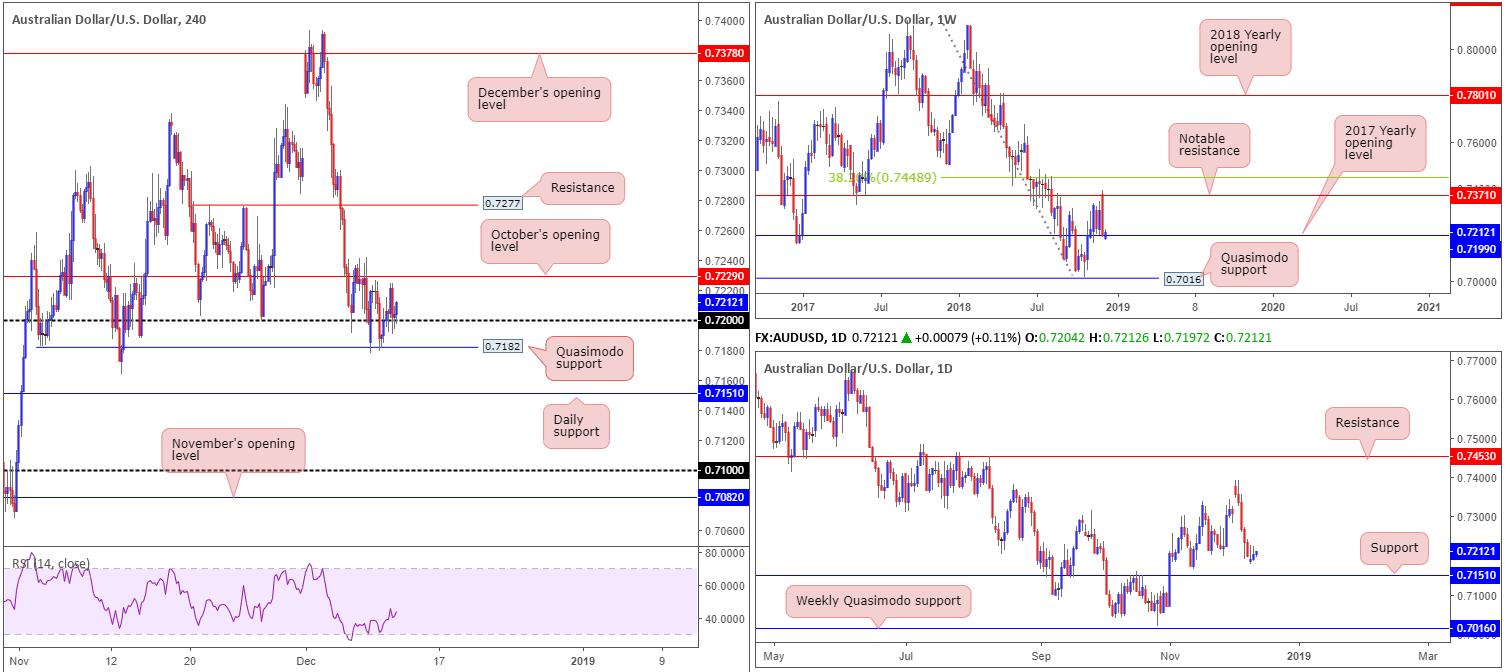
The Australian dollar eked out another marginal gain vs. its US counterpart Tuesday, as H4 action established a floor off Quasimodo support at 0.7182/the 0.72 handle. Gains, in part, were prompted by positive developments on the US-China trade front following reports of constructive dialogue between Washington and Beijing – China was said to have made a proposal to cut tariffs on US auto imports to 15% from 40%.
As is evident from the H4 timeframe, overhead resistance remains positioned close by at 0.7229: October’s opening level. Beyond here, the research team notes a reasonably clear pathway towards resistance at 0.7277.
The outlook on the weekly timeframe continues to reflect a bullish stance as long as the 2017 yearly opening level at 0.7199 remains intact (effectively represents the 0.72 handle on the H4 scale). Daily flow, on the other hand, shows potential to pop lower and bring in buyers from support at 0.7151.
Areas of consideration:
A H4 close above October’s opening level at 0.7229 would, given where we’re coming from on the weekly timeframe, be considered a bullish cue to take things higher. Traders have the choice of simply buying the breakout above 0.7229 with stop-loss orders plotted beneath breakout candle’s low, or for more conservative traders, wait and see if price retests 0.7229 as support in the shape of a bullish candlestick pattern and enter on the selected structure. Either way, the first take-profit target resides around the H4 resistance mentioned above at 0.7277.
Today’s data points: US CPI m/m; US Core CPI m/m.
USD/JPY:
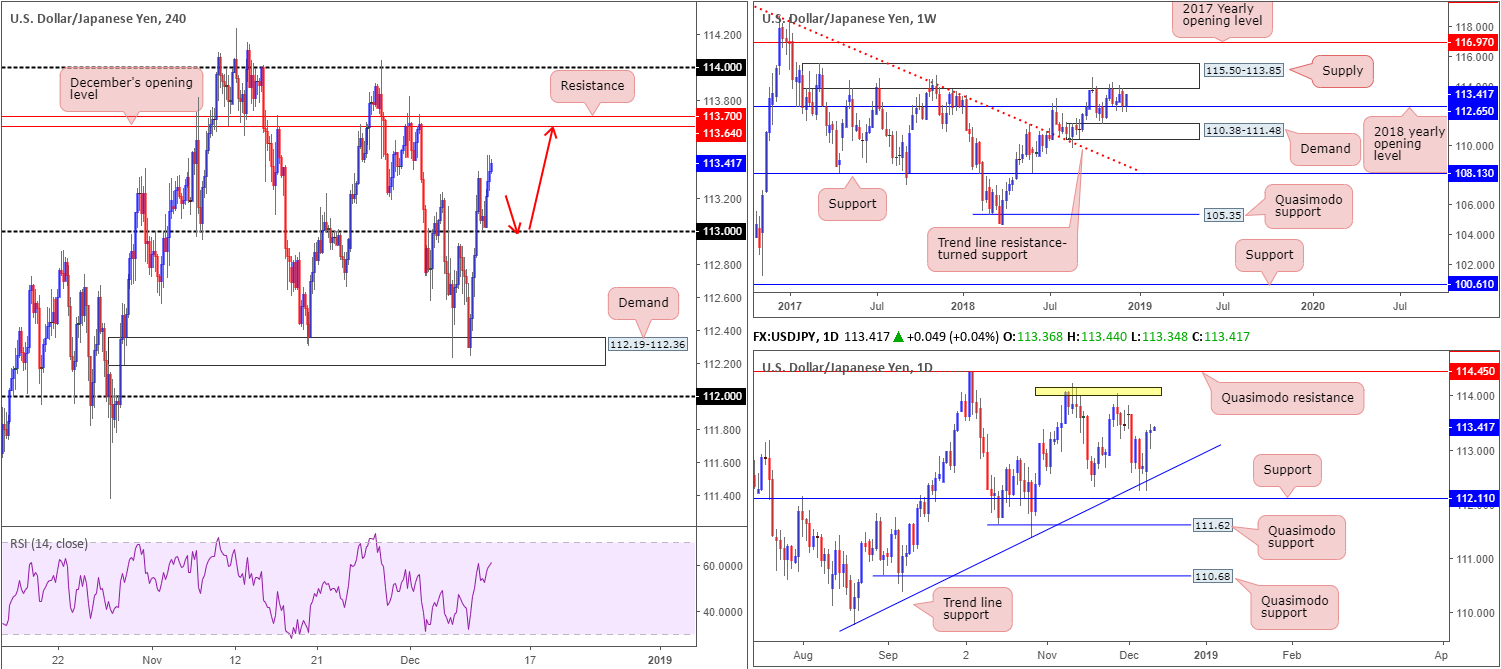
For those who read Tuesday’s briefing you may recall the piece underlining a potential retest play off 113 as support, targeting December’s opening level at 113.64/H4 resistance at 113.70 (red arrows). As is evident from the H4 chart, price action retested 113 and responded beautifully. Well done to any of our readers who managed to jump aboard this move.
113 attracted the research team’s attention largely on the back of where the market is trading from on the bigger picture. Weekly price is seen rebounding from the 2018 yearly opening level at 112.65, and daily movement recently checked in with a trend line support (etched from the low 109.77).
In terms of upside targets at current price, H4 structure shows resistance residing around December’s opening level at 113.64, trailed closely by resistance at 113.70. These two levels, as highlighted above, remain the first port of call for longs off 113. Note just above these H4 levels we also have the underside of weekly supply positioned at 115.50-113.85, and daily price appears poised to approach tops located around the 114.05ish neighbourhood.
Areas of consideration:
Aside from yesterday’s bounce off 113, there’s not really much to hang our hat on in terms of high-probability trading setups today. Once again, though, well done to those who bought 113, the risk/reward is incredibly attractive!
Today’s data points: US CPI m/m; US Core CPI m/m.
USD/CAD:
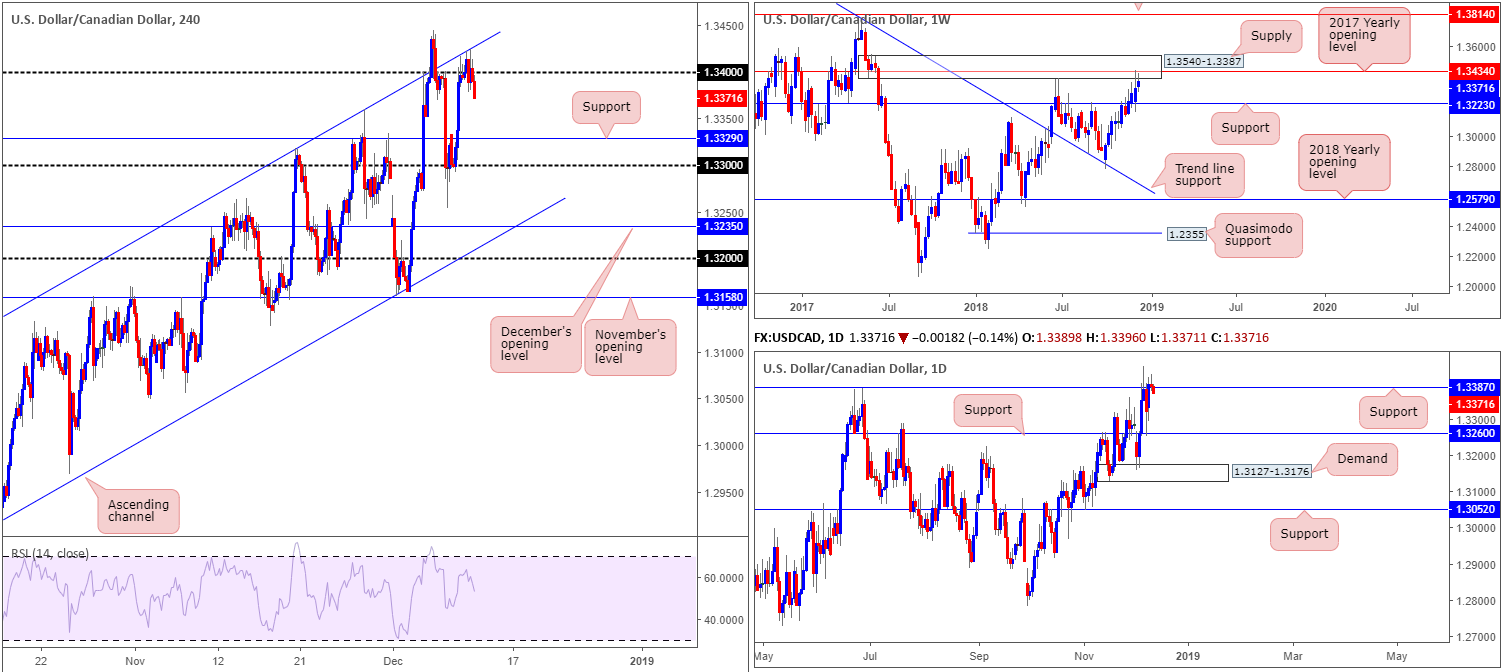
USD/CAD prices are effectively unchanged this morning. Given the somewhat lackluster performance Tuesday, much of the following piece will echo thoughts put forward in yesterday’s briefing.
In terms of where we stand on the H4 timeframe, the candles are seen testing the 1.34 handle and nearby channel resistance (extended from the high 1.3317). As of writing, though, the sellers appear to have the upper hand as price explores ground beneath 1.34.
With respect to the higher-timeframe action, weekly price is seen challenging supply at 1.3540-1.3387/the 2017 yearly opening level at 1.3434, whereas daily movement is struggling to register anything noteworthy above 1.3387: a resistance-turned support.
Areas of consideration:
With weekly supply at 1.3540-1.3387 in play, along with 1.34 and a H4 channel resistance also in motion, a pullback to lower levels may still be on the cards towards H4 support priced in at 1.3329.
Waiting for a decisive H4 bearish candlestick formation to print off 1.34 is recommended before pulling the trigger, as not only will this display seller intent, it’ll also provide entry/stop parameters. An alternative would be for the current H4 bearish candle to close as is. This, by and of itself, emphasizes seller strength and is likely enough to bring the market lower, given where we’re coming from on the higher timeframes. Entry at the close of the candle is recommended, with stop-loss orders either placed above the candle’s wick, or above the noted H4 channel resistance line.
Today’s data points: US CPI m/m; US Core CPI m/m.
USD/CHF:
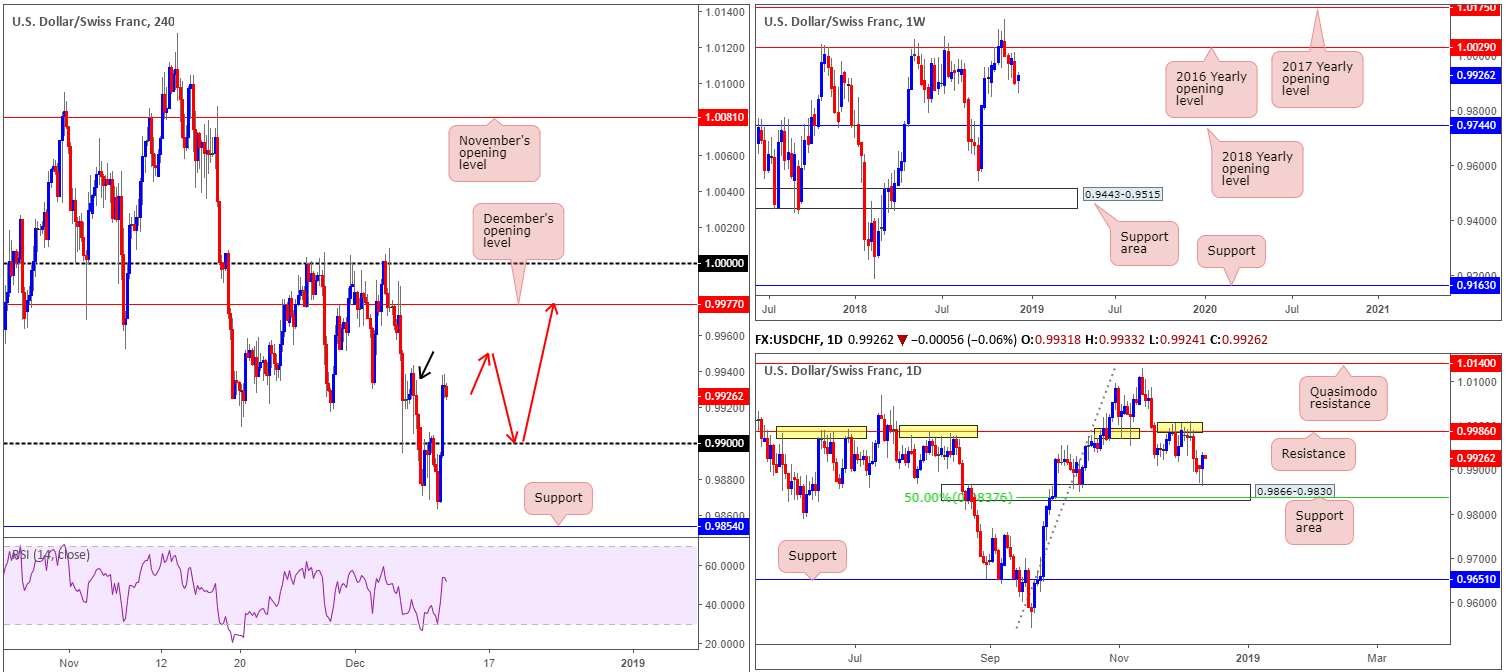
The USD/CHF fell to lows of 0.9863 amid early London hours Tuesday – the lowest level since October 16 – though swiftly recovered and reclaimed 0.99+ status, reaching highs of 0.9938 into the close. The rebound found its legs on the back of broad-based USD buying (DXY tested its 97.50 mark) as well as ongoing concerns regarding Brexit and the Italian budget drama.
Technically speaking, yesterday’s recovery was, in part, likely influenced by the daily support area brought into the mix at 0.9866-0.9830. Further buying from this point has notable daily resistance at 0.9986 to target. With H4 price action seen mildly responding from possible supply marked with a black arrow at 0.9943-0.9926, the market may observe a pullback and retest 0.99 as support today. A retest of 0.99 has an upside target set at 0.9977: December’s opening level, trailed closely by daily resistance mentioned above at 0.9986 (that is assuming a large majority of sell orders are already consumed from the said H4 supply zone).
Areas of consideration:
Having seen daily buyers recently enter the mix, a retest off of 0.99 today in the shape of a bullish candlestick configuration (entry/stop parameters can be defined according to this pattern) would likely be enough to justify a long position in this market. As for upside targets, as highlighted above, the research team feels December’s opening level at 0.9977 is a reasonable objective, though traders are urged to keep a close eye on the current H4 supply marked with a black arrow at 0.9943-0.9926, as sellers may remain active around this region.
An alternative scenario for traders unsure of the H4 supply would be for H4 price to engulf the area and then follow up with a retest of 0.99. That way, traders can be relatively sure sellers are removed from the equation here (red arrows), consequently freeing the pathway north to higher levels.
Today’s data points: US CPI m/m; US Core CPI m/m.
Dow Jones Industrial Average:
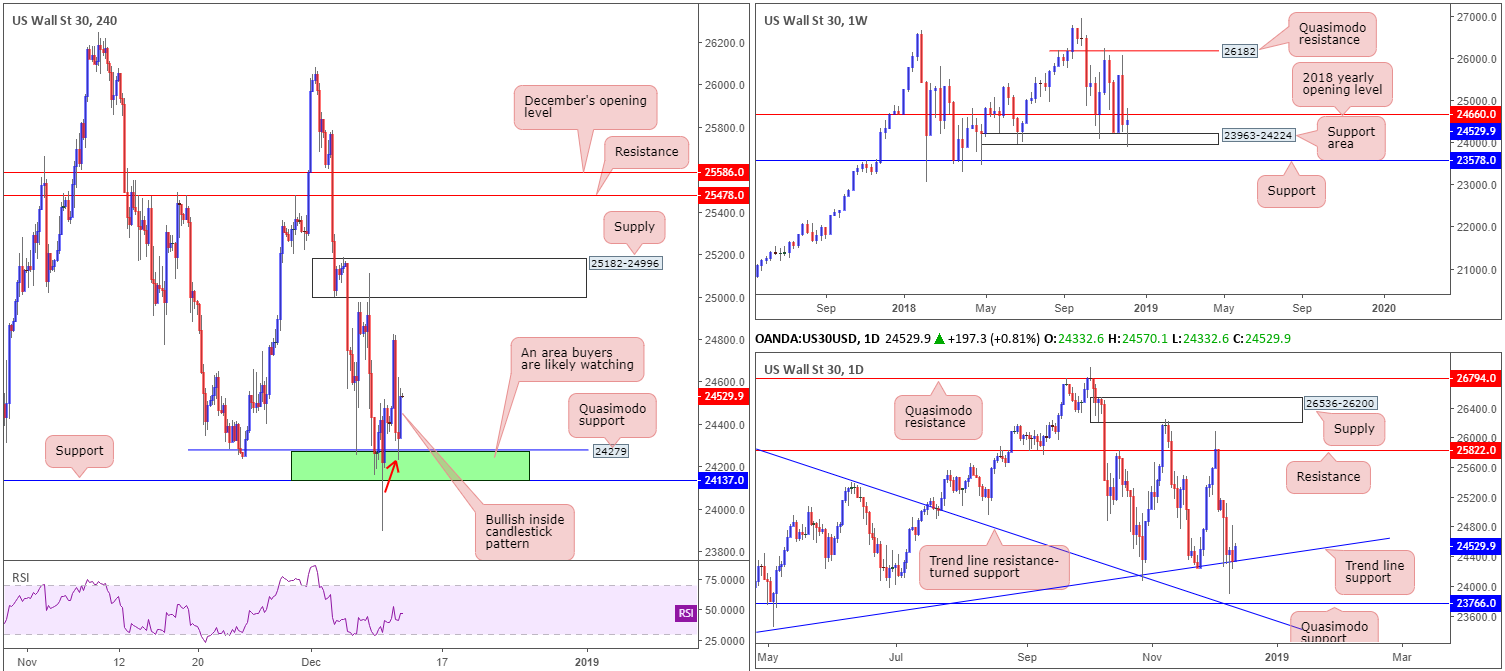
US equities entered into a choppy phase Tuesday. The market began the session on strong footing amid optimism surrounding renewed US-China trade talks. However, due to the prospects of a government shutdown over border-wall funding, markets turned lower.
From a technical perspective, weekly price structure is capped between a noteworthy area of support at 23963-24224 and its 2018 yearly opening level at 24660. Daily movement, on the other hand, continues to hold ground off a trend line support (etched from the low 23055), with eyes on resistance at 25822 as the next upside target.
For folks who read Tuesday’s briefing you may recall the piece highlighted a possible buying opportunity off 24137/24279 (green – comprised of a H4 Quasimodo support at 24279, a H4 support at 24137 and the top edge of the said weekly support area at 24224).
Areas of consideration:
In recent hours, the index printed a nice-looking H4 inside bullish candlestick signal off 24137/24279. This – coupled with daily price finding a floor off trend line support – is likely enough to draw in buyers and explore higher levels today.
In terms of stop-loss placement should you wish to attempt a long at current price, either beyond the low of the bullish candlestick formation (24231 – red arrow), or beyond the green H4 buy zone itself (24137) appear reasonable locations. As for an initial take-profit target, the underside of the 2018 yearly opening level on the weekly timeframe mentioned above at 24660 appears a logical starting point.
Today’s data points: US CPI m/m; US Core CPI m/m.
XAU/USD (Gold):
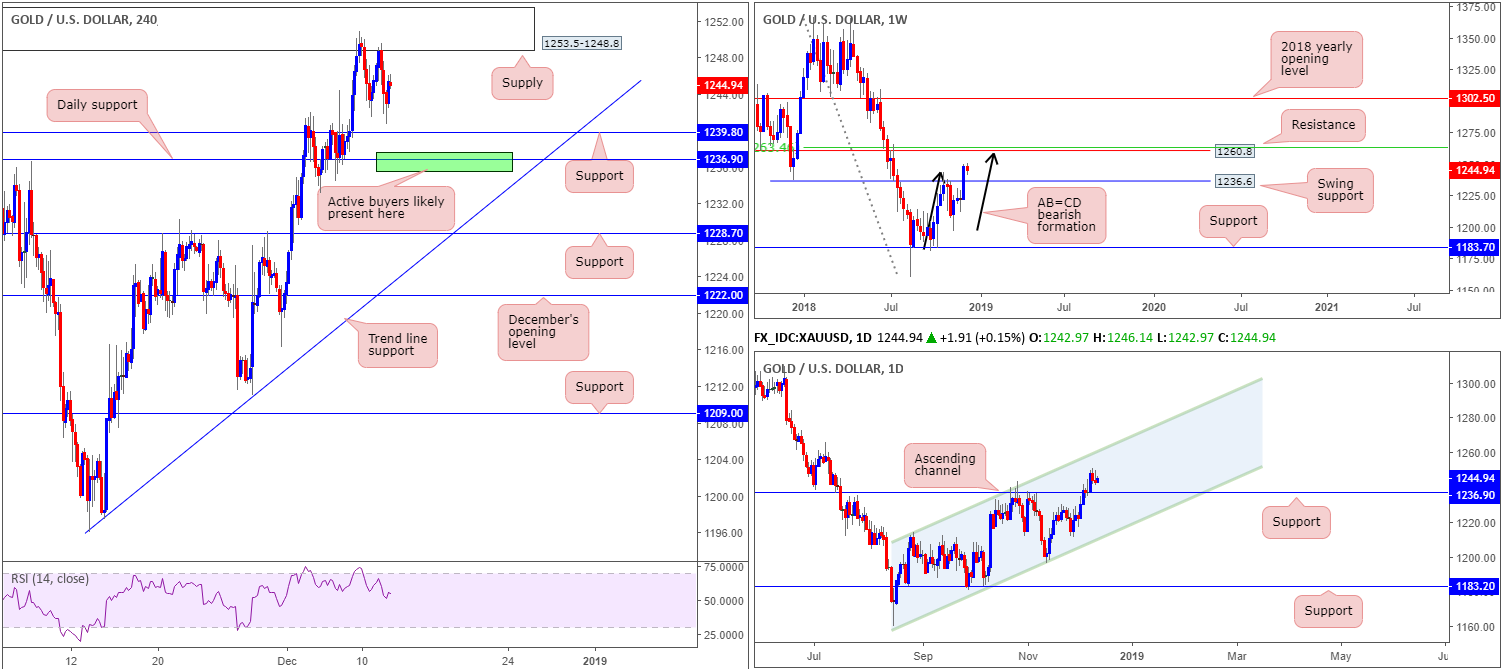
On the whole, there was marginal change in terms of price movement Tuesday (-0.09%). H4 supply at 1253.5-1248.8, as you can see, remains in the fold. Beneath this area, we have a H4 support present nearby at 1239.8, trailed closely by a daily support level priced in at 1236.9. This daily level is also represented as a swing support on the weekly timeframe at 1236.6.
In regards to higher-timeframe action, further buying is still very much on the cards, according to our technical studies. Weekly price action has eyes on resistance at 1260.8, which happens to also be joined by a possible AB=CD bearish completion point (black arrows) and a nearby 50.0% resistance value at 1263.4. Daily price, on the other hand, has a channel resistance (etched from the high 1214.3) to target.
Areas of consideration:
Ultimately, the research team believes if the market tests daily support highlighted above at 1236.9 today, a rotation to the upside will highly likely be observed. This is simply because both weekly and daily timeframes agree support resides around 1236.9ish.
Should the metal explore higher ground today from current prices, however, and challenge the current H4 supply, waiting for the area to be engulfed is recommended over selling the zone. A break above this area followed by a pullback to the daily support at 1236.9 places the market in good stead for a rally towards weekly resistance at 1260.8. The break through H4 supply theoretically clears the majority of sellers out of the market, unlocking the pathway north to higher levels.
The use of the site is agreement that the site is for informational and educational purposes only and does not constitute advice in any form in the furtherance of any trade or trading decisions.
The accuracy, completeness and timeliness of the information contained on this site cannot be guaranteed. IC Markets does not warranty, guarantee or make any representations, or assume any liability with regard to financial results based on the use of the information in the site.
News, views, opinions, recommendations and other information obtained from sources outside of www.icmarkets.com.au, used in this site are believed to be reliable, but we cannot guarantee their accuracy or completeness. All such information is subject to change at any time without notice. IC Markets assumes no responsibility for the content of any linked site. The fact that such links may exist does not indicate approval or endorsement of any material contained on any linked site.
IC Markets is not liable for any harm caused by the transmission, through accessing the services or information on this site, of a computer virus, or other computer code or programming device that might be used to access, delete, damage, disable, disrupt or otherwise impede in any manner, the operation of the site or of any user’s software, hardware, data or property.


