
Key risk events today:
US Core PPI m/m; US PPI m/m; Crude Oil Inventories.
EUR/USD:
Trading volume remained light Tuesday, confined within the previous range. The US dollar index is somewhat firmer, though was also within Monday’s trading range, with desks attributing the limited bouts of upside to risk aversion, as stocks turned lower.
Considering recent movement, much of the following analysis will echo thoughts aired in Tuesday’s report.
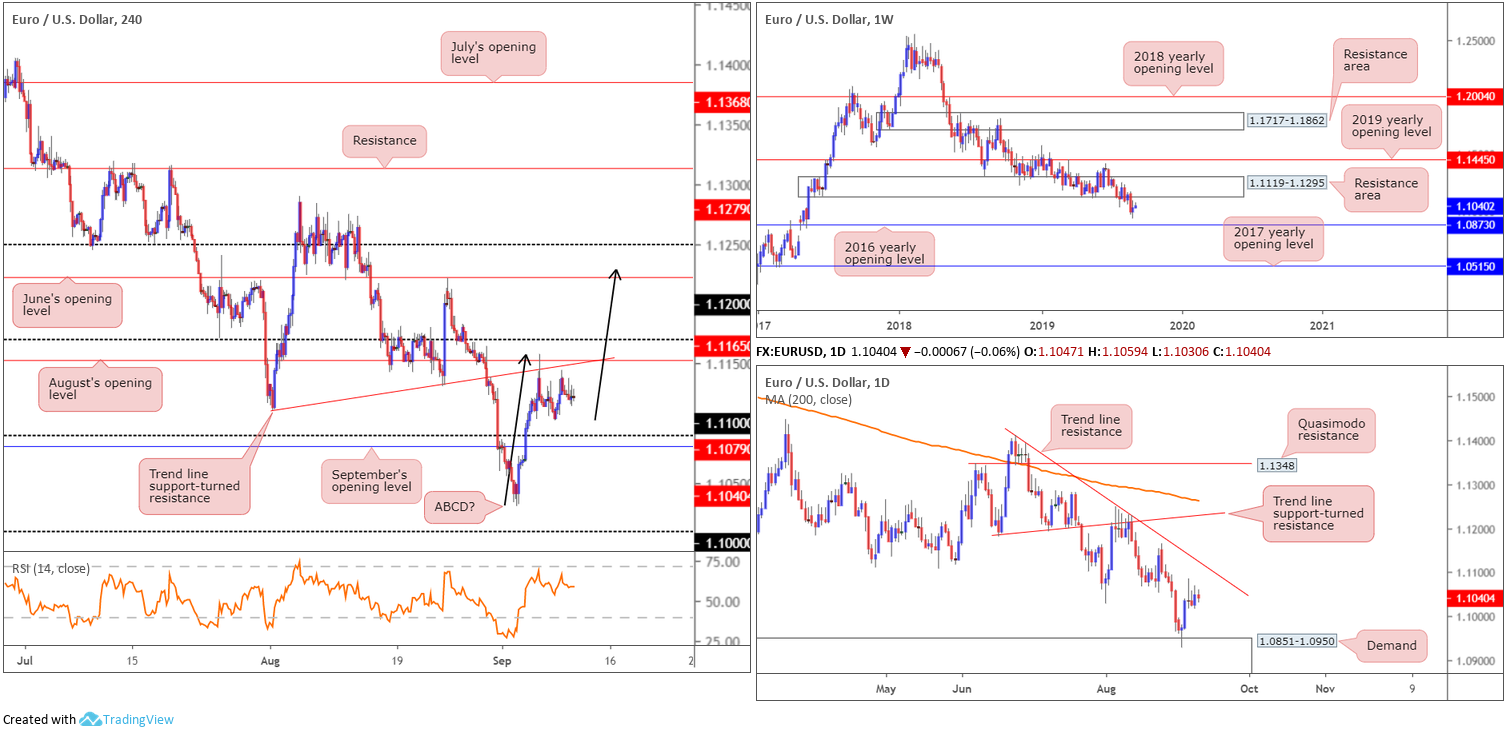
The EUR/USD is languishing south of 1.1119-1.1295 on the weekly timeframe, a demand-turned resistance area. Current action is leaning towards a retest of the zone, though a run to the 2016 yearly opening level at 1.0873 is also a possibility.
Elsewhere, daily flow remains buoyed by demand pencilled in at 1.0851-1.0950 – houses the 2016 yearly opening level within its lower limits – poised to approach trend line resistance taken from the high 1.1412. A closer reading of price action on the H4 timeframe, however, has the candles capped beneath August’s opening level at 1.1079 and a nearby trend line support-turned resistance (extended from the low 1.1026). Beyond here, the research team notes possible resistance emerging from 1.11 and June’s opening level at 1.1165, which also merges closely with an ABCD correction (black arrows) at 1.1173.
Areas of consideration:
According to the chart studies on all three timeframes, this remains a sellers’ market right now. The problem is knowing which H4 resistance will hold, if any. A short from August’s opening level at 1.1079 and its intersecting trend line resistance may hold, for example, whereas we might press higher and attack the 1.11 handle and the closely converging daily trend line resistance, which may also hold, as might June’s opening level at 1.1165.
The best way to overcome this is wait and see how H4 action behaves at the said resistances. A bearish configuration from either barrier, for instance, helps identify seller intent and provides strict entry and risk levels to work with.
GBP/USD:
By way of a clear-cut daily Doji candlestick formation, sterling held at the upper end of Monday’s range on Tuesday. The pound was underpinned on the back of upbeat UK employment data, with the UK unemployment rate ticking lower to 3.8%, lower than a year earlier (4.0%) and unchanged on the quarter. Bank of England Governor, Mark Carney, also kept the currency on the winning side of the table, stating ‘the core of the financial system in the UK is ready for Brexit whatever form it takes’.
UK Parliament is now prorogued, possibly allowing the GBP to adopt a quieter path of trade, though desks still see election risks presenting downside to GBP, and as such, it remains a sell on rallies, desks say.
Overall, limited change is visible in terms of technical structure, therefore much of the following piece will represent Tuesday’s analysis.
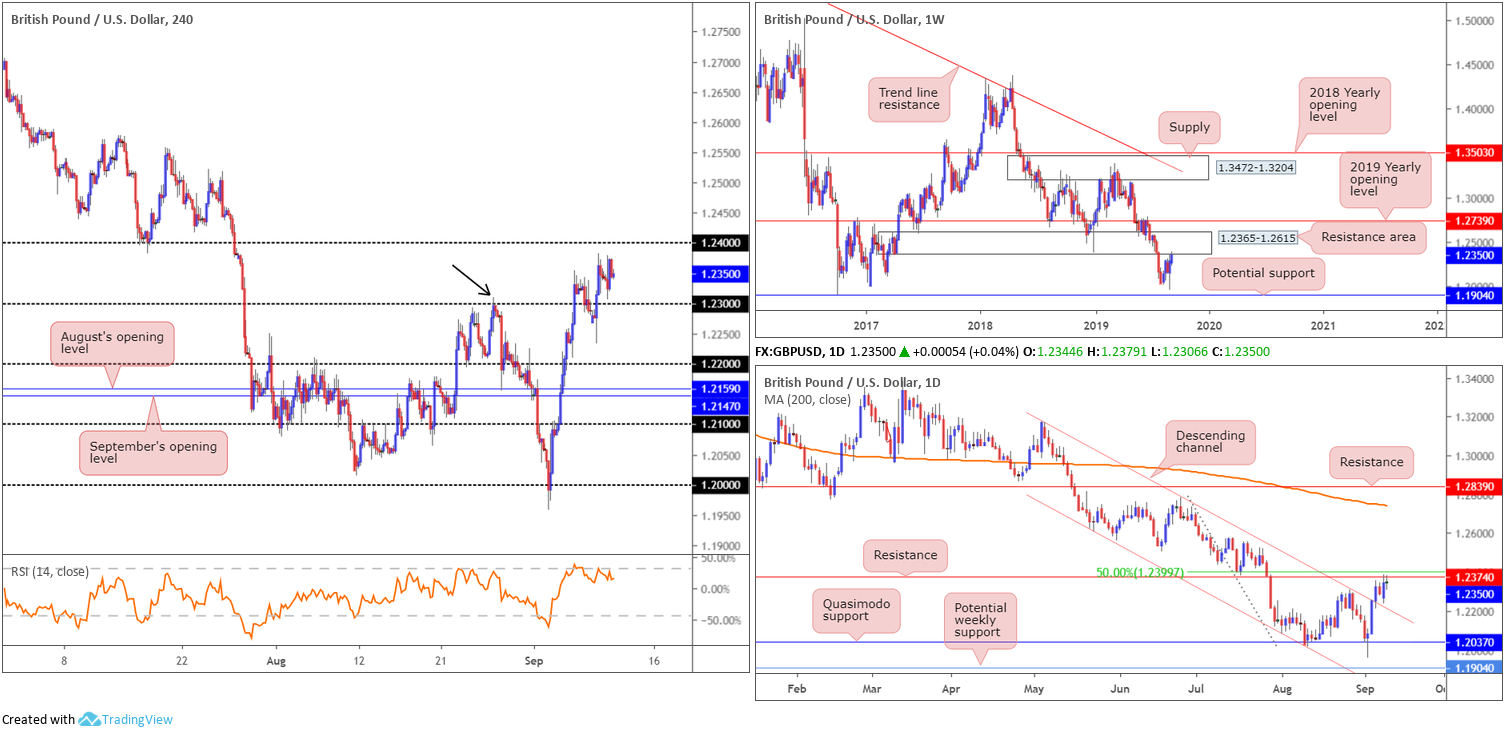
From a technical perspective, having seen the notable high set at 1.2309 (black arrow) recently engulfed on the H4 scale, traders, particularly on the H4 timeframe and lower, are likely eyeing higher movement. However, this comes at a price. Higher-timeframe analysis has a weekly resistance area positioned at 1.2365-1.2615 in motion, and daily price tackling resistance at 1.2374, closely shadowed by the 50.0% resistance value at 1.2399.
Areas of consideration:
Considering the technical position on the higher timeframes, sellers are likely to make an appearance. Before pressing the sell button, though, traders are urged to let H4 price prove itself: reclaiming 1.23 to the downside and likely clearing the pathway to at least 1.22. A H4 close below 1.23 that’s followed up by a retest is an ideal sell signal (entry and risk can be determined on the back of the rejection candle).
AUD/USD:
Following an impressive five-day bullish run, collectively adding nearly 130 points, the AUD/USD pair entered a consolidative phase Tuesday. Earlier in the day the National Bank of Australia reported both business confidence and conditions declined in the month, with both now at +1 index point – well below long-run averages. This outcome suggests momentum in the business sector continues to weaken, with both confidence and conditions well below the levels seen in 2018. In addition to this, China’s CPI rose 2.8% y/y, beating 2.6% expected, and the producer price index slumped to -0.8% y/y.
Technically speaking, things remain unchanged.
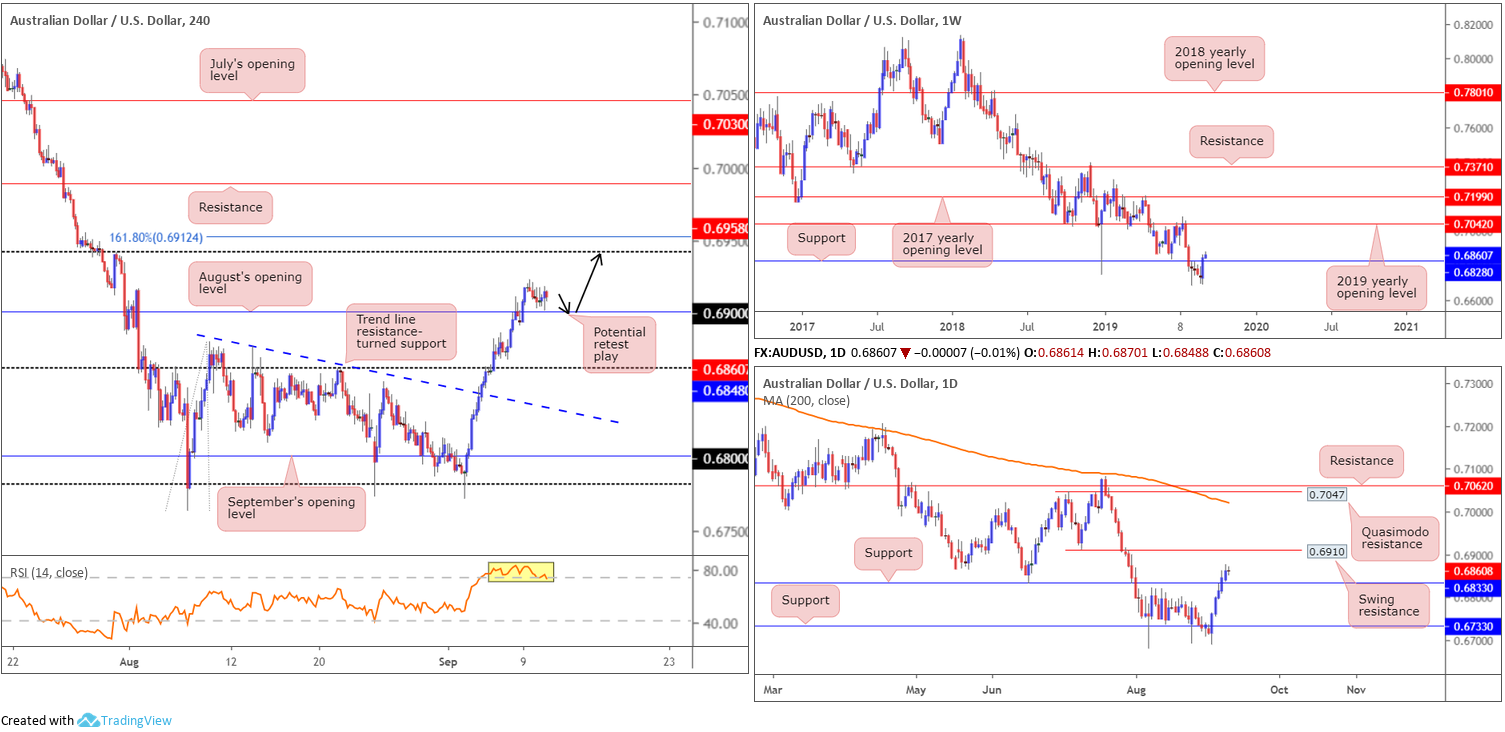
Kicking things off on the weekly timeframe, we can see the pair staged a strong comeback last week. By way of a bullish outside day, the unit wrapped up the week north of support at 0.6828. If buyers remain in the driving seat, an approach towards the 2019 yearly opening level at 0.7042 is likely on the cards.
In conjunction with weekly structure, the daily timeframe also ended last week north of support at 0.6833. The next upside target on this scale, nonetheless, falls in at 0.6910, a swing resistance, though beyond here we have eyes on Quasimodo resistance at 0.7047 and resistance at 0.7062. It might also interest some traders to note the 200-day SMA lurks close by at 0.7023 (orange).
Across the page, H4 movement recently overthrew August’s opening level at 0.6848, potentially clearing the runway to 0.69, closely followed by a 161.8% Fibonacci ext. point at 0.6912. Indicator-based traders may also wish to acknowledge the RSI is set deeply within overbought territory (yellow).
Areas of consideration:
Considering the increasingly strong bullish theme on the higher timeframes, entering long based on a retest at August’s opening level drawn from 0.6848 on the H4, could be an option. A retest of this level in the shape of a H4 bullish candlestick signal will likely entice buyers into the market, with eyeballs on 0.69 as the initial upside target, set just beneath daily resistance at 0.6910 and the 161.8% H4 Fibonacci ext. point mentioned above at 0.6912.
USD/JPY:
US Treasury yields continued to explore higher ground Tuesday, with the 10-year note reaching highs of 1.74%. Also reinforcing the USD/JPY was rising US equity markets.
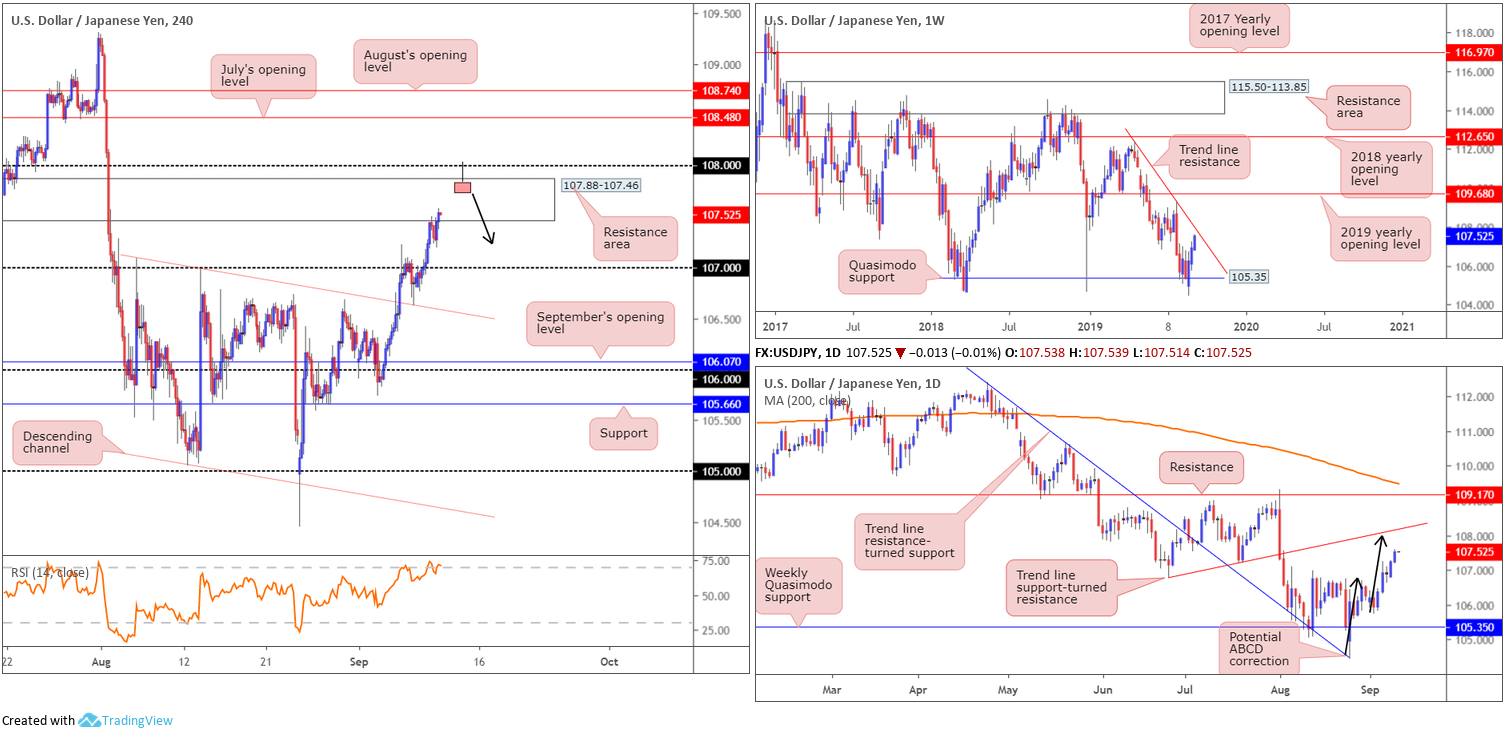
Recent bidding witnessed the USD/JPY’s H4 candles enter the parapets of a resistance area coming in at 107.88-107.46. The said zone boasts a reasonably strong standing, therefore a response from within its walls is possible. Directly overhead, traders may also wish to acknowledge possible resistance emerging from 108. It may also interest some traders to note the RSI indicator is seen testing overbought territory.
In terms of where we stand on the weekly timeframe, as highlighted in Tuesday’s analysis, Quasimodo support at 105.35 held form, prompting a possible revisit at trend line resistance (extended from the high 112.40). Note this trend line also happens to intersect with the upper boundary of the H4 resistance area highlighted above at 107.88-107.46. Looking at the daily timeframe, the technical picture emphasises further upside may be in store, targeting trend line support-turned resistance (extended from the low 106.78) in the shape of a potential ABCD correction terminating at 108.
Areas of consideration:
Although a response is possible from the H4 resistance area at 107.88-107.46, a fakeout through this area to orders sitting at 108 is also a strong possibility. Also note the current weekly trend line resistance intersects with the UPPER limit of the H4 resistance zone and the daily candles are on course to complete an ABCD correction at 108.
Based on the chart studies, everything points to a move towards 108ish before sellers step in. An ideal scenario would be for H4 price to chalk up a bearish candlestick configuration that pierces through the upper edge of the current H4 resistance area, tripping a portion of buy stops, and tagging in sellers from 108 (see chart for a visual representation of a shooting star pattern).
USD/CAD:
For traders who read Tuesday’s analysis you may recall the following:
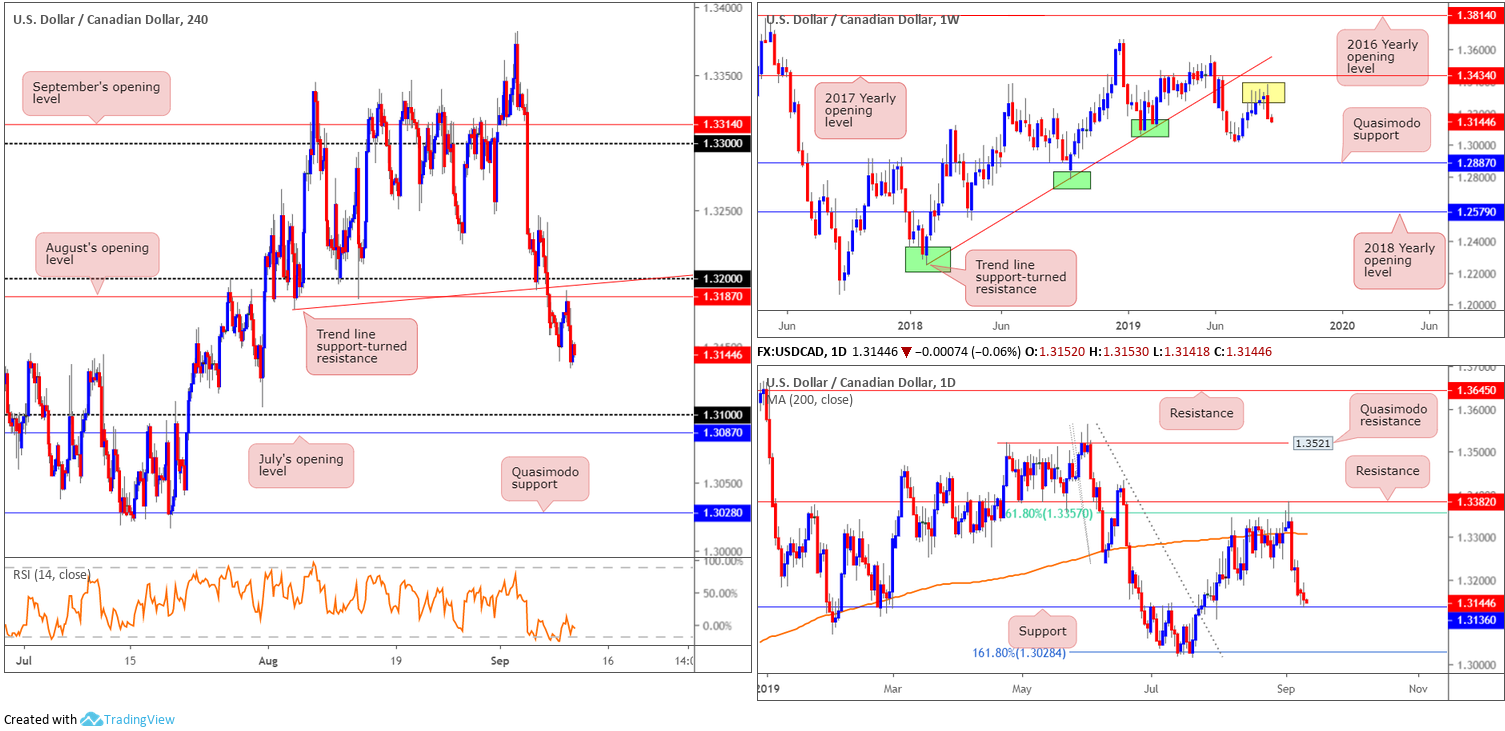
August’s opening level at 1.3187 is a notable resistance level as daily price has yet to connect with support at 1.3136 and we also have another layer of resistance closely supporting 1.3187 at 1.32 and a trend line support-turned resistance (taken from the low 1.3177). Therefore, a retest of 1.32/1.3187 today, preferably formed by way of a H4 bearish candlestick pattern (entry/risk can be determined according to this structure), is certainly an option with an initial downside objective set at 1.3136, the noted daily support level.
As can be seen from the H4 chart this morning, price action retested 1.3187 and produced a solid bearish rejection candle. Daily support at 1.3136 was shortly after brought into the mix in the form of a bearish outside day. Well done to any of our readers who managed to jump aboard this move. Beyond the current daily support, the 161.8% Fibonacci ext. point resides at 1.3028, which held price action higher throughout July.
In terms of the weekly timeframe, Tuesday’s analysis aired the following:
Leaving the 2017 yearly opening level at 1.3434 unchallenged on the weekly timeframe, last week’s movement wrapped up the week deeply within bearish territory. Down more than 1.00% and forming a clear-cut bearish outside day, traders’ focus will likely be on the 1.3016 July 15 low, followed by Quasimodo support at 1.2887.
Areas of consideration:
Those who remain short from 1.3187 are likely watching for daily support at 1.3136 to give way, as this clears the runway to 1.31, closely followed by July’s opening level at 1.3087.
Aside from the short in motion, there’s not much else to hang our hat on at this time.
USD/CHF:
USD/CHF action enters Wednesday unchanged, forming a clear-cut Doji formation Tuesday and ranging no more than 45 points.
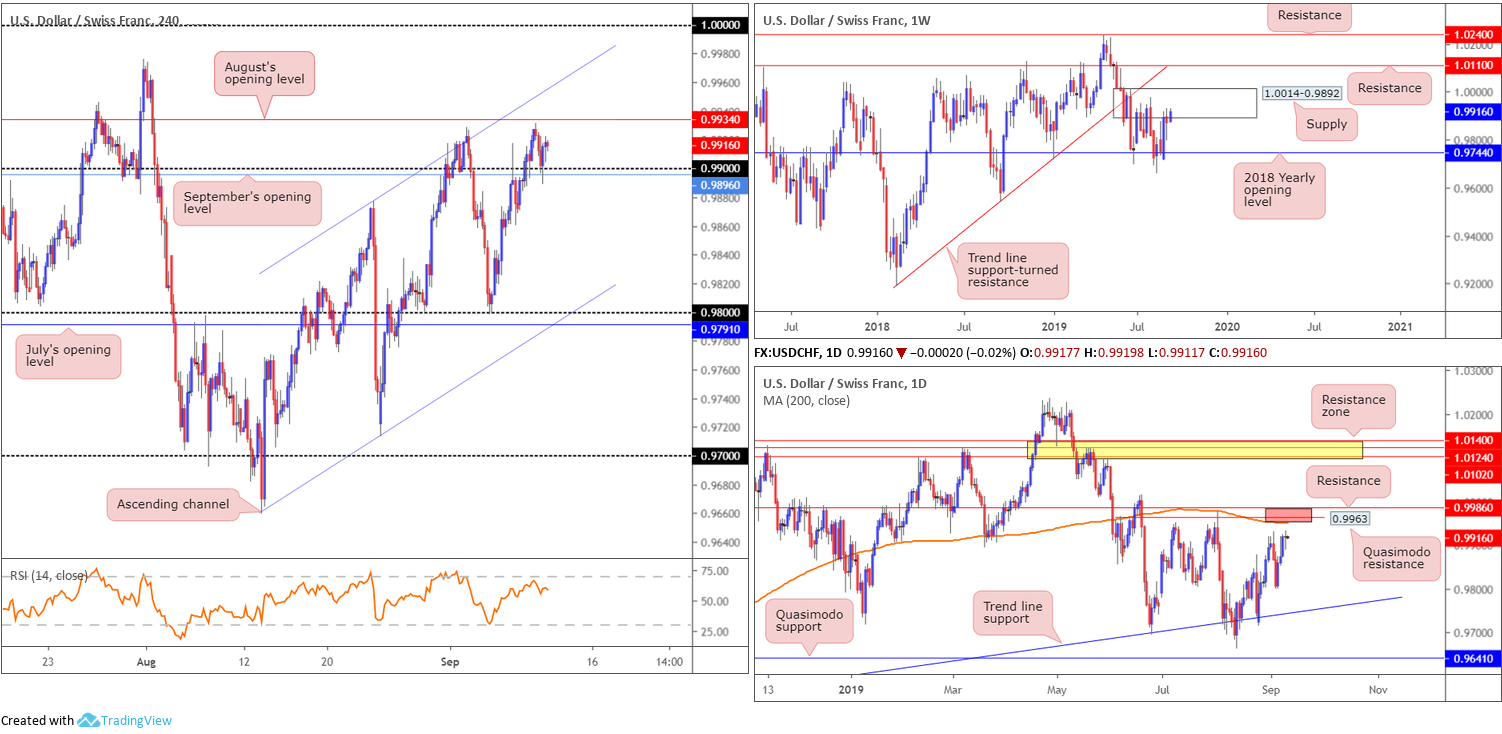
Higher-timeframe technical analysis, as underscored in Tuesday’s report, has the weekly candles climbing higher into the walls of a familiar supply zone coming in at 1.0014-0.9892. In the event buyers brush aside the said supply (unlikely a straightforward feat), resistance at 1.0110 is in view, as is a long-term trend line support-turned resistance taken from the low 0.9187.
A closer interpretation of price action on the daily timeframe shows an impressive recovery off trend line support (etched from the low 0.9542), which since mid-August has seen the candles grind higher. Areas of interest to the upside fall on Quasimodo resistance at 0.9963, a 200-day SMA (orange – 0.9953) and resistance coming in from 0.9986.
H4 price, on the other hand, is seen establishing support off the 0.99 handle and September’s opening level at 0.9896. August’s opening level at 0.9934 is considered the next upside hurdle, closely shadowed by channel resistance extended from the high 0.9877.
Areas of consideration:
With weekly players trading from supply at 1.0014-0.9892, the research team has eyes on the daily resistance area between 0.9986/0.9953 (red) for possible shorting opportunities. An ideal entry point would be the H4 channel resistance highlighted above, as this line intersects with the said daily zone. A test of this area in the shape of a H4 bearish candlestick signal (entry and risk to be set according to this structure) is considered a high-probability setup.
Dow Jones Industrial Average:
Major US benchmark indexes wrapped up Tuesday mostly higher, erasing much of an early slide as investors continued to gravitate to value shares. The Dow Jones Industrial Average added 73.92 points, or 0.28%; the S&P 500 added 0.96 points, or 0.03% and the tech-heavy Nasdaq 100 declined 17.66 points, or 0.23%.
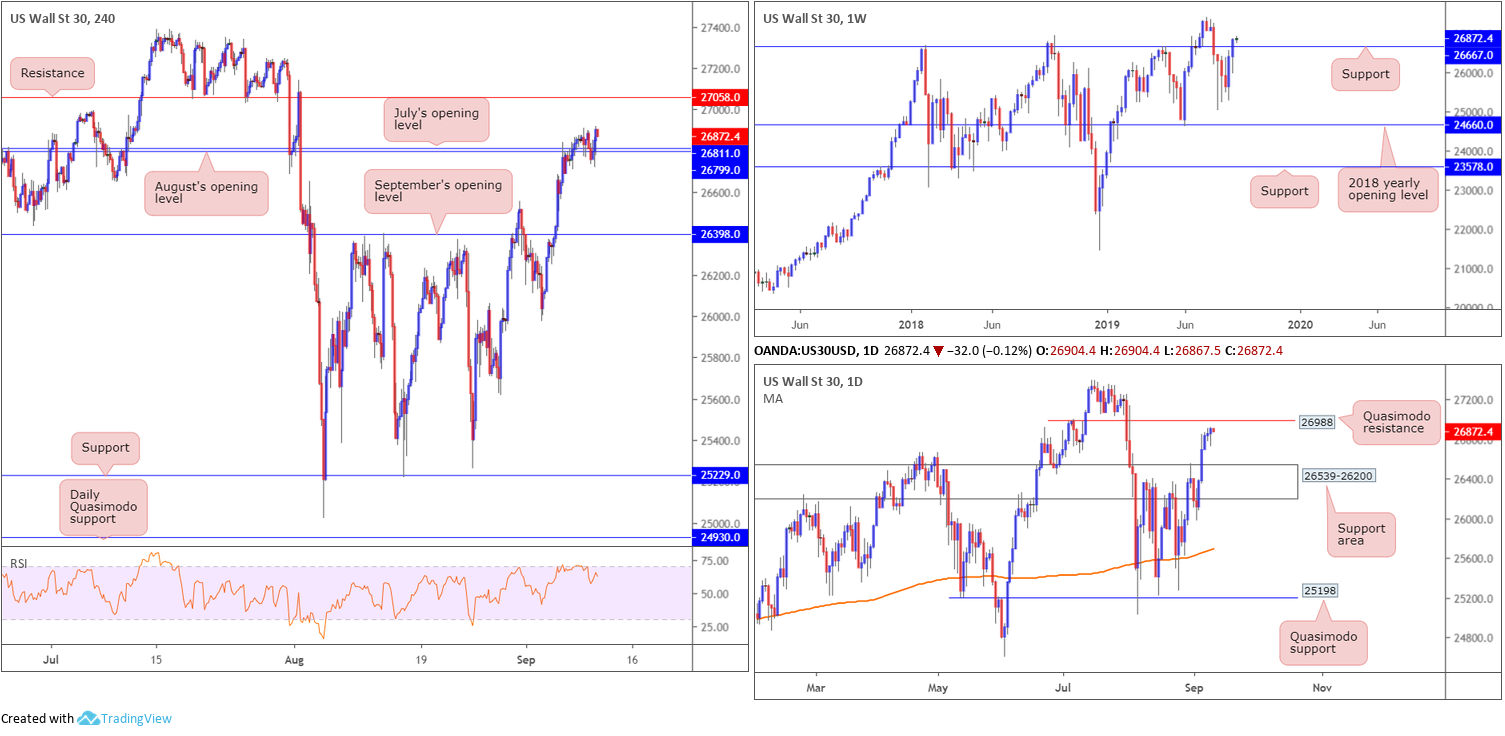
With respect to the technical scene on the Dow, weekly price continues to hover north of support at 26667, eyeing all-time highs at 27388. A retest at 26667 may also occur prior to exploring higher ground. In terms of the daily timeframe, nonetheless, we have Quasimodo resistance next on tap at 26988 and a support area below at 26539-26200.
H4 action, on the other hand, remains buoyed by August/July’s opening levels 26799/26811, targeting resistance at 27058.
Areas of consideration:
For those who read Tuesday’s analysis you may recall the following:
In view of the latest technical movement, H4 price retested August/July’s opening levels 26799/26811 in the form of a hammer pattern. This could entice buyers into the market today, targeting clear-cut resistance at 27058.
Those who entered long on the back of the hammer candlestick pattern, dependant on stop-loss placement, likely suffered a loss. Unfortunately, price has risen too high to consider another attempt at longs, given daily Quasimodo resistance at 26988 resides close by. Ultimately, the research team is looking for price to take out H4 resistance at 27058 as this should clear upside to all-time highs at 27388.
Therefore, with everything taken on board, opting to stand on the sidelines may well be the best path to take today, unless of course we push through 27058 and ignite possible long opportunities.
XAU/USD (GOLD):
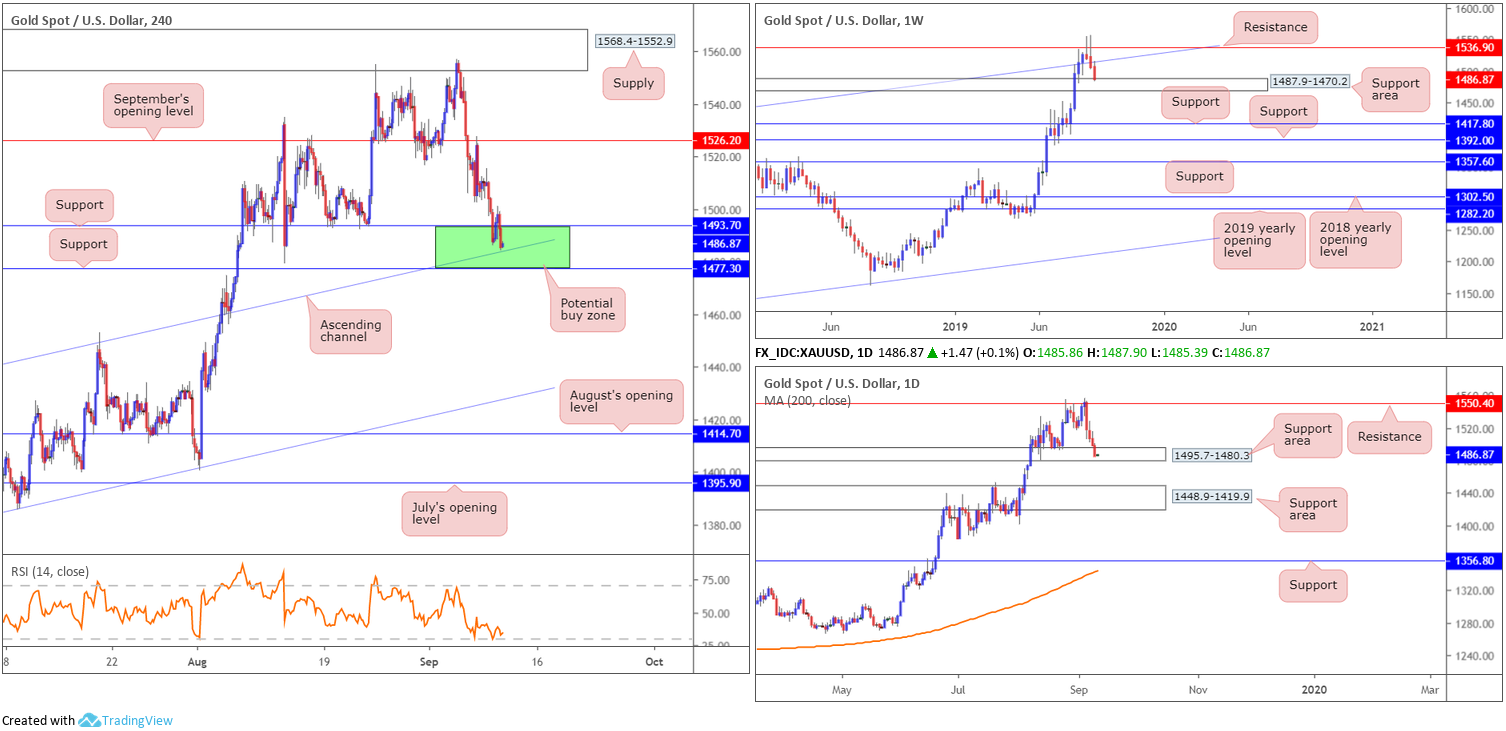
With USD bidding observed in Tuesday’s session, gold extended its losing streak to four consecutive days. This consequently brought a rather interesting area of support into the mix between 1477.3/1493.7 (green): two layers of H4 support and a channel resistance-turned support extended from the high 1437.7.
What’s also interesting is the higher-timeframe structure. As underscored in Tuesday’s report, bullion rotated lower from notable weekly resistance priced in at 1536.9 (boasts strong historical significance – check late 2011 and early 2012) last week by way of a bearish outside week (considered a bearish signal). As we also registered a close back beneath nearby channel resistance-turned support (taken from the high 1375.1), further downside towards a support area at 1487.9-1470.2 was seen. As for the daily timeframe, thanks to recent selling, we are now within the walls of a support area coming in at 1495.7-1480.3. A violation of this area has another support area in the firing range at 1448.9-1419.9.
Areas of consideration:
Outlook unchanged:
The green area on the H4 timeframe between 1477.3/1493.7 is considered a notable buy zone. Not only does it hold H4 channel support within, it merges with a daily support area coming in at 1495.7-1480.3, and the top edge of the weekly support area at 1487.9.
Entry can be found anywhere within the green buy zone, with protective stop-loss orders positioned beneath 1477.3. For conservative traders desiring a little more confirmation, though, waiting for a H4 bullish candlestick formation to develop could be the way to go. Not only does this help confirm buyer intent, it also provides entry and risk levels to trade with.
The accuracy, completeness and timeliness of the information contained on this site cannot be guaranteed. IC Markets does not warranty, guarantee or make any representations, or assume any liability regarding financial results based on the use of the information in the site.
News, views, opinions, recommendations and other information obtained from sources outside of www.icmarkets.com.au, used in this site are believed to be reliable, but we cannot guarantee their accuracy or completeness. All such information is subject to change at any time without notice. IC Markets assumes no responsibility for the content of any linked site.
The fact that such links may exist does not indicate approval or endorsement of any material contained on any linked site. IC Markets is not liable for any harm caused by the transmission, through accessing the services or information on this site, of a computer virus, or other computer code or programming device that might be used to access, delete, damage, disable, disrupt or otherwise impede in any manner, the operation of the site or of any user’s software, hardware, data or property.


