
Key risk events today:
Canada BoC Rate Statement and Overnight Rate Decision.
(Previous analysis as well as outside sources – italics).
EUR/USD:
Europe’s single currency rolled out a subdued tone against the US dollar Tuesday, as the US dollar index continues to languish south of the 91.00 handle.
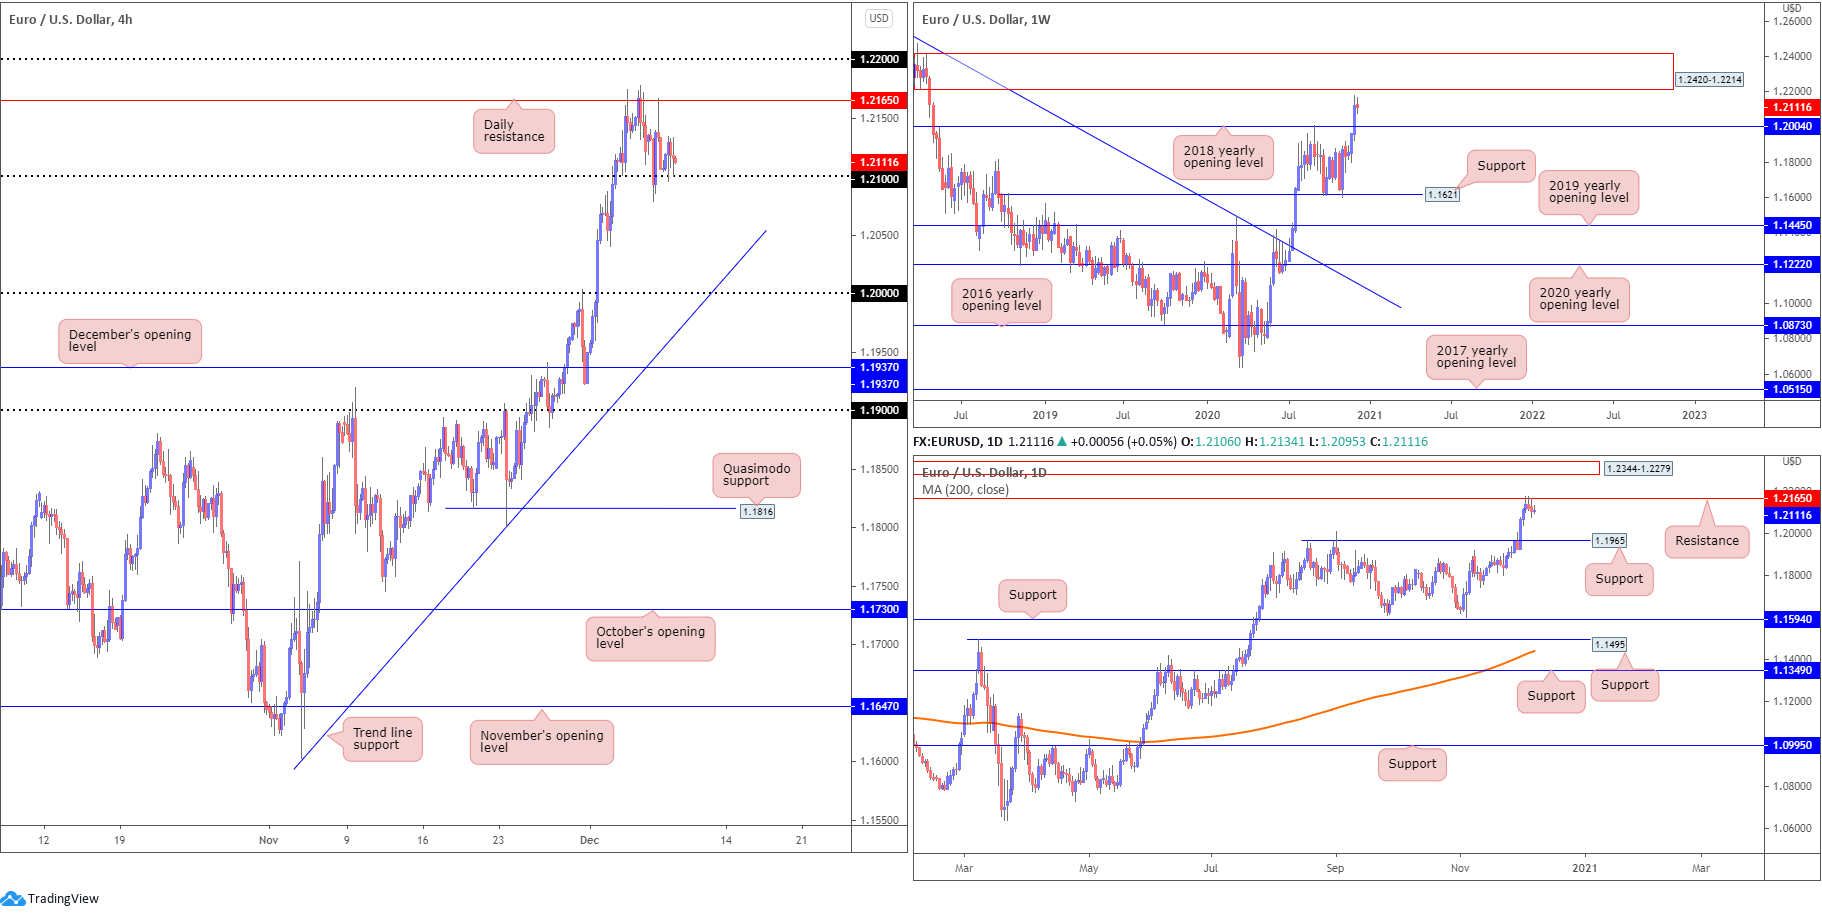
Bid/offers appear even off the 1.21 handle on the H4 scale, with EUR/USD suggesting either a push north to shake hands with daily resistance at 1.2165 once more, or navigating south of 1.21 to perhaps seek 1.20 bids and trend line support, extended from the low 1.1602.
From the weekly timeframe, technical action is unchanged. Therefore, here is a reminder of where we left the weekly timeframe in Monday’s weekly report:
From the weekly scale, we can see the unit rallied more than 150 pips and tested fresh YTD peaks last week. Underpinned on the back of USD softness, the technical picture on the weekly chart reveals the pair overwhelmed the 2018 yearly opening value at 1.2004, drawing out supply at 1.2420-1.2214. In terms of trend, it seems upside remains favoured, more so if price overthrows the 1.2555 February 12 high (2018). The above implies buyers may remain at the wheel until testing the aforementioned supply zone.
Also relatively unchanged from the daily timeframe:
Before reaching weekly supply, buyers must contend with daily resistance at 1.2165.
1.2165 made an appearance into the second half of last week and produced back-to-back shooting star candles (bearish signals). Despite this, Monday/Tuesday offered little in terms of downside. A solid rejection from here, however, shines the spotlight on support at 1.1965, a previous Quasimodo resistance. A 1.2165 breach, on the other hand, swings the pendulum in favour of a run to supply drawn from 1.2344-1.2279 (sited within the parapets of current weekly supply).
Areas of consideration:
- The uptrend remains in a healthy state, seen clearly from both the weekly and daily timeframes.
- Daily resistance (1.2165) is a level to be mindful of, though given H4 buyers are defending 1.21, buyers could take control today and perhaps make a run for 1.22.
- 22 is a significant barrier, one which could entice sellers. A mild fakeout above the level, a whipsaw that not only taps into any buy-stop liquidity above 1.22 but also tests the underside of weekly supply at 1.2214, unlocks the possibility of fresh sellers making an appearance.
GBP/USD:
Cable observed a choppy session Tuesday as price action exhibited an uneasy tone amid critical Brexit negotiations.
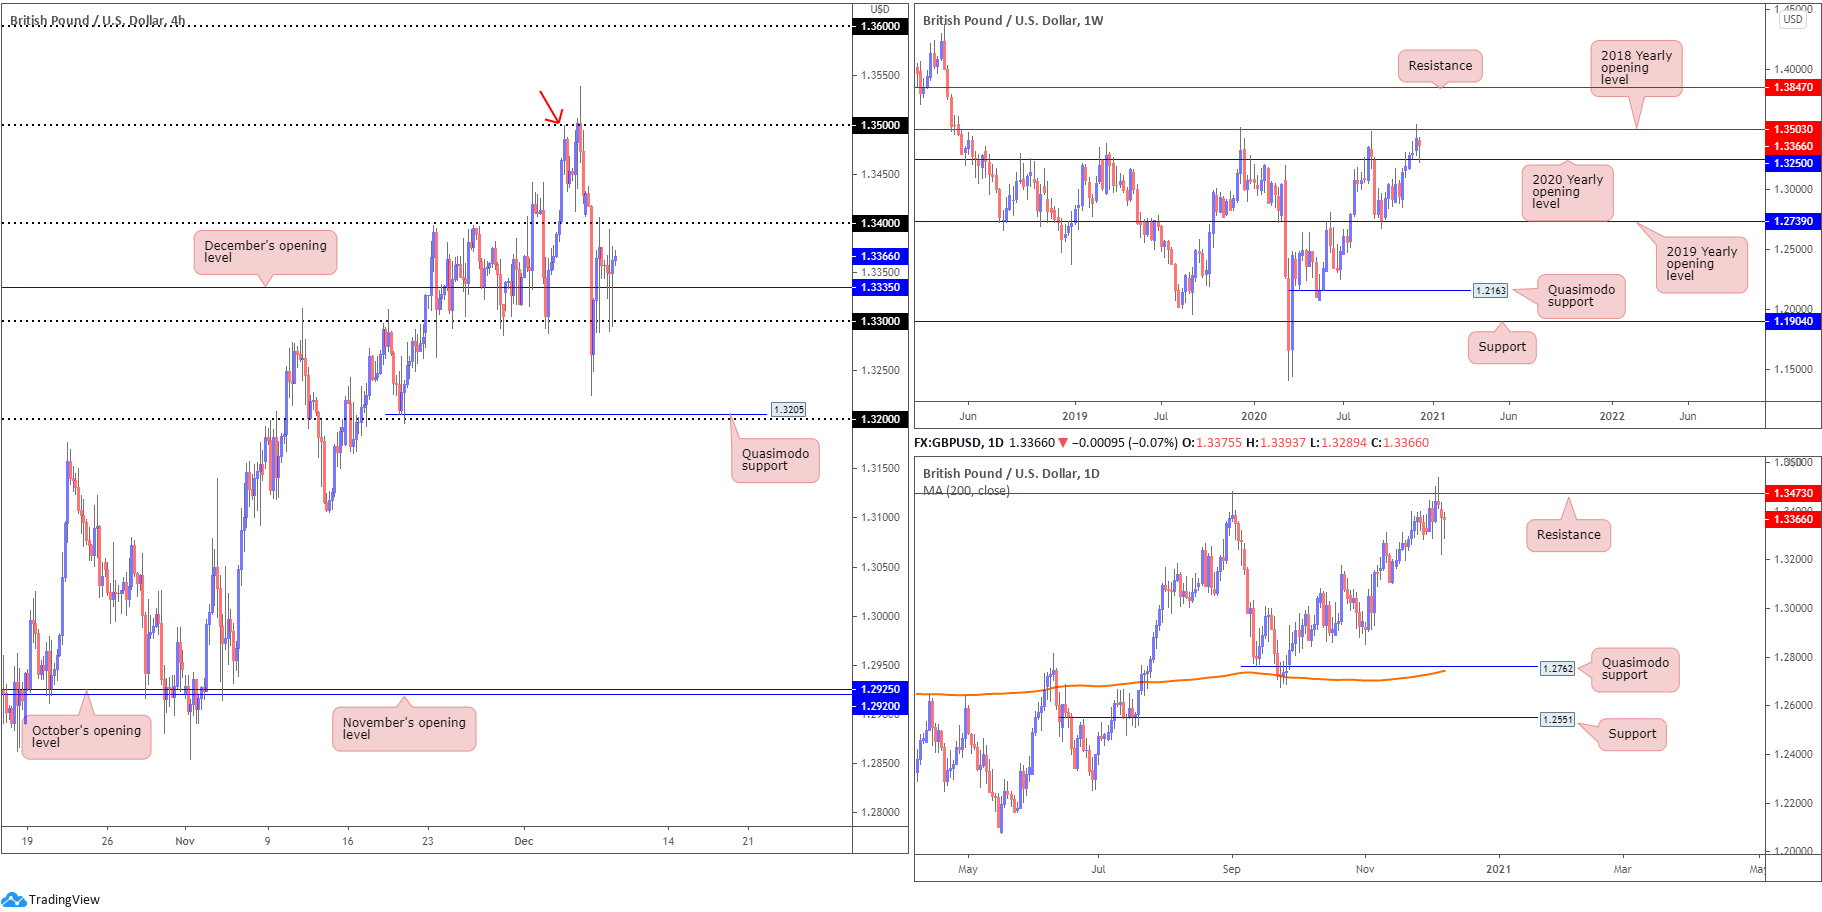
Price action on the H4 continues to work with 1.34, December’s opening value at 1.3335 and the 1.33 handle. North of 1.34, 1.35 (merging with a Quasimodo resistance level [red arrow]) is on show, while sub 1.33 sellers could look to take aim at the 1.32 handle and H4 Quasimodo support from 1.3205.
From the weekly timeframe, five weeks of buying set aside the 2020 yearly opening value at 1.3250 and shook hands with the 2018 yearly opening value at 1.3503. Note recent trade retested 1.3250 as support. A break of 1.3503 could send price as far north as resistance plotted at 1.3847. Similar to EUR/USD, GBP/USD also managed to eke out fresh YTD highs last week, with the immediate trend pulling to the upside since March troughs at 1.1409.
The daily chart, as you can see, provides a magnified view of the current uptrend. The chart also parades resistance at 1.3473, joining the fight last Thursday with price establishing a shooting star candle pattern Friday (bearish signal). Despite best efforts, sellers have so far been unable to find room to explore lower terrain, with Monday and Tuesday concluding off worst levels.
Areas of consideration:
- 34 is a resistance to be aware of, following the formation of the lower low at 1.3224.
- The 1.35 region remains interesting resistance, merging closely with H4 Quasimodo resistance, weekly resistance at 1.3503 and daily resistance found at 1.3473.
- The trend remains to the upside, therefore a close forming north of 1.35 could also activate breakout bullish scenarios, targeting at least 1.36.
AUD/USD:
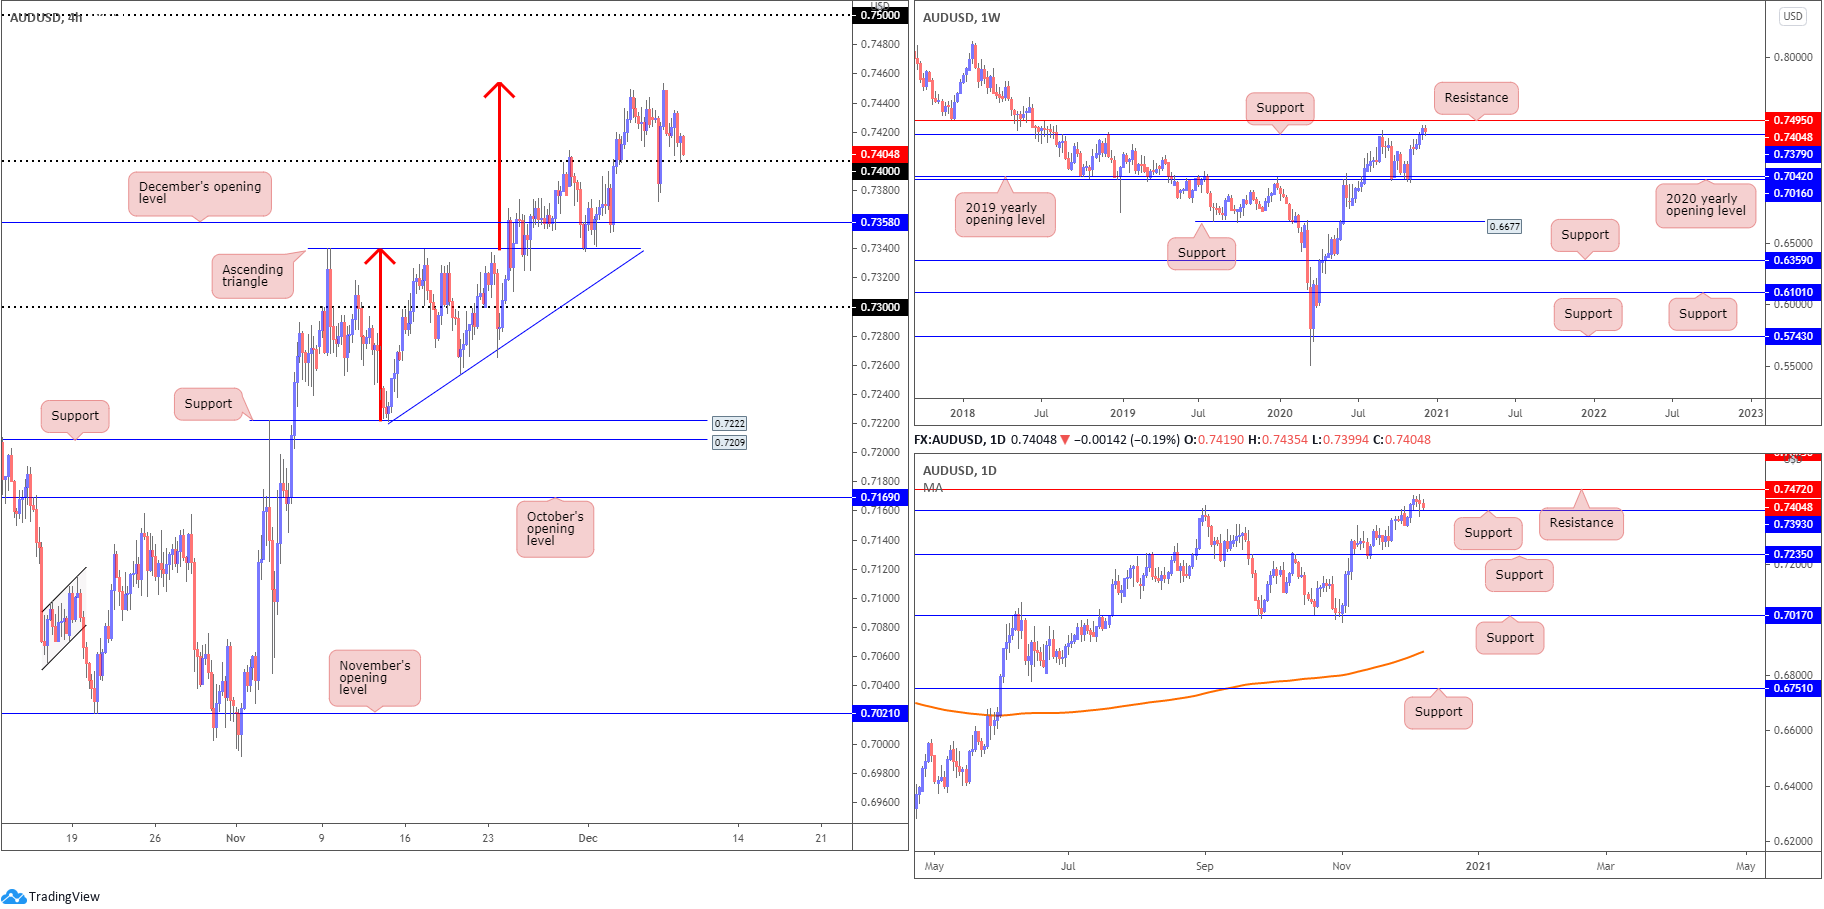
The Australian dollar modestly retreated vs. the US dollar Tuesday, a day after registering fresh YTD pinnacles and testing the H4 ascending triangle take-profit target (red arrows) at 0.7453.
Consequent to yesterday’s movement, 0.74 is back in the fight on the H4, with buyers currently embracing the level as support in the shape of a hammer candle pattern (bullish signal). Below, December’s opening value at 0.7358 is seen, followed by the 0.73 base. To the upside, 0.75 is seen as a logical target beyond YTD highs.
Further afield on the weekly timeframe, after retesting resistance-turned support at 0.7379, buyers could, in view of this market trending higher since early 2020, stretch as far north as resistance coming in at 0.7495.
In similar fashion to the weekly timeframe, price action on the daily timeframe bumped through resistance at 0.7393 last week and retested the latter as support early trade this week. This likely has traders’ crosshairs focused on resistance at 0.7472, sited just beneath weekly resistance at 0.7495.
Areas of consideration:
- In light of the H4 bullish hammer pattern off 0.74, buyers could attempt to stage a recovery. However, traders are urged to pencil in the possibility of a fakeout through 0.74 to test the area between weekly support at 0.7379 and daily support from 0.7393 before buyers make an appearance.
USD/JPY:
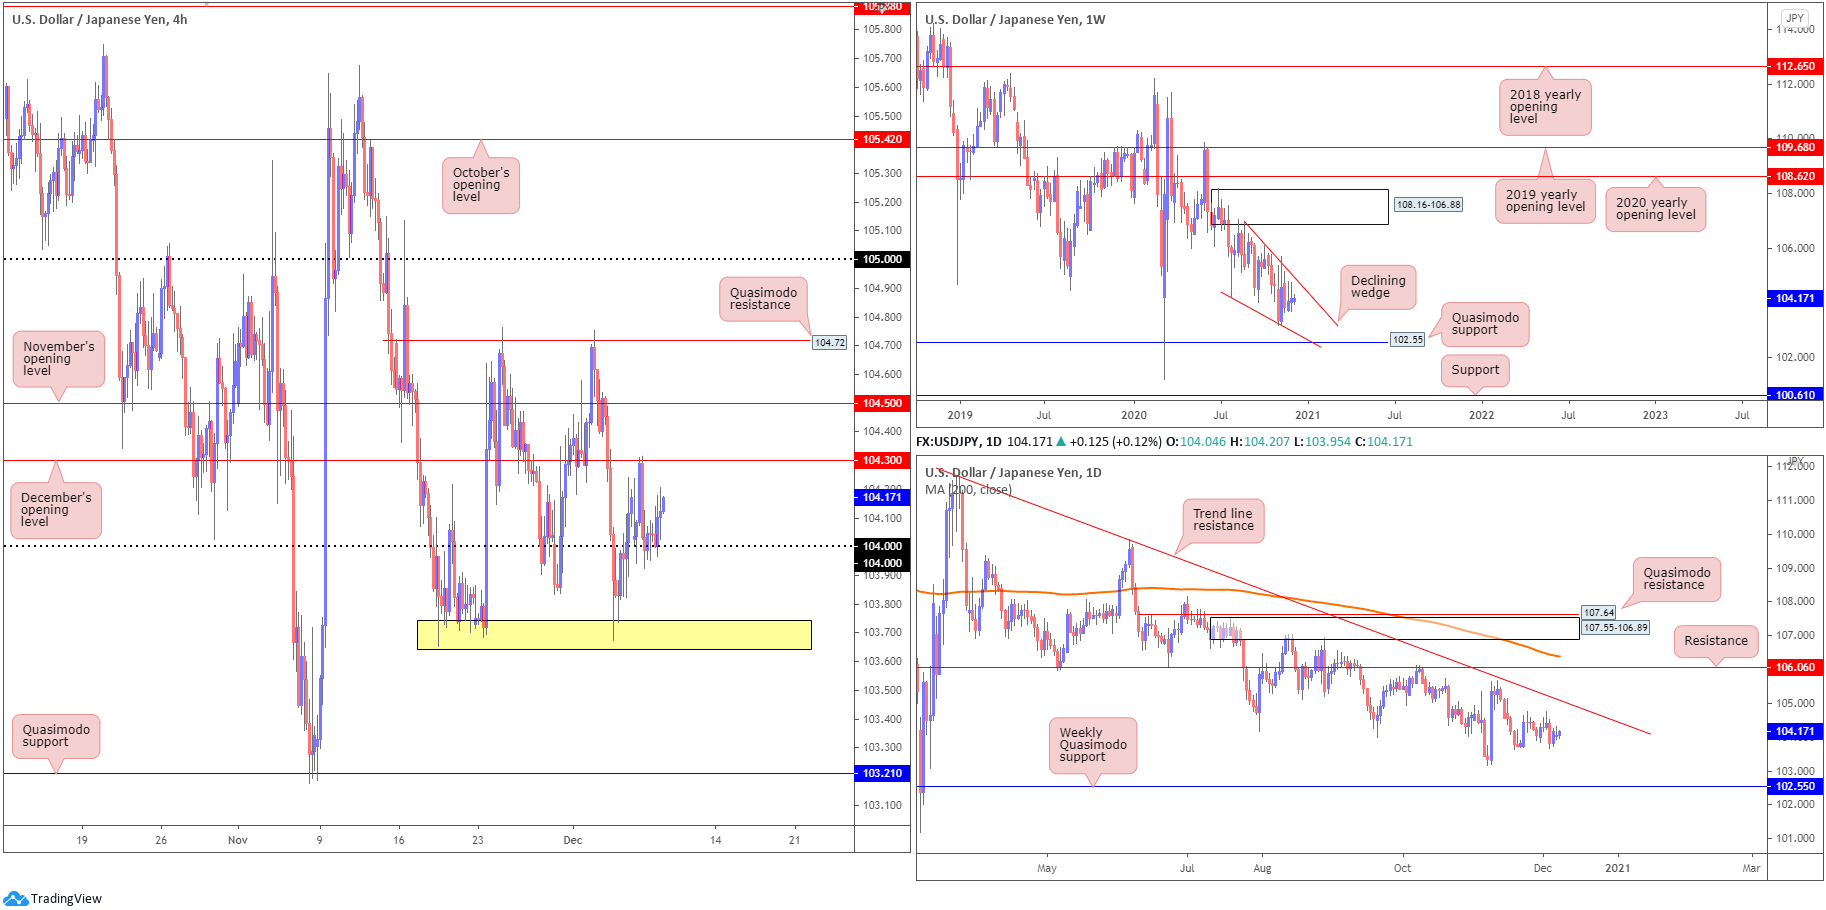
USD/JPY managed to eke out marginal gains on Tuesday, balancing off support derived from the 104 handle. December’s opening value at 104.30 on the H4 remains calling to the upside, as does resistances around November’s opening value priced in at 104.50 and the Quasimodo resistance at 104.72. The plot of support around 103.70 (yellow) also remains important, particularly if buyers lose grip and we retake 104.
Since connecting with the underside of weekly supply at 108.16-106.88 in August, price has gradually shifted lower and developed a weekly declining wedge (106.94/104.18). Weekly Quasimodo support at 102.55 is also in the picture, with a break revealing support plotted at 100.61. A strong bounce from 102.55, however, may provide enough impetus for buyers to attempt a breakout above the current declining wedge.
The technical landscape from the daily timeframe reveals scope to close in on trend line resistance, extended from the high 111.71. Sellers taking over, nevertheless, could lead price to the 103.17 November 6 low, followed by the noted weekly Quasimodo support at 102.55.
Areas of consideration:
- 104 may remain supportive, as could support around 103.70 on the H4 scale. Upside targets north of 104 stand at 104.30/104.50/104.72.
- Removing H4 support around 103.70 moves H4 Quasimodo support at 103.21 on to the radar as a possible downside objective for intraday bearish scenarios.
USD/CAD:
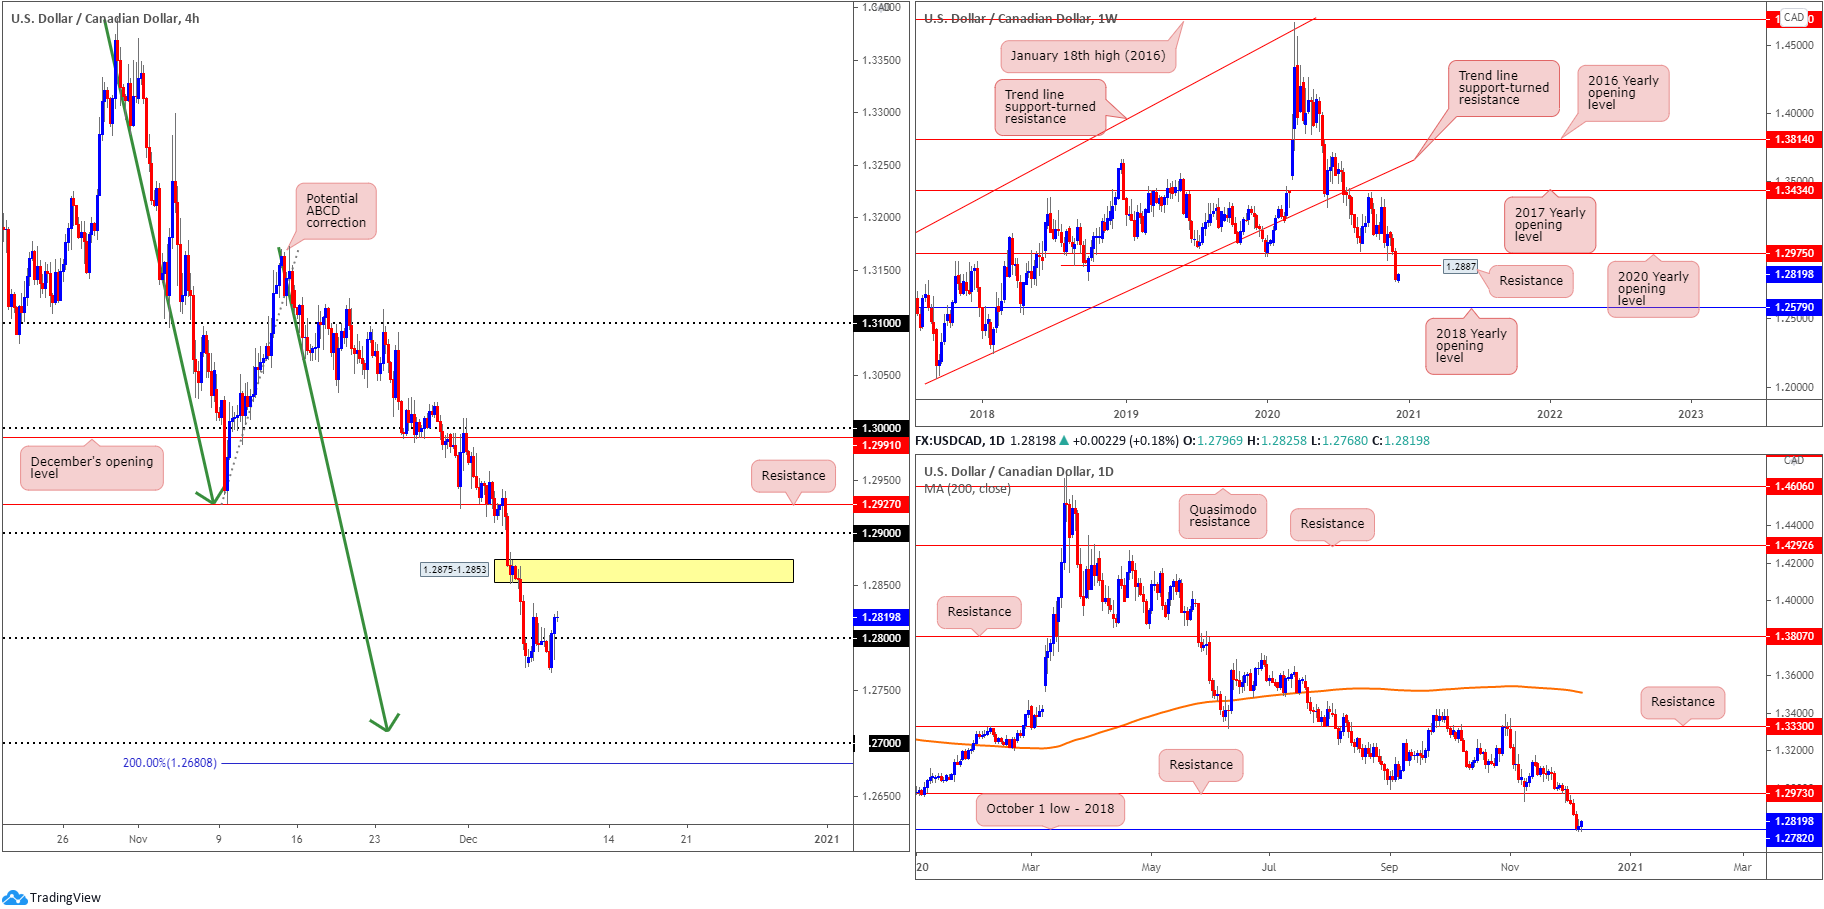
Rebounding from multi-year troughs, USD/CAD reclaimed 1.28+ status on the H4 scale Tuesday and, assuming bulls overpower any offers residing around Monday’s high 1.2833, supply at 1.2875-1.2853 could make an appearance.
Should buyers run out of gas this week and decide to navigate deeper water south of the 1.28 region, 1.27 is in view, a psychological level accompanied by an ABCD correction (green arrows) at 1.2711 and a 2.0 BC projection.
In support of further selling is the weekly timeframe after last week’s 200-pip depreciation obliterated the 2020 yearly opening value at 1.2975 and Quasimodo support coming in at 1.2887. With both levels depicting resistance, sustained downside places the 2018 yearly opening value at 1.2579 in the firing line. It is also worth taking into account that sellers have governed this market since March 2020, following tops at 1.4667.
Over the course of four mostly dominant bearish candles, last week also absorbed daily support at 1.2973 (now possible resistance) and crossed swords with October’s low (2018) at 1.2782, which, as you can see, is offering support.
Areas of consideration:
- Weekly price showing a reasonably free rein to the 2018 yearly opening value at 1.2579 signals H4 buyers could be in trouble. However, assisted by daily support at 1.2782 (October’s low [2018]), buyers may still push for H4 supply at 1.2875-1.2853.
- Conservative buyers, however, may seek a retest at 1.28 before committing.
- Printing a decisive H4 close beneath 1.28 may trigger bearish scenarios, with many H4 players targeting the 1.27 neighbourhood.
USD/CHF:
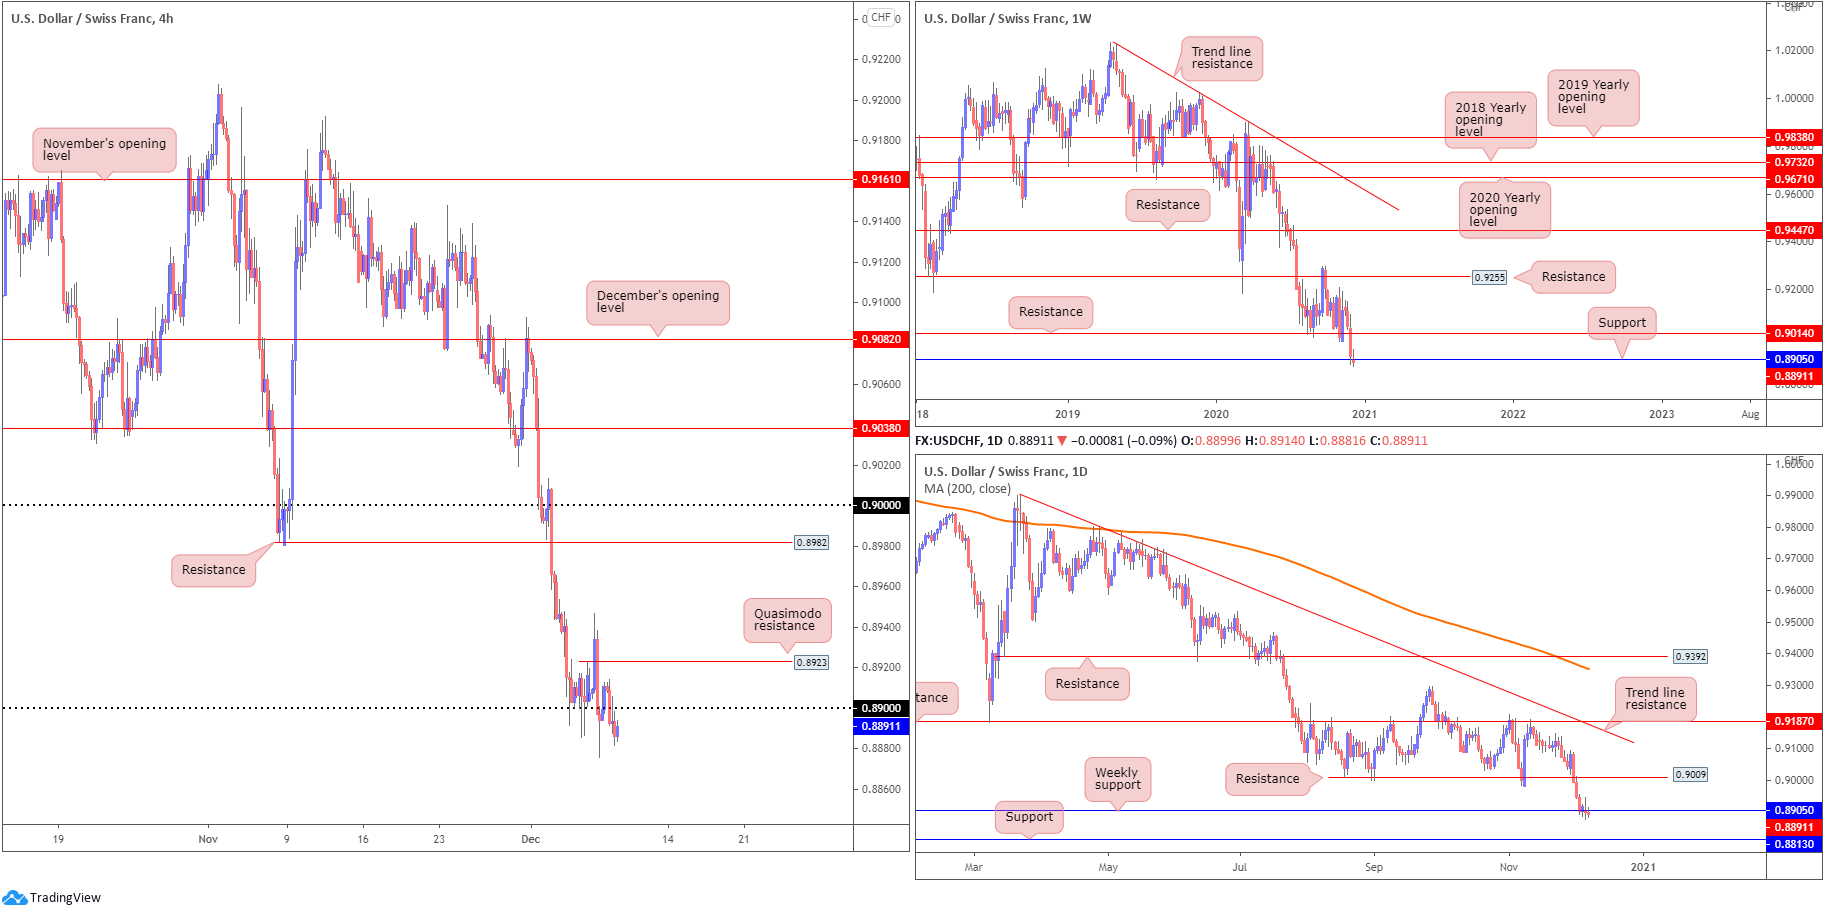
Last week’s 120-pip decline, detailing a third consecutive weekly loss, brought weekly flow into support coming in at 0.8905. While buyers could still attempt a recovery off 0.8905, traders are urged to pencil in the possibility of refreshing multi-year lows and shining the limelight on support at 0.8696. Interestingly, the trend in this market has been lower since early 2019.
A similar picture is evident on the daily timeframe. The difference, however, is below weekly support at 0.8905 on the daily scale, support is seen at 0.8813, and a 0.8905 rejection could reignite interest in daily resistance at 0.9009.
Across the page on the H4 timeframe, the 0.89 handle failed to spark interest to the upside and left Quasimodo resistance at 0.8923 unchallenged. Below 0.89, daily support is seen as the next downside target at 0.8813, fixed just north of the 0.88 handle.
Areas of consideration:
- 89 giving way underscores a potential bearish scene to daily support at 0.8813. Conservative sellers may pursue a retest of 0.89 before pulling the trigger.
Dow Jones Industrial Average:
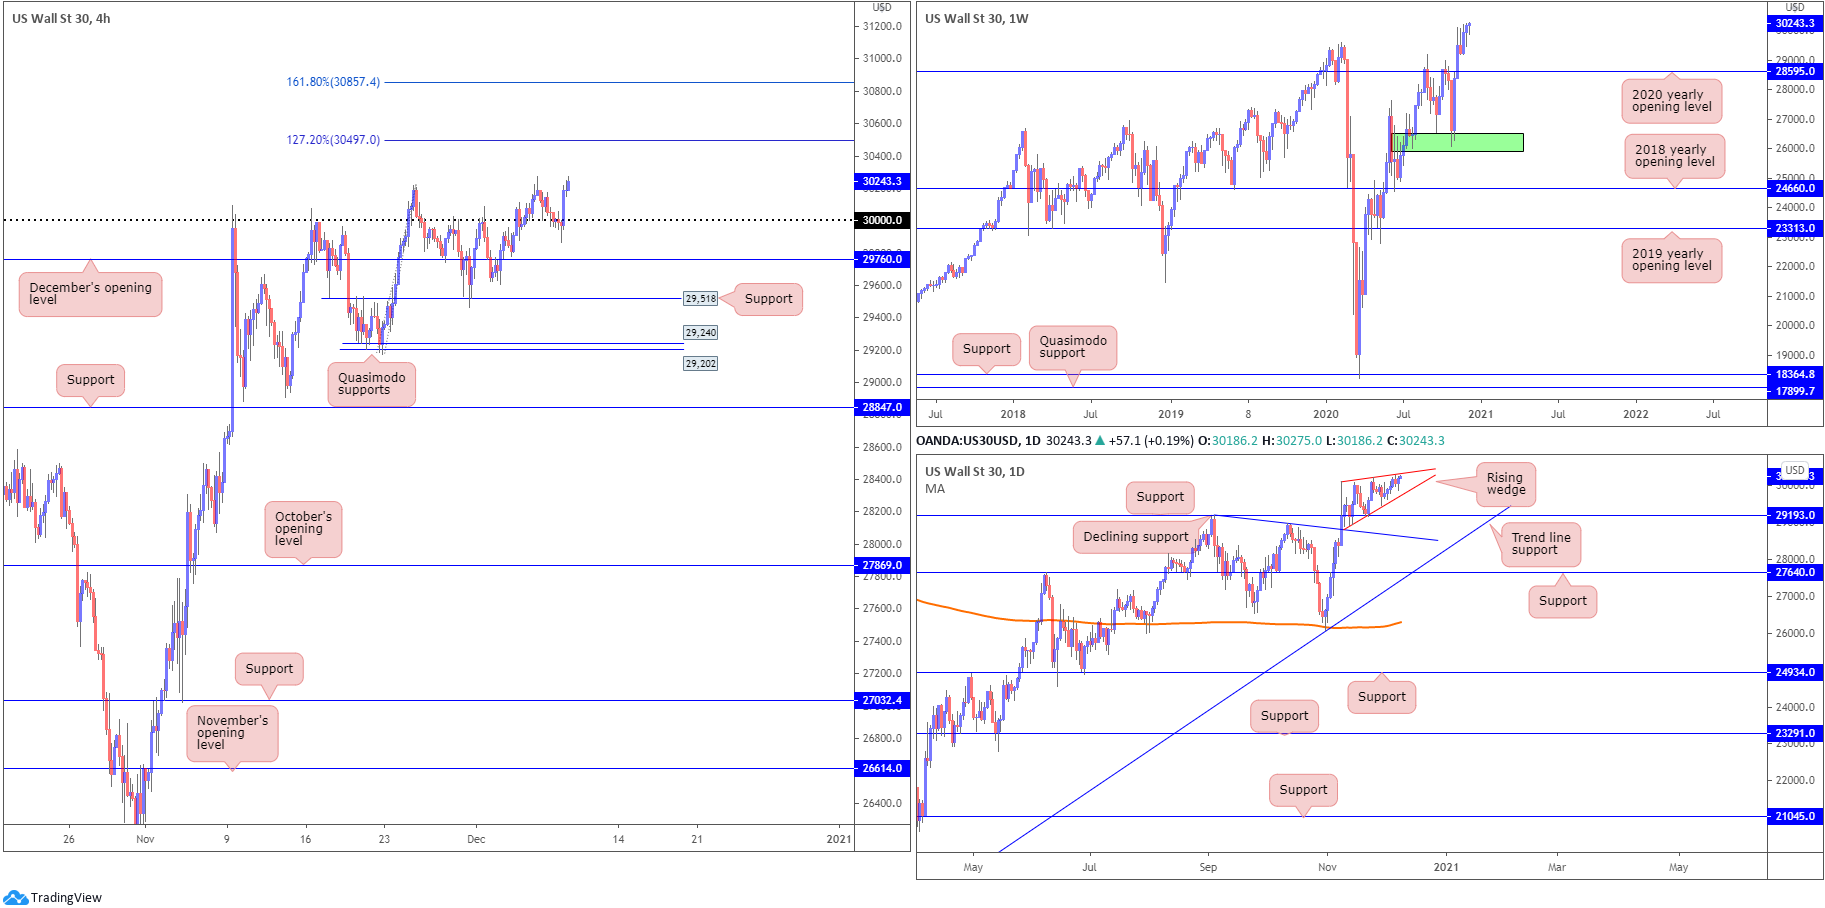
US equity benchmarks advanced across the board Tuesday, pushing the S&P 500 and Nasdaq to fresh records. The Dow Jones Industrial Average added 104.09 points, or 0.35%; the S&P 500 traded higher by 10.29 points, or 0.28% and the Nasdaq rallied by 62.83 points, or 0.50%.
Following a retest of the widely watched 30,000 figure on the H4 scale, buyers appear in good health at the moment, recently registering a fresh all-time peak at 30,275. Subsequent buying may reach for the 127.2% Fibonacci projection point at 30,497, followed by the 161.8% Fibonacci projection point at 30,857.
From the weekly timeframe, we can see that in the event a correction materialises, the 2020 yearly opening value from 28595 could be an area dip-buyers find interest in. According to the daily timeframe, support is seen at 29,193. Pattern traders may also acknowledge the rising wedge forming between 30,097 and 28,908.
Areas of consideration:
- 30,000 represents key support on the H4 scale, with upside targets resting at 30,497 and 30,857.
- The rising wedge seen on the daily timeframe, should its lower edge be engulfed, sellers could force a retest of daily support at 29,193.
XAU/USD (GOLD):
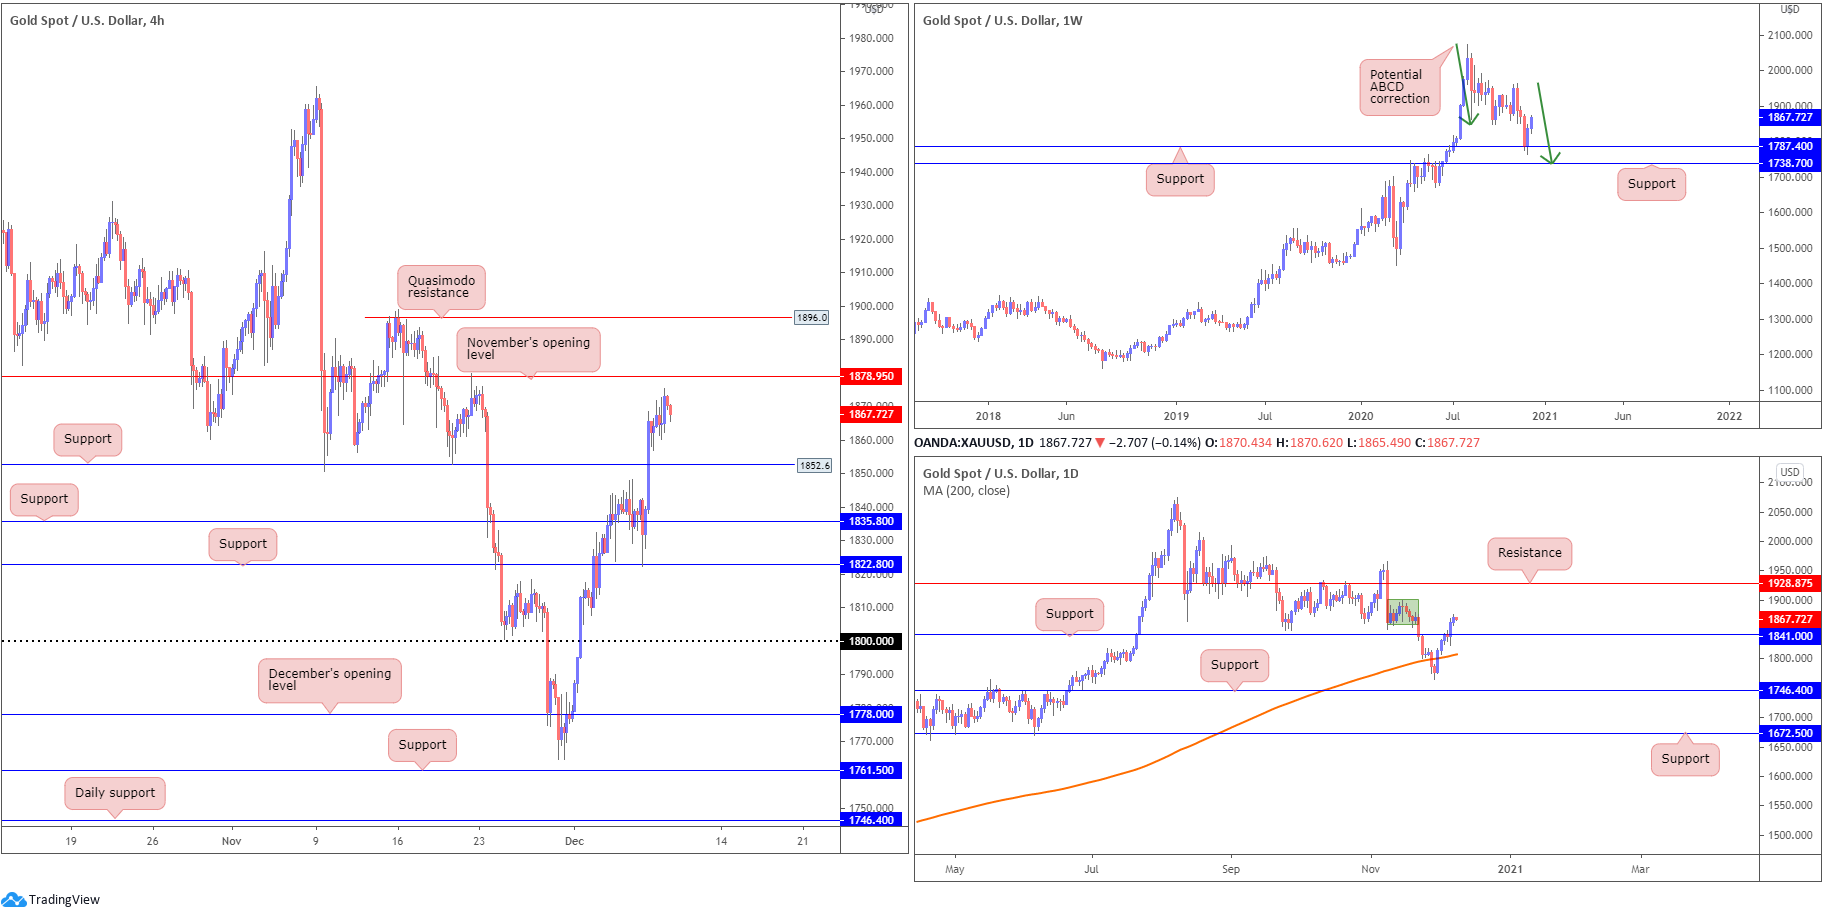
Kicking things off from the weekly timeframe this morning, price action is seen demonstrating a robust stance off support at $1,787 (sited ahead of another support at $1,738 and a potential ABCD correction [green arrows]). The fact the yellow metal has been decisively trending higher since the beginning of 2016 adds to the bullish narrative off $1,787.
Meanwhile, on the daily chart, buyers conquered the 200-day SMA (orange – $1,807) as well as resistance from $1,841 (now possible support). Defeating $1,841 draws interest to supply around 1,878ish (green zone) and resistance plotted above it at $1,928.
Over on the H4 timeframe, Monday brushed aside resistance at $1,852 (now potential support) and shined the spotlight on resistance in the form of November’s opening value from $1,878 and Quasimodo resistance at $1,896.
Areas of consideration:
- Uptrend remains strong (check weekly trend).
- Buyers appear free to take things higher, according to the trend and weekly support at $1,787.
- Retesting H4 support at $1,852 could entice buyers, in light of the weekly and daily timeframes. This could have buyers target November’s opening value from $1,878.
- Similar to above, engulfing $1,878 could appeal to breakout buyers, targeting H4 Quasimodo resistance at $1,896.
The accuracy, completeness and timeliness of the information contained on this site cannot be guaranteed. IC Markets does not warranty, guarantee or make any representations, or assume any liability regarding financial results based on the use of the information in the site.
News, views, opinions, recommendations and other information obtained from sources outside of www.icmarkets.com.au, used in this site are believed to be reliable, but we cannot guarantee their accuracy or completeness. All such information is subject to change at any time without notice. IC Markets assumes no responsibility for the content of any linked site.
The fact that such links may exist does not indicate approval or endorsement of any material contained on any linked site. IC Markets is not liable for any harm caused by the transmission, through accessing the services or information on this site, of a computer virus, or other computer code or programming device that might be used to access, delete, damage, disable, disrupt or otherwise impede in any manner, the operation of the site or of any user’s software, hardware, data or property


