
EUR/USD:
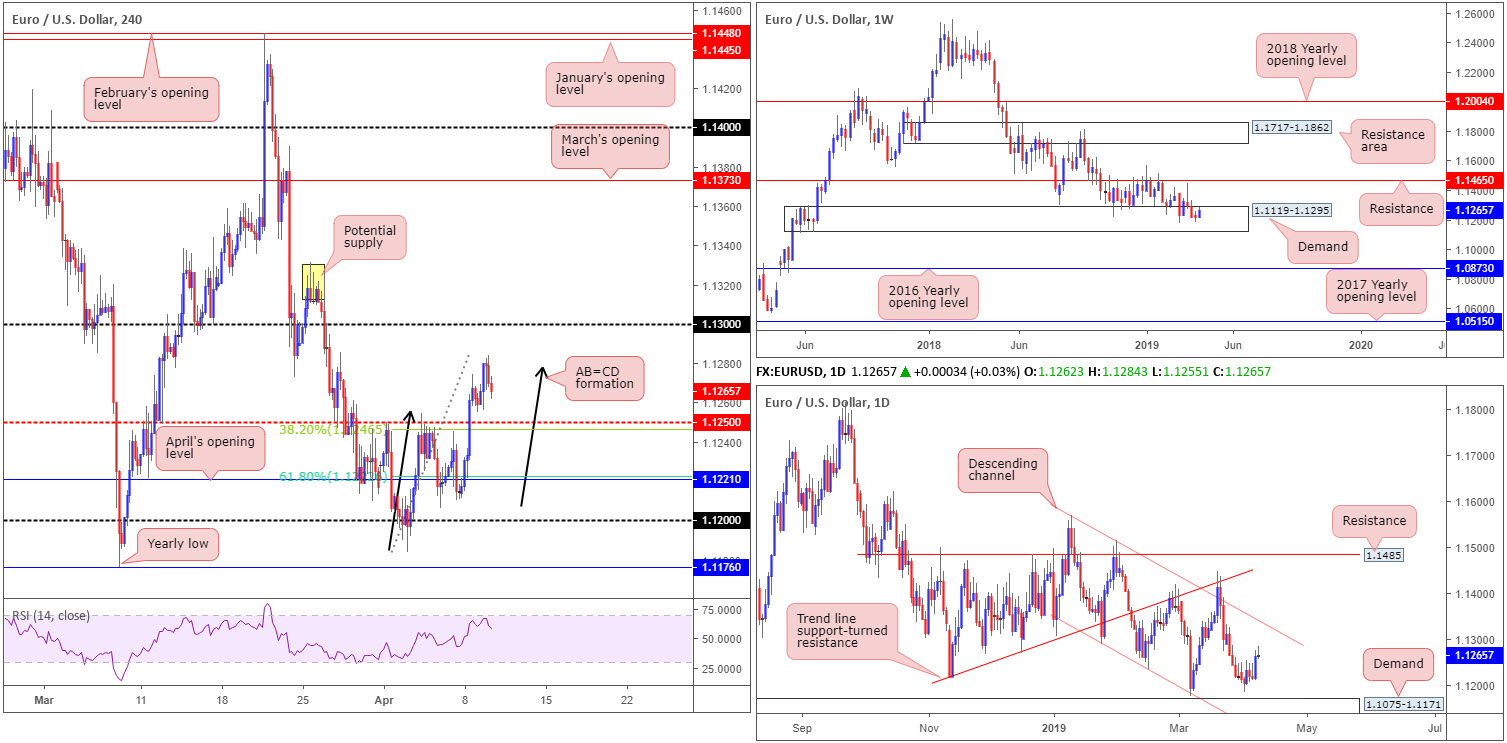
EUR/USD movement sits at unchanged levels as we wrap up the US session. Highs of 1.1284 were achieved, though the H4 candles ‘appear’ to be respecting an AB=CD (black arrows) bearish pattern around 1.1275. Continued selling from this point has the 1.1250 neighbourhood to target, which, as you can see, has proved a reasonably impressive resistance in recent trading, therefore, a response from this number as support is likely in store. To the upside, nevertheless, the psychological mark 1.13 is in sight, followed closely by supply at 1.1331/1.1310 (yellow).
On more of a broader perspective, weekly flow remains within the parapets of demand at 1.1119-1.1295, with the candles attempting to breakout of the zone. Overall, the long-term trend on the weekly timeframe continues to face a southerly direction, nonetheless, with traders’ crosshairs now likely fixed on 1.1176 as the next viable support: the 2019 yearly low.
Leaving demand at 1.1075-1.1171 (an area glued to the underside of the current weekly demand) unchallenged on the daily timeframe, Monday’s daily candle was certainly full of vigour. As zealous as the buyers were, though, upside somewhat diminished Tuesday and consequently formed a bearish pin-bar formation. The next port of call to the upside, however, has channel resistance (taken from the high 1.1569) in view.
Areas of consideration:
1.1250 on the H4 timeframe is a point of interest for a potential short-term long today, given it also fuses closely with a H4 38.2% (taken from the AB=CD legs A-D) Fibonacci support at 1.1240 (considered the first take-profit target from the AB=CD formation). In the event we fail to push higher from 1.1250, the second possible support in view is April’s opening level at 1.1221 and the 61.8% Fibonacci support at 1.1223 (considered the second take-profit target from the AB=CD pattern).
Today’s data points: ECB Main Refinancing Rate; ECB Monetary Policy Statement; ECB Press Conference; US CPI m/m; US Core CPI m/m; FOMC Member Quarles Speaks; FOMC Meeting Minutes.
GBP/USD:
Outlook unchanged.
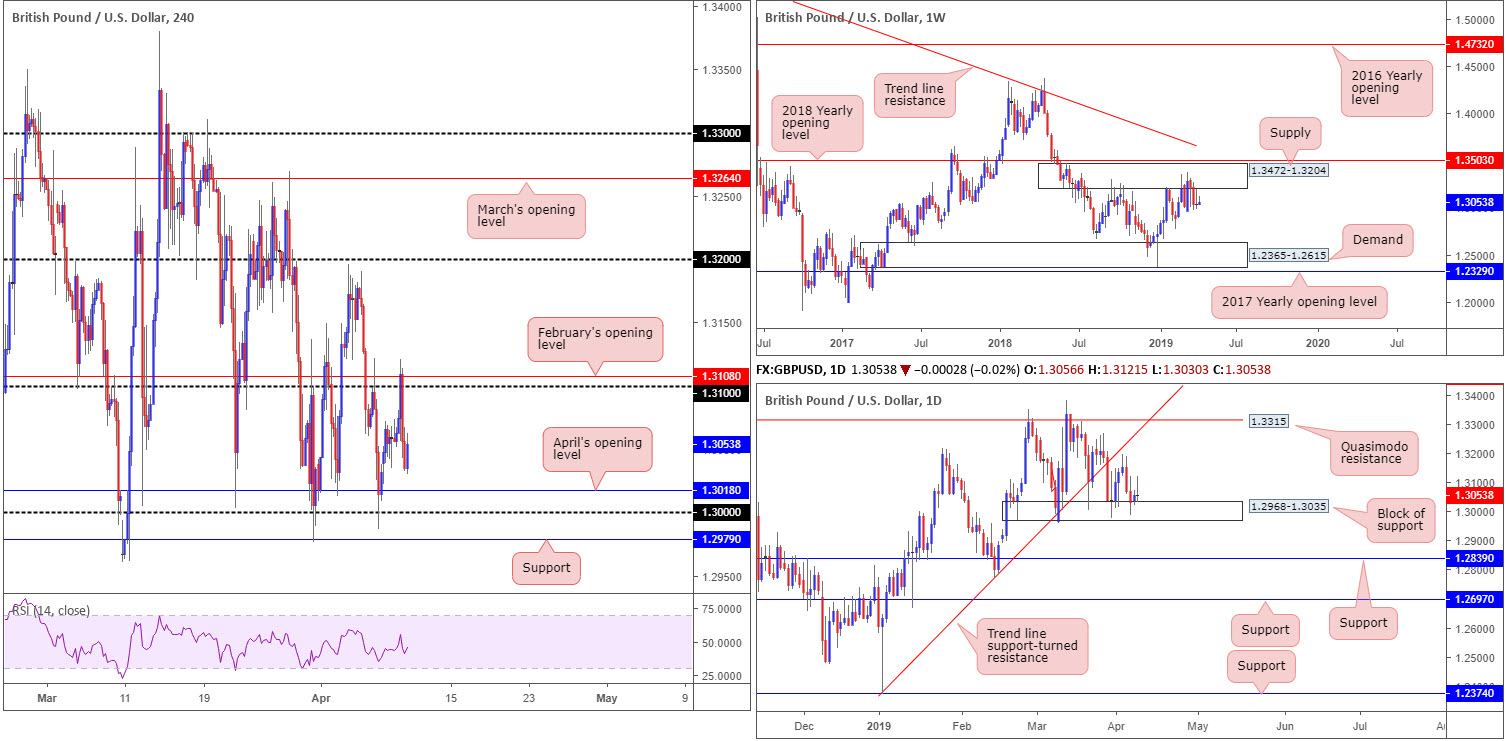
Following an advance to highs of 1.3121 – whipsawing through 1.31 and February’s opening level at 1.3108 on the H4 timeframe – on the back of the BBC reporting a British Eurosceptic lawmaker had been advised that Merkel was willing to put a five-year time limit on the backstop, the market swiftly turned lower after the report was later denied.
Despite ranging more than 90 points on the day, the GBP/USD settled at unchanged levels into the closing bell. In terms of nearby support on the H4 timeframe, the research team notes the key figure 1.30, support plotted at 1.2979 and also April’s opening level at 1.3018.
Higher-timeframe analysis, in light of recent movement, also remains unchanged. From the weekly timeframe, supply falls in around 1.3472-1.3204. Since the end of February this area has been home to many traders as price flips between gains/losses. According to structure, recent selling should not have come as a surprise, with the next obvious downside target not realised on this timeframe until demand coming in at 1.2365-1.2615. The flip side to this, daily action remains teasing a block of support at 1.2968-1.3035. Buying from here is likely to find resistance around trend line support-turned resistance (extended from the low 1.2373), closely followed by a Quasimodo resistance plotted at 1.3315.
Areas of consideration:
Traders interested in entering long from the 1.30 region this week, according to our technical studies, bring with them a clear block of daily support at 1.2968-1.3035 backing up the trade, along with nearby H4 supports highlighted above. Though this is likely to encourage buyers, the main concern remains on the weekly timeframe: supply at 1.3472-1.3204. This area is proving a troublesome beast to overcome and, therefore, could weigh on any longs.
In the event weekly selling pressures the market lower and the H4 candles overthrow 1.30 and nearby support at 1.2979, the next area of interest can be seen around demand (not visible on the screen) pencilled in at 1.2891-1.2926 (also holds the 1.29 handle within its walls).
Today’s data points: UK GDP m/m; UK Manufacturing Production m/m; US CPI m/m; US Core CPI m/m; FOMC Member Quarles Speaks; FOMC Meeting Minutes.
AUD/USD:
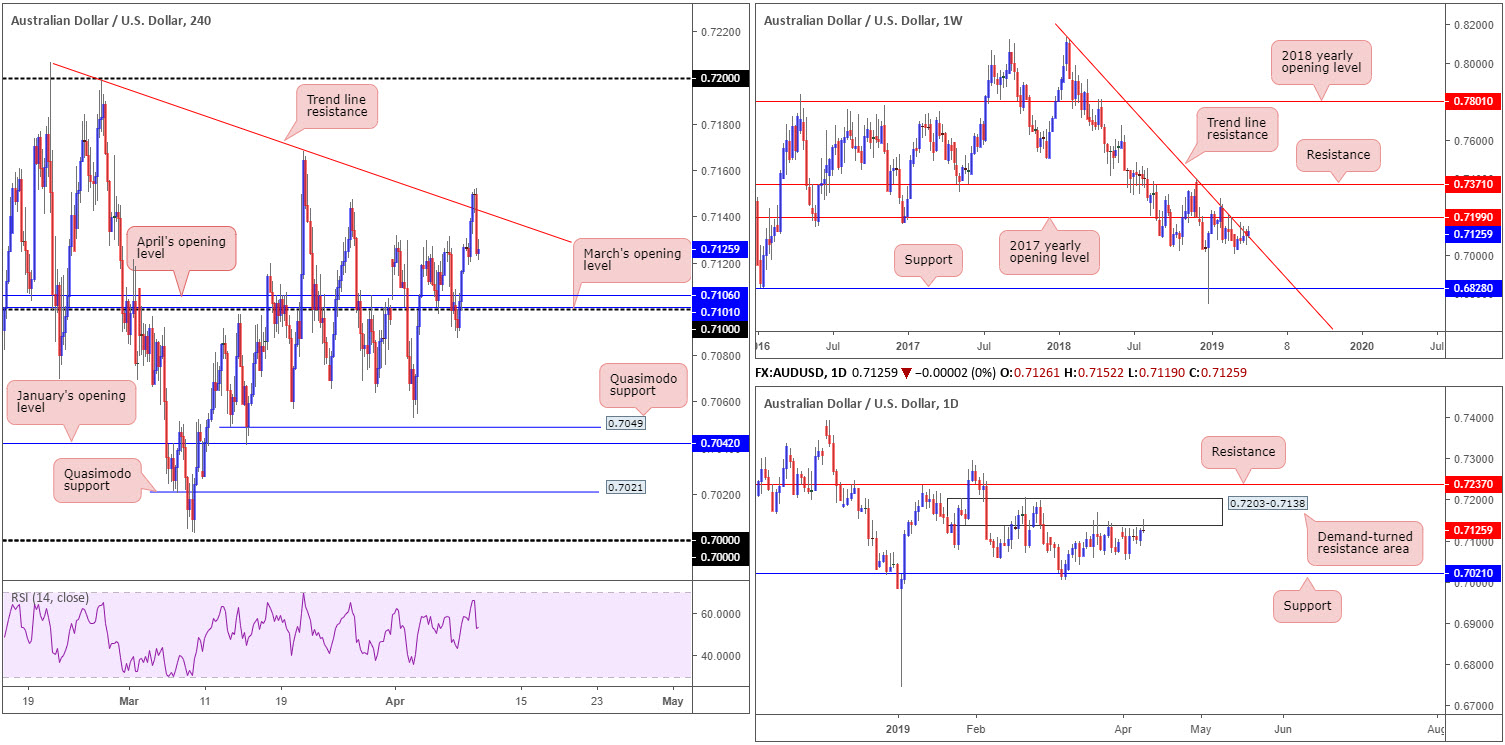
AUD/USD observed a round of strong buying amid Asia’s hours Tuesday, though ran into headwinds during US trade after marginally engulfing a trend line resistance (etched from the high 0.7206) on the H4 timeframe and retreated lower into the close.
The H4 trend line is likely a favoured barrier for short, owing to its higher-timeframe association. The weekly candles remain kissing the underside of a long-standing trend line resistance (etched from the high 0.8135). The market could eventually observe additional selling take shape from here as downside appears reasonably free until connecting with support coming in at 0.6828. Following a modest rebound off support at 0.7021 early March, daily action, since March 20, has been clinging to the underside of a demand-turned resistance area at 0.7203-0.7138.
In the event our technical reading is correct, further selling could be on the cards towards the 0.71 region (H4), which happens to also converge closely with March’s opening level at 0.7101 and April’s opening level at 0.7106. Should we drive beyond here, traders’ crosshairs will likely be fixed on H4 Quasimodo support at 0.7049.
Areas of consideration:
A retest of the said H4 trend line is certainly something to keep an eye out for today as this may provide an opportunity to sell (a H4 bearish candlestick pattern printed from here serves as a strong confirming signal that sellers potentially reside here – further to this it offers structure to base entry and risk levels from).
An alternative to the above is to wait and see if the H4 candles conquer 0.71 to the downside. A H4 close beneath here that’s followed up with a retest (preferably in the form of a H4 bearish candlestick pattern) is, according to our reading, likely enough evidence to suggest a sell, targeting 0.7049 as the initial take-profit zone.
Today’s data points: US CPI m/m; US Core CPI m/m; FOMC Member Quarles Speaks; FOMC Meeting Minutes.
USD/JPY:
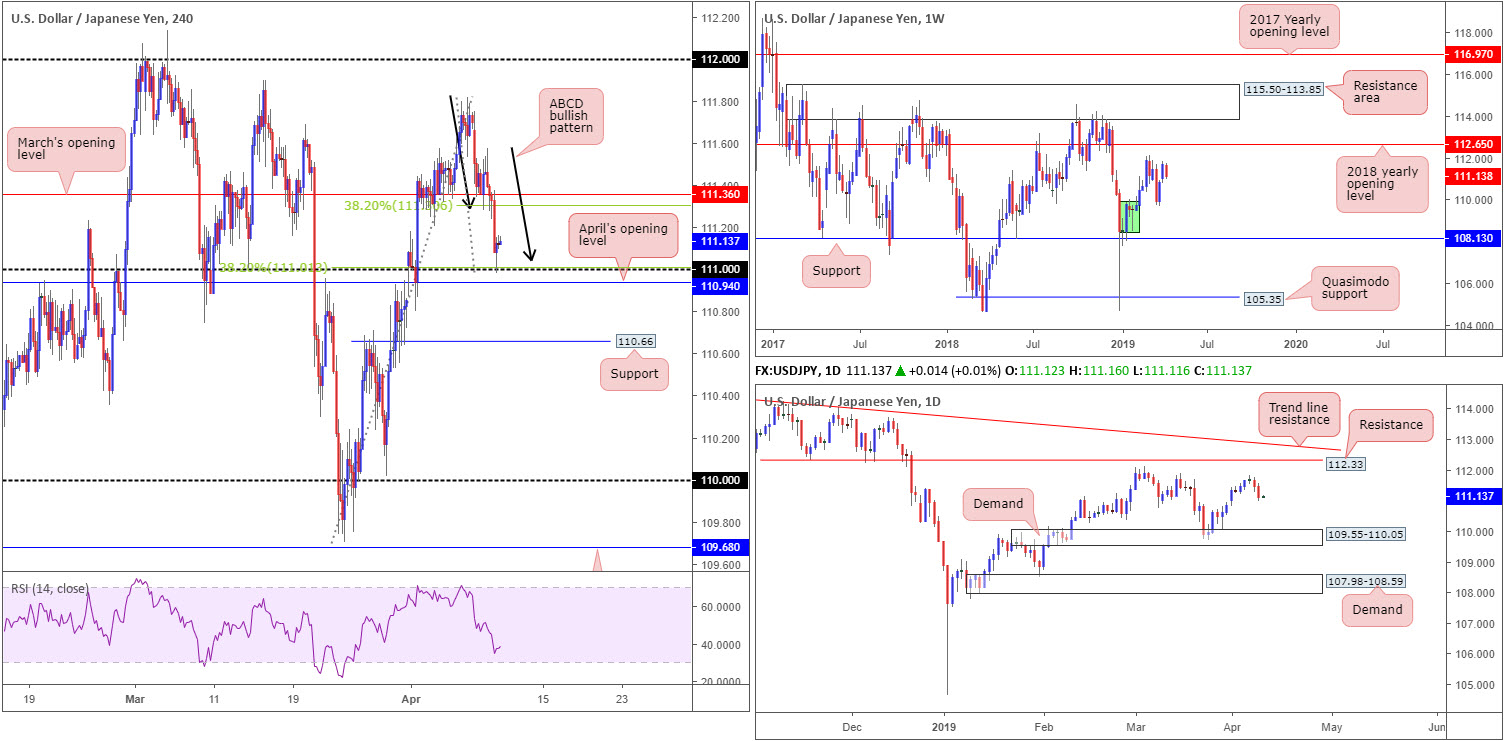
Global growth and trade fears returned to the forefront of the market Tuesday, with US President Trump threatening tariffs on European products. Demand for the safe-haven Japanese yen increased as a result of this, consequently hounding the USD/JPY below March’s opening level at 111.36 on the H4 timeframe into 111.
111, as is evident from the chart, is holding ground as we close out Tuesday’s session. Note a few points beneath here is April’s opening level at 110.94, closely followed by local support priced in at 110.66.
Structure on the weekly timeframe has the candles facing the March 4 high at 112.13, shadowed closely by the 2018 yearly opening level priced in at 112.65. To the downside, demand (green) at 108.50-109.89 is visible, sited a few points north of support coming in at 108.13.
In terms of where we stand on the daily timeframe, the March 4 high at 112.13 mentioned above on the weekly timeframe is also a discernible resistance on this scale, though the more prominent resistance falls in around 112.33, closely tailed by a long-standing trend line resistance (etched from the high 114.55). Downside, on the other hand, could possibly draw as far south as demand at 109.55-110.05.
Areas of consideration:
With little in terms of nearby structure on the higher timeframes, follow-through buying could take shape from 111 and shake hands with 111.36 today. 111, as you can probably see, is further bolstered on the back of an ABCD convergence (black arrows) at 111.04 and 38.2% Fibonacci support at 111.01.
Note the 38.2% resistance of legs A-D (considered the first take-profit target out of the ABCD formation) sits south of 111.36 at 111.30. For that reason, although a move north is high probability, it could be limited. Therefore, do ensure to prepare for this possibility and incorporate a reasonable risk/reward factor into your trading decision. Targeting a ratio of more than 1:1 to the first area of concern is recommended.
Today’s data points: US CPI m/m; US Core CPI m/m; FOMC Member Quarles Speaks; FOMC Meeting Minutes.
USD/CAD:
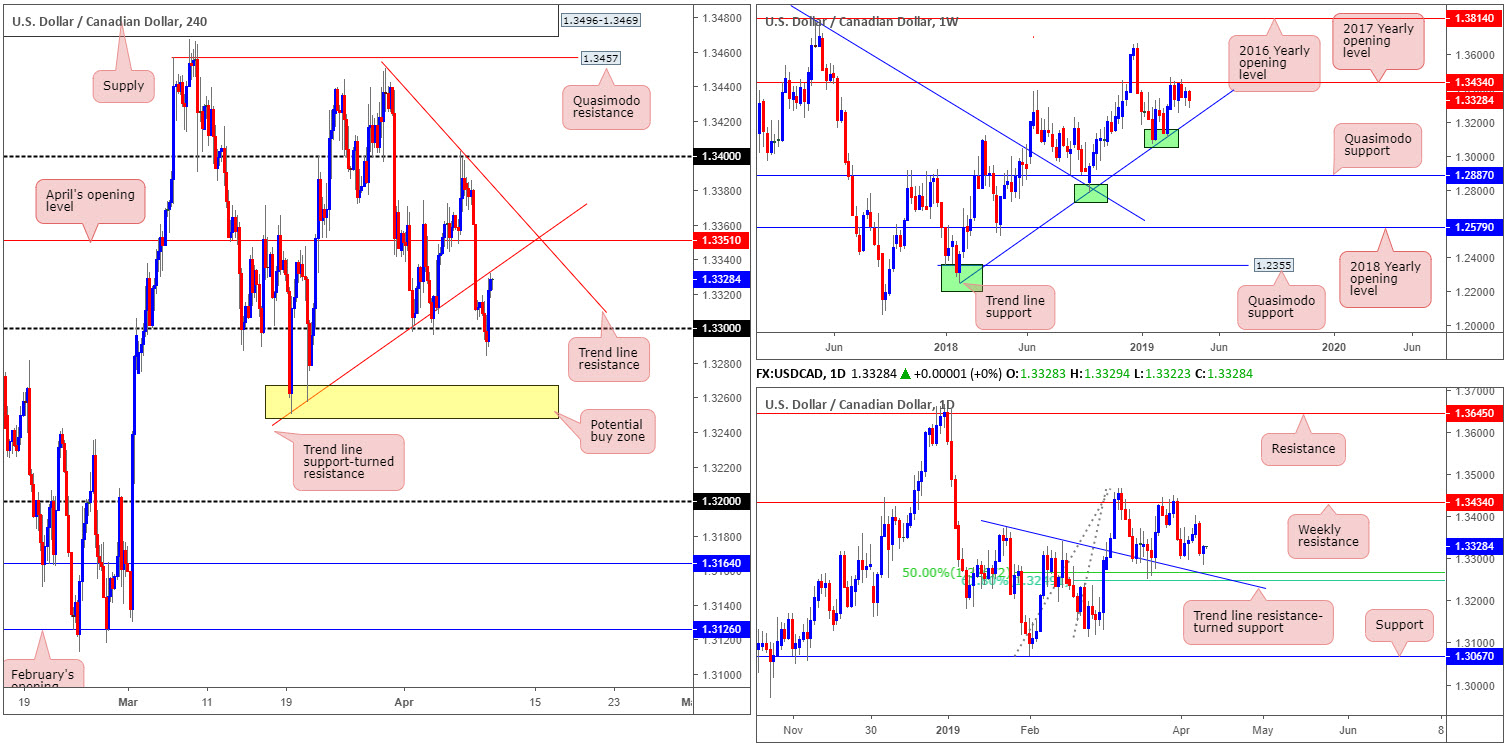
After destroying stop-loss orders beneath 1.33 on the H4 timeframe, the USD/CAD recovered in reasonably strong fashion amid US hours Tuesday, bolstered by a sudden pullback in WTI prices. Our technical readings, however, hint at the possibility of a pullback taking shape as the candles crossed swords with a trend line support-turned resistance (taken from the low 1.3250). Beyond here, the research team also has sights on potential resistance forming from April’s opening level at 1.3351 and trend line resistance (etched from the high 1.3450).
Expanding the viewpoint, the daily timeframe reveals price action basing a few points ahead of a 50.0% support at 1.3267. Note this barrier also happens to merge closely with a 61.8% Fibonacci support at 1.3248 and a trend line resistance-turned support (extended from the high 1.3375). Weekly movement, however, is engaged closely with notable resistance at 1.3434 (the 2017 yearly opening level) following a dominant push higher from a meaty trend line support (taken from the low 1.2247). Should we continue to push lower this week, there’s a strong chance we’ll see the said trend line support re-enter the fold.
Areas of consideration:
H4 price is, as mentioned above, testing the underside of a recently broken trend line resistance. So far, the level is holding and could provoke a round of selling back to 1.33 today. Trading from here requires incredibly tight risk to make the trade worthwhile from a risk/reward perspective.
Another area to keep tabs on is the yellow zone on the H4 timeframe at 1.3248/1.3267 (incorporates the daily supports and the 1.3250 March 19 low seen on the H4) for possible longs. The only grumble, of course, is weekly price shows room to push beneath this area to bring in the aforementioned weekly trend line support.
Today’s data points: US CPI m/m; US Core CPI m/m; FOMC Member Quarles Speaks; FOMC Meeting Minutes.
USD/CHF:
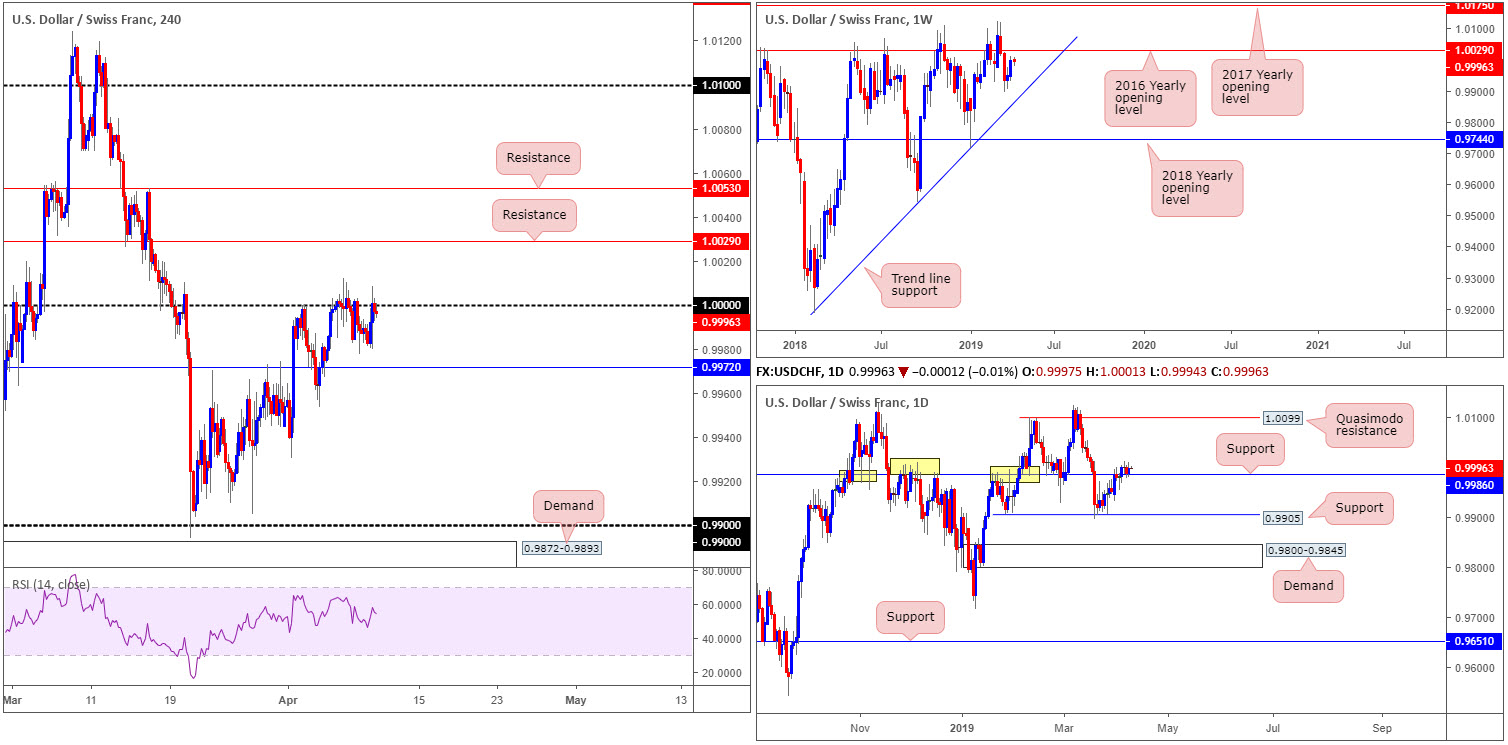
Kicking things off with an overview of the higher-timeframe picture, we can see weekly activity eyeing resistance at 1.0029: the 2016 yearly opening level. Contrary to this, however, the story on the daily timeframe, thanks to recent buying, witnessed the candles overthrow notable resistance at 0.9986 (now acting support). Note this support and resistance level boasts strong historical significance dating as far back as November 2017. Should the buyers continue bidding this market higher from here, the next area of resistance in sight falls in around a Quasimodo base at 1.0099.
1.0000 (parity), positioned on the H4 timeframe, elbowed its way back into the spotlight Tuesday and, as you can see, is holding firm as resistance. In the event we push for higher ground, two layers of resistance are visible at 1.0053 and 1.0029. Traders may want to acknowledge the lower of the two levels also represents the 2016 yearly opening level on the weekly timeframe.
Areas of consideration:
Should the pair eventually conquer 1.0000 to the upside, short-term buying opportunities may emerge, targeting 1.0029 as an initial upside target, followed by possible resistance at 1.0053. Traders considering this move are urged to ensure risk/reward conditions are favourable before pulling the trigger as the likelihood of selling materialising from 1.0029 this week is reasonably strong, despite daily flows showing room to press higher.
Shorting from 1.0000, however tempting, is a risk, not only due to daily price establishing support off 0.9986, but also because weekly movement shows room to press north to at least 1.0029.
Today’s data points: US CPI m/m; US Core CPI m/m; FOMC Member Quarles Speaks; FOMC Meeting Minutes.
Dow Jones Industrial Average:
Trade fears resurfaced Tuesday, though this time between the EU and US as US President Trump threatened tariffs on European products.
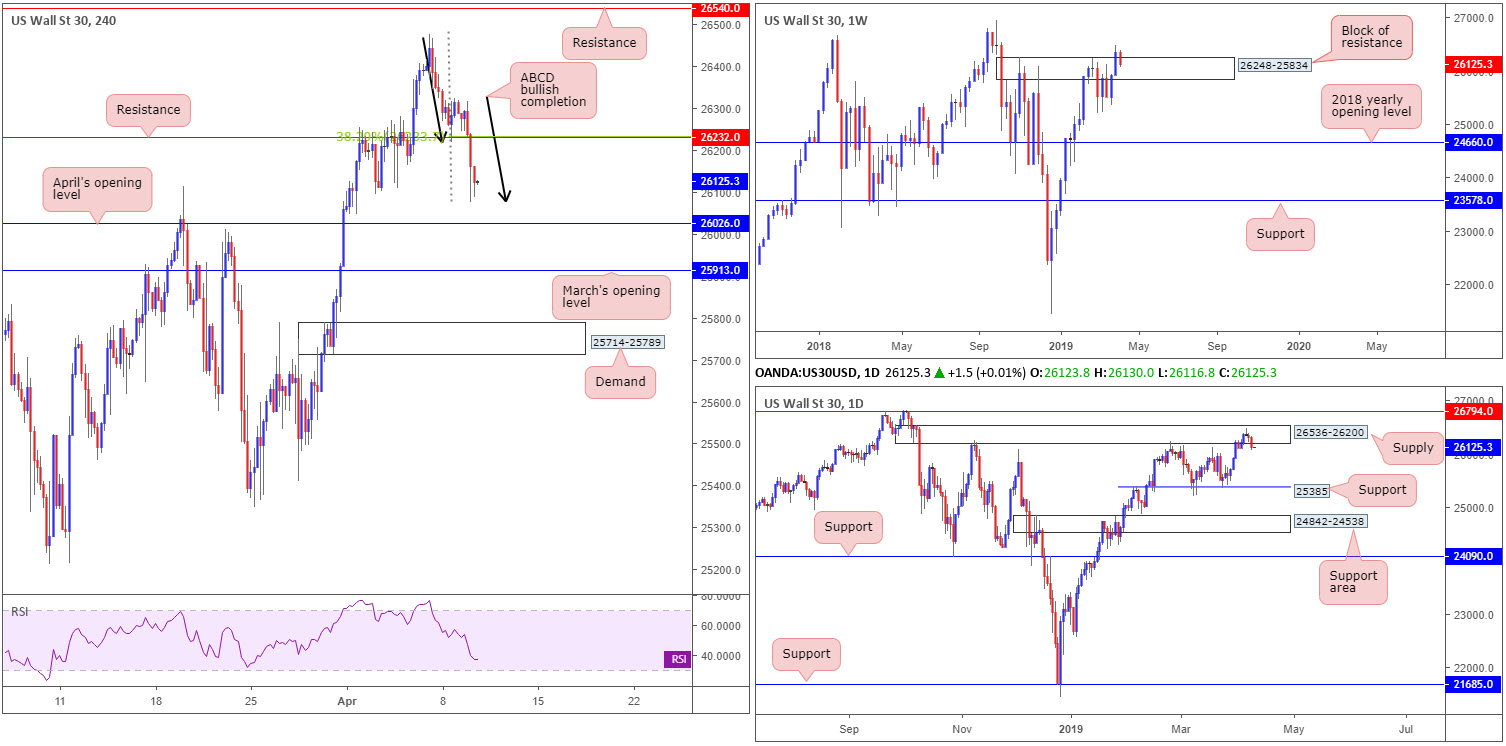
From a technical perspective, H4 price, after overthrowing support at 26232 (now acting resistance) completed an ABCD bullish pattern (black arrows) around 26081. Note this formation bottoms just ahead of April’s opening level at 26026.
In recent sessions, weekly price dominated a resistance area shown at 26248-25834, which, as you can see, is being retested as potential support now. Interestingly, though, daily supply at 26536-26200 entered the mix at the later stages of last week in the shape of a bearish pin-bar pattern, and is displaying signs of seller intent. The next downside support target from here falls in around 25385.
Areas of consideration:
Harmonic traders interested in trading the recently completed H4 ABCD bullish formation will likely find resistance emerge at 26232. Traders may want to acknowledge this level also boasts a 38.2% Fibonacci resistance value (considered the first take-profit target for the ABCD). To help avoid being stung on a pop lower to bring in April’s opening level at 26026, traders are urged to consider waiting for additional confirmation to form before pulling the trigger (entry/risk levels can be determined according to the chosen confirmation technique).
Today’s data points: US CPI m/m; US Core CPI m/m; FOMC Member Quarles Speaks; FOMC Meeting Minutes.
XAU/USD (GOLD):
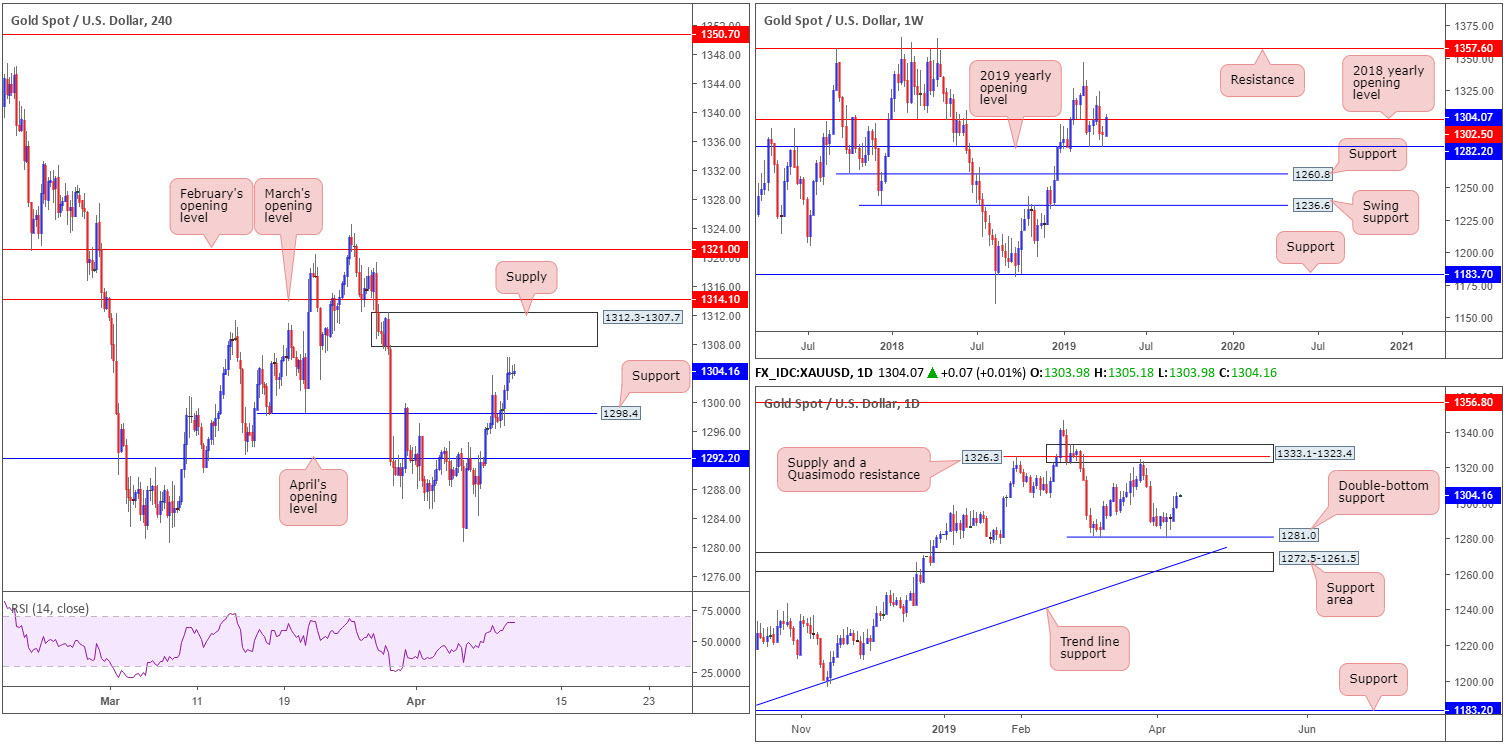
The broader picture reveals the yellow metal snapped back above its 2018 yearly opening level at 1302.5 in recent trade, largely bolstered by demand from the 2019 yearly opening level at 1282.2. Further buying is likely in this market, according to the daily timeframe. After bottoming around support at 1281.0, the yellow metal displays room to press as far north as a supply zone at 1333.1-1323.4, which incorporates a Quasimodo resistance within at 1326.3.
In view of recent buying, the H4 candles are currently poised to challenge supply drawn from 1312.3-1307.7, which, as you can see, boasts strong downside momentum from its base. Note beyond here we also have resistance in the form of March’s opening level at 1314.1. It might also be worth noting the RSI indicator is approaching its overbought value.
Areas of consideration:
Having observed both weekly and daily timeframes exhibit scope to track higher levels, selling from the current H4 supply area at 1312.3-1307.7 is considered a precarious move, given our technical studies. Could the analysis be incorrect and H4 price turn lower from the said supply? Of course it could, since we have yet to witness a weekly close form above 1302.5 to confirm its upside presence. A method to confirm seller intent from the H4 supply could be to wait and see if H4 price chalks up a bearish candlestick formation (entry and risk levels can also be determined according to the pattern’s structure). A short, assuming confirmation presents itself, has H4 support at 1298.4 to target, followed by April’s opening level at 1292.2.
The accuracy, completeness and timeliness of the information contained on this site cannot be guaranteed. IC Markets does not warranty, guarantee or make any representations, or assume any liability with regard to financial results based on the use of the information in the site.
News, views, opinions, recommendations and other information obtained from sources outside of www.icmarkets.com.au, used in this site are believed to be reliable, but we cannot guarantee their accuracy or completeness. All such information is subject to change at any time without notice. IC Markets assumes no responsibility for the content of any linked site. The fact that such links may exist does not indicate approval or endorsement of any material contained on any linked site.
IC Markets is not liable for any harm caused by the transmission, through accessing the services or information on this site, of a computer virus, or other computer code or programming device that might be used to access, delete, damage, disable, disrupt or otherwise impede in any manner, the operation of the site or of any user’s software, hardware, data or property.


