
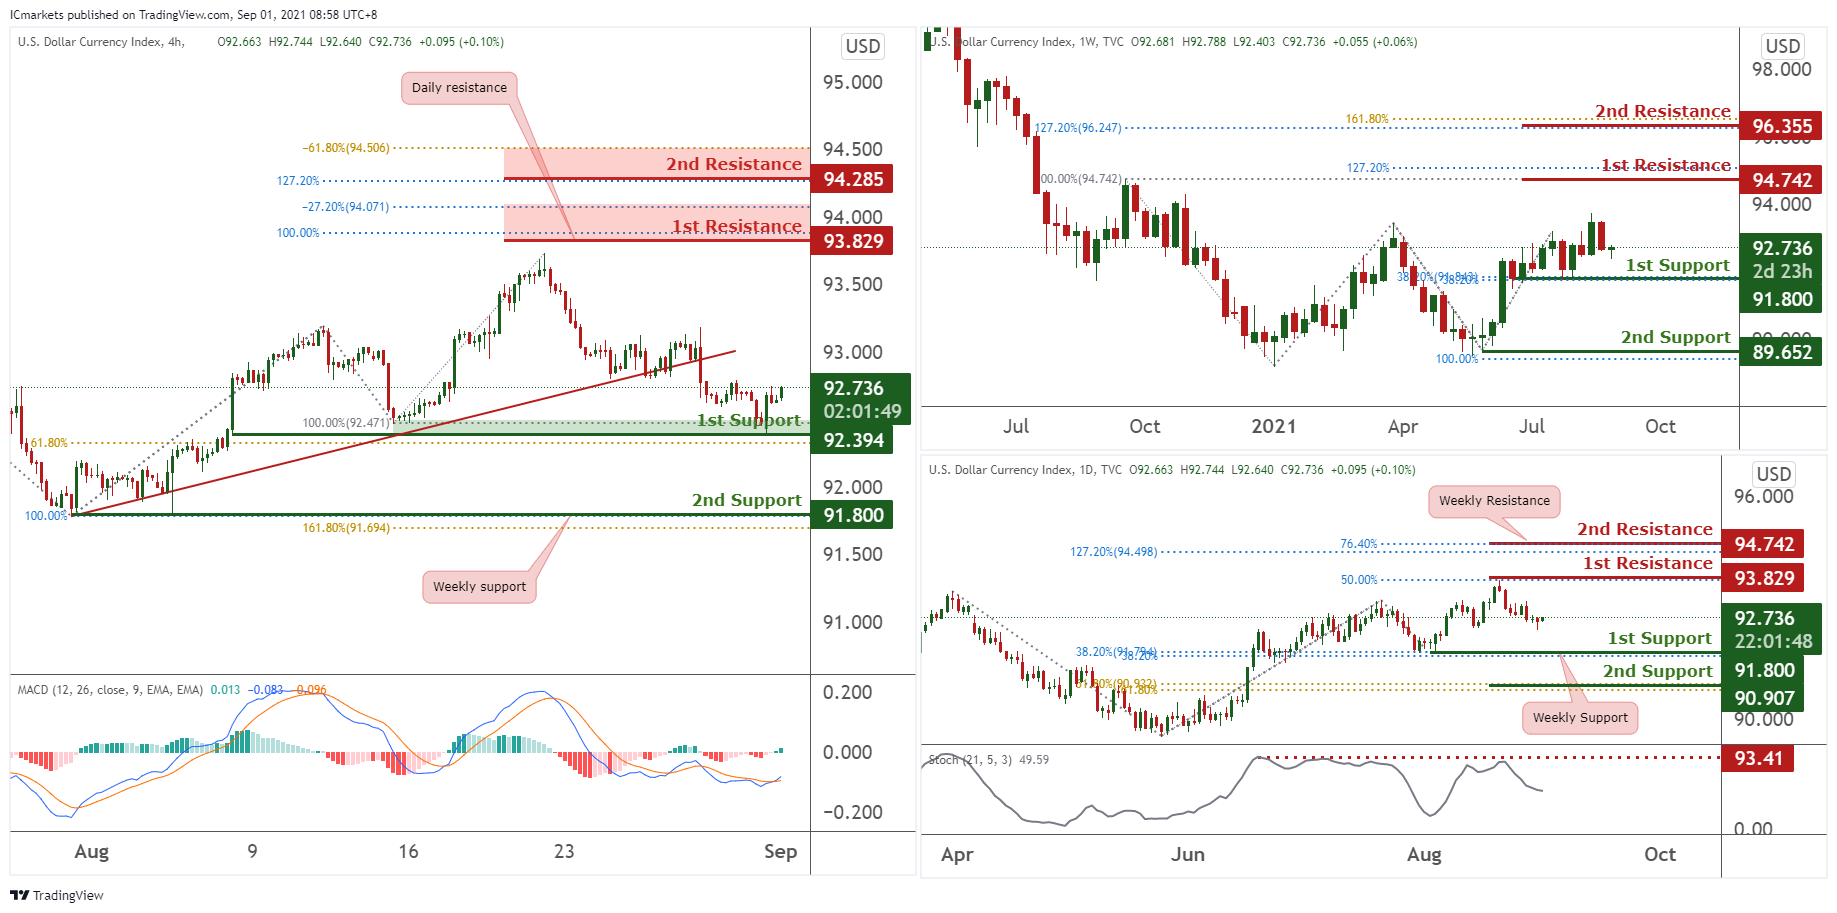
DXY:
Looking at the Weekly chart price may bearish towards the 1st support at 91.8 in line with 38.2% Fibonacci retracement and 38.2% Fibonacci extension. Otherwise, price may be bullish towards the 1st resistance at 94.742 in line with 127.2% Fibonacci extension and Horizontal swing high.
On the Daily timeframe, price is below the 1st resistance at 93.829 in line with Horizontal swing high and 50% Fibonacci extension and may bearish towards the 1st support at 91.8 in line with 38.2% Fibonacci retracement and 38.2% Fibonacci extension. Our bearish bias is further supported by how stochastic is testing resistance where price dropped in the past. Otherwise, price may bullish towards the 1st resistance at 93.829 in line with Horizontal swing high and 50% Fibonacci extension.
On the H4 timeframe, price is below the ascending trendline support (now resistance) and may bearish towards the 2nd support at 91.8 in line with 161.8% Fibonacci retracement and 100% Fibonacci extension. Our bearish bias is further supported by how MACD is shown to be holding below the 0 line. Otherwise, price may bullish towards the 1st resistance at 93.829 in line with -27.2% Fibonacci retracement and 100% Fibonacci extension.
Areas of consideration:
- H4 time frame, 1st resistance of 93.829
- H4 time frame, 2nd support of 91.8
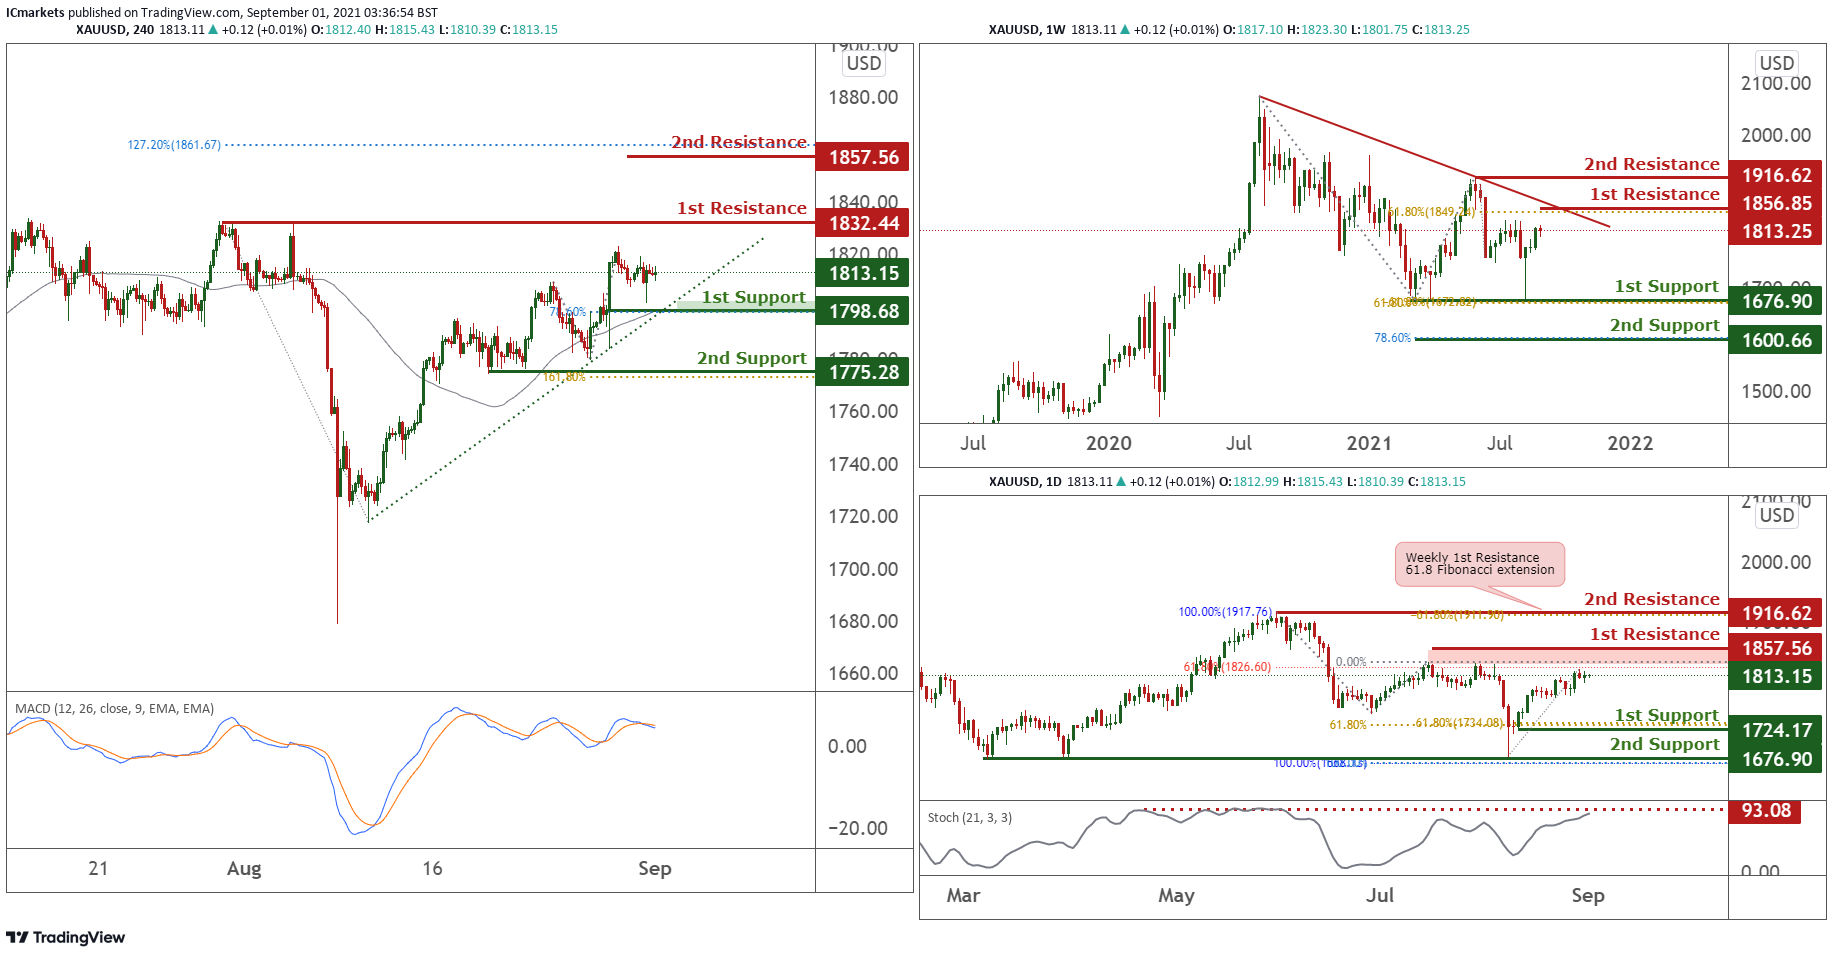
XAU/USD (GOLD):
On the weekly timeframe, price dipped below descending trendline at 2nd resistance level at 1916.62. Price is approaching 1st resistance at 1856.85. Long term buyers could possibly add to their positions here and push price higher towards graphical resistance at 1856.85 level. Otherwise, a break above our first resistance will see price push higher towards our 2nd resistance.
On the Daily, price has pushed higher and is now holding below 1st resistance at 1857.56. We see a medium probability bearish scenario where sellers may enter with their shorts and look for a possible target at the 1st support level of 1724.17. Stochastics is reacting below short term intermediate resistance as well. Otherwise, breaking above first resistance will see price push towards 2nd resistance at 1916.62.
On the H4, price drifted sideways and is holding above 1st support at 1798.68. We see a possibility of price pushing higher towards our 1st resistance at 1832.44. Technical indicators further supports this by showing room for bullish momentum. Otherwise price breaking 1st support will see price drop toward the 2nd support at 1775.28.
Areas of consideration:
- Weekly 1st support and daily 2nd support at 1676.90
- Long term 2nd resistance at 1916.62
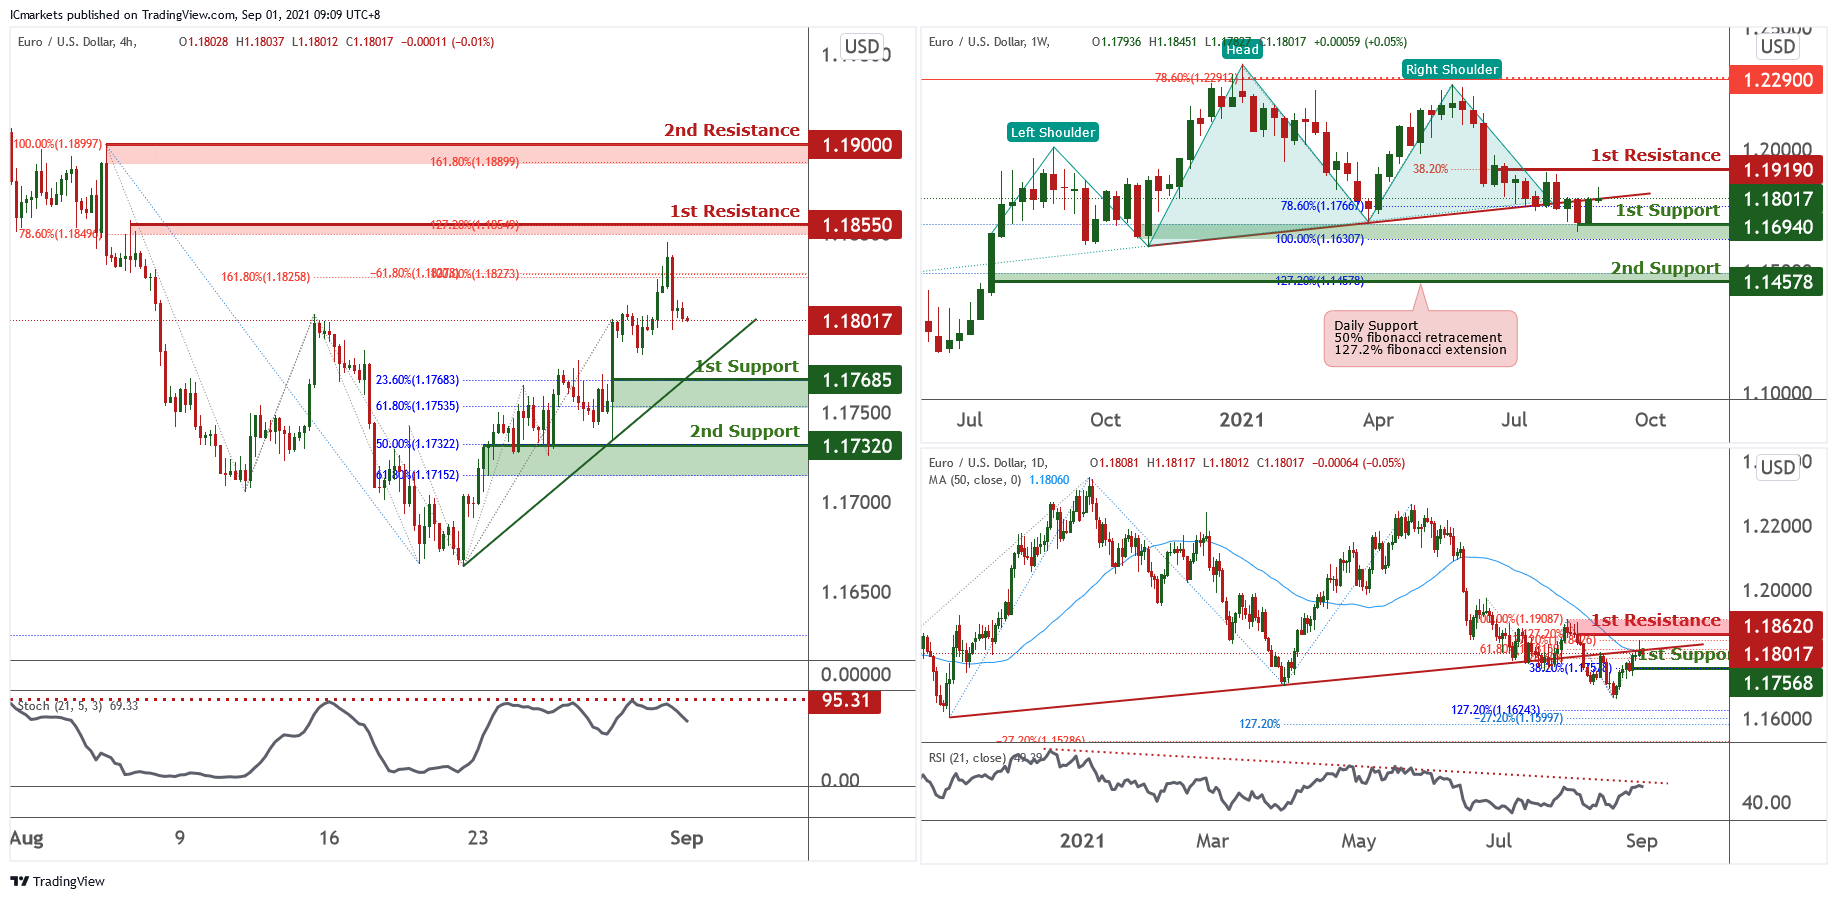
EUR/USD:
Looking at the weekly chart we can see that the price is facing bearish pressure from the trendline resistance, there could potentially be head and shoulder in play with the price target down to around 1.10840. On the Daily chart, price rebounded to resistance at 1.18155, in-line with 61.8% Fibonacci retracement, 78.6% Fibonacci extension and 50MA. Price could potentially face bearish pressure and drop. RSI is also coming into descending trendline resistance for bearish pressure.
On the H4 timeframe prices had a false break-out above previous resistance at 1.18280, in-line with -61.8% Fibonacci retracement and 78.6% Fibonacci extension. Price could potentially pull-back to first support at 1.17685, in-line with 23.6% Fibonacci retracement, 61.8% Fibonacci extension and ascending trendline support. Stochastic is also at resistance level where previous drops occurred. The next potential support could be at 1.17320, in-line with 50% Fibonacci retracement and 61.8% Fibonacci extension.
If the price bounces higher, it could potentially swing towards first resistance at 1.18550, in-line with 78.6% Fibonacci retracement and 127.2% Fibonacci extension. The next potential resistance could be at 1.19000, in-line with 100% Fibonacci retracement and 161.8% Fibonacci extension.
Areas of consideration:
- H4 time frame, support level at 1.17685 and 1.17320
- H4 time frame, resistance level at 1.18550 and 1.19000
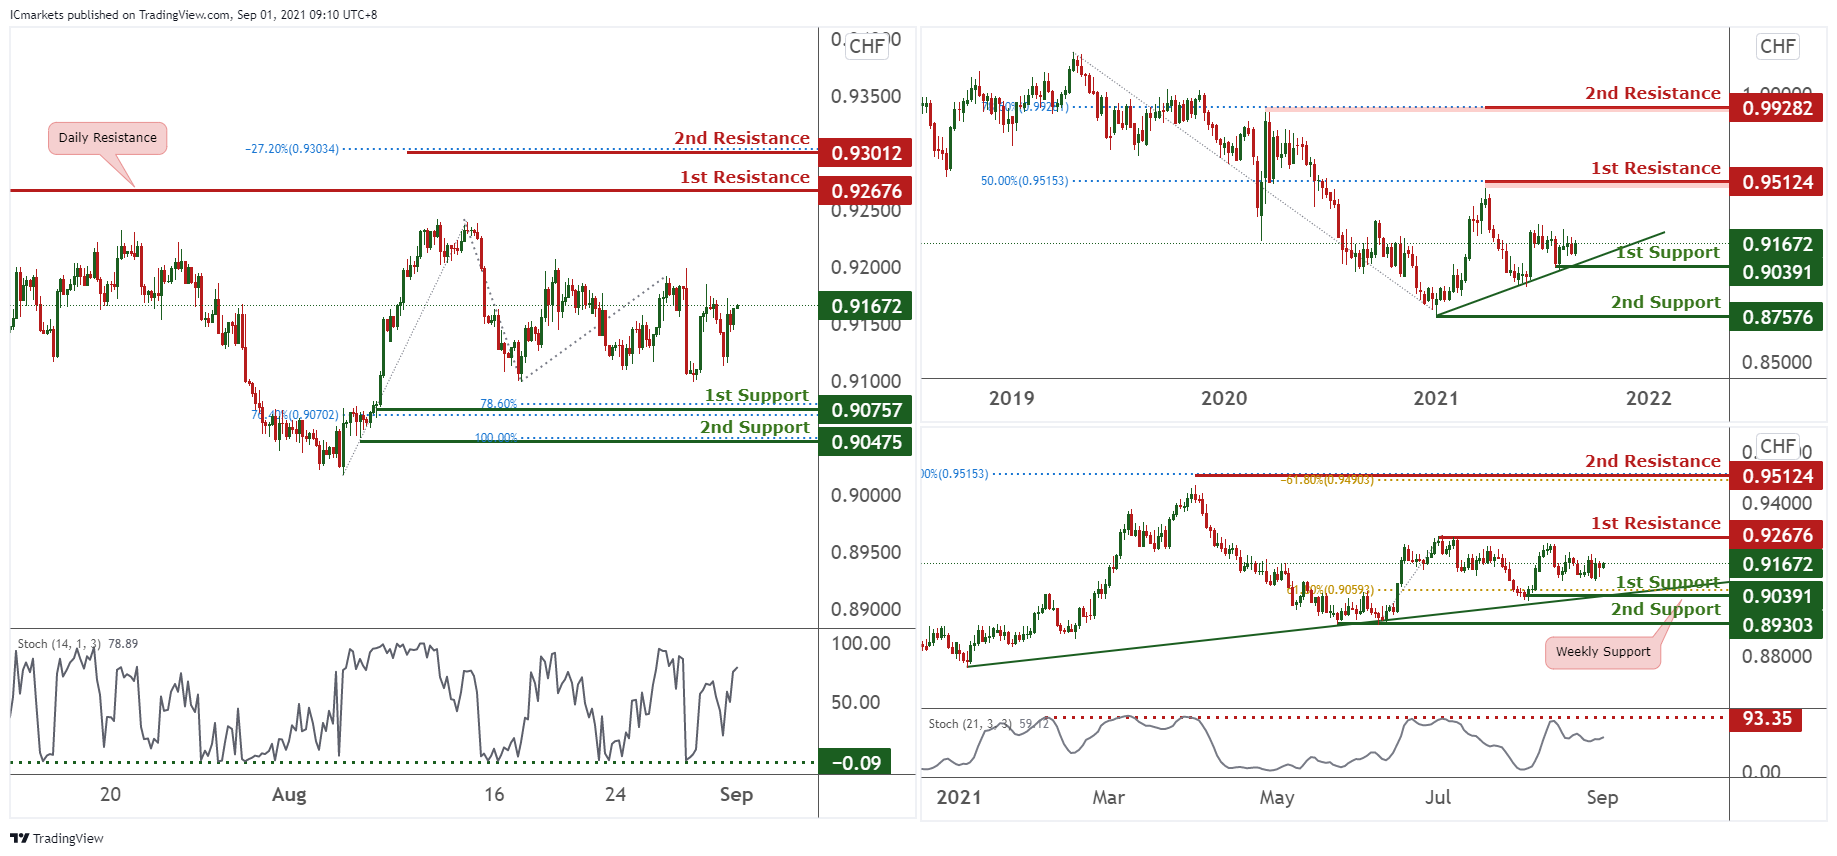
USD/CHF:
On the weekly, price is holding above ascending trendline support and also between 1st resistance at 0.95124 and 1st support at 0.90391. Traders should watch these levels closely for a break to see prices swing higher or drop lower. On the Daily, the price did not reach a graphical swing high. It is seen to have a bearish movement towards the 1st support at 0.90391. With stochastics testing resistance where price dropped in the past, we see a possibility that sellers could enter and push price towards the 1st support at 0.90391
On the H4, price is seen to have moved down and touched the previous 1st support. Price has reached the previous high, price is likely to push back up to the resistance level. Our bias for the short term is bullish as the Stochastic indicator shows that the K% line bounced off the strong support line showing a potential bullish movement.
Areas of consideration:
- Watch 1st resistance at 0.92676
- Watch 1st support at 0.90757
GBP/USD:
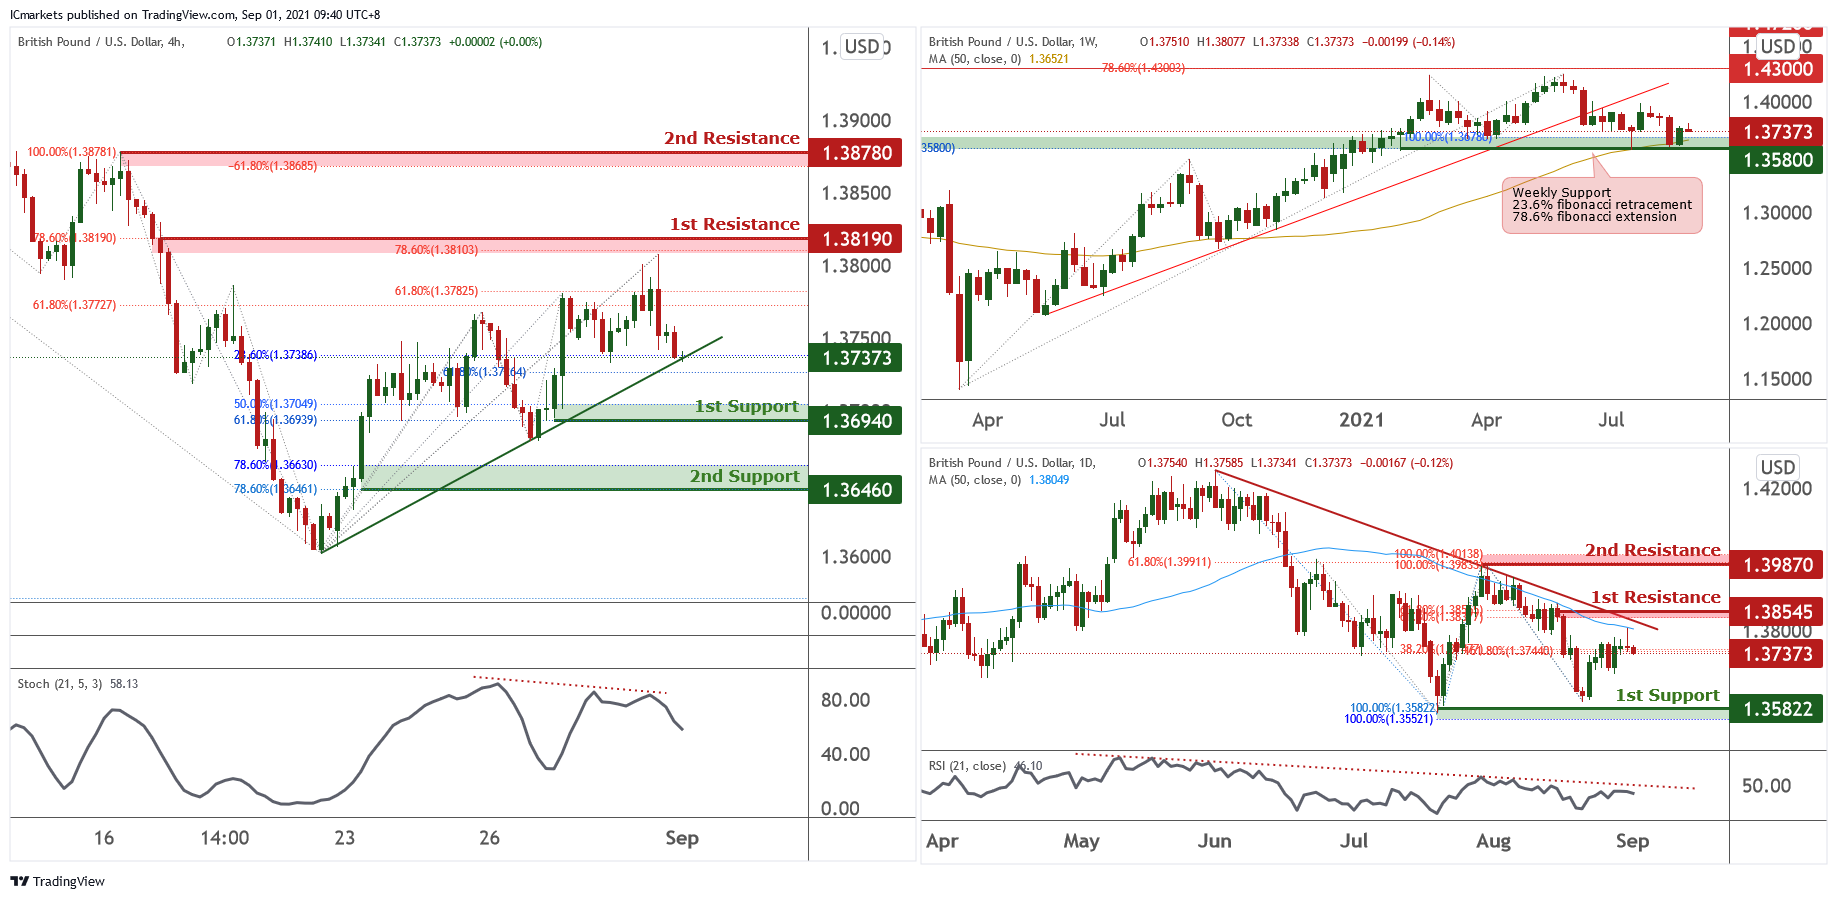
Looking at the weekly chart, price is rebounding from support at 1.35800, in-line with 23.6% Fibonacci retracement, 78.6% Fibonacci extension and 50MA. On the Daily time frame price faced bearish pressure from resistance at 1.37440 and dropped, in-line with 38.2% Fibonacci retracement and 161.8% Fibonacci extension. RSI is also indicating slight further upside before coming into descending trendline resistance.
On the H4 timeframe, prices flirted just below first resistance before dropping to support level at 1.37385, in-line with 23.6% Fibonacci retracement , 61.8% Fibonacci extension and ascending trendline support. Price could potentially have a short-term bounce before dropping further to first support at 1.36940, in-line with 50% Fibonacci retracement and 61.8% Fibonacci extension. The next support could potentially be at 1.36460, in-line with 78.6% Fibonacci retracement and 78.6% Fibonacci extension. Stochastic is also forming negative bearish divergence for possible further pull-back.
If the price bounces higher, the first potential resistance would be at 1.38190, in-line with 78.6% Fibonacci retracement and 78.6% Fibonacci extension. The next resistance could potentially be at 1.38780, in-line with -61.8% Fibonacci retracement and 100% Fibonacci extension.
Areas of consideration:
- H4 time frame, 36940 and 1.36460 support level
- H4 time frame, 1.38190 and 1.38780 resistance level
USD/JPY
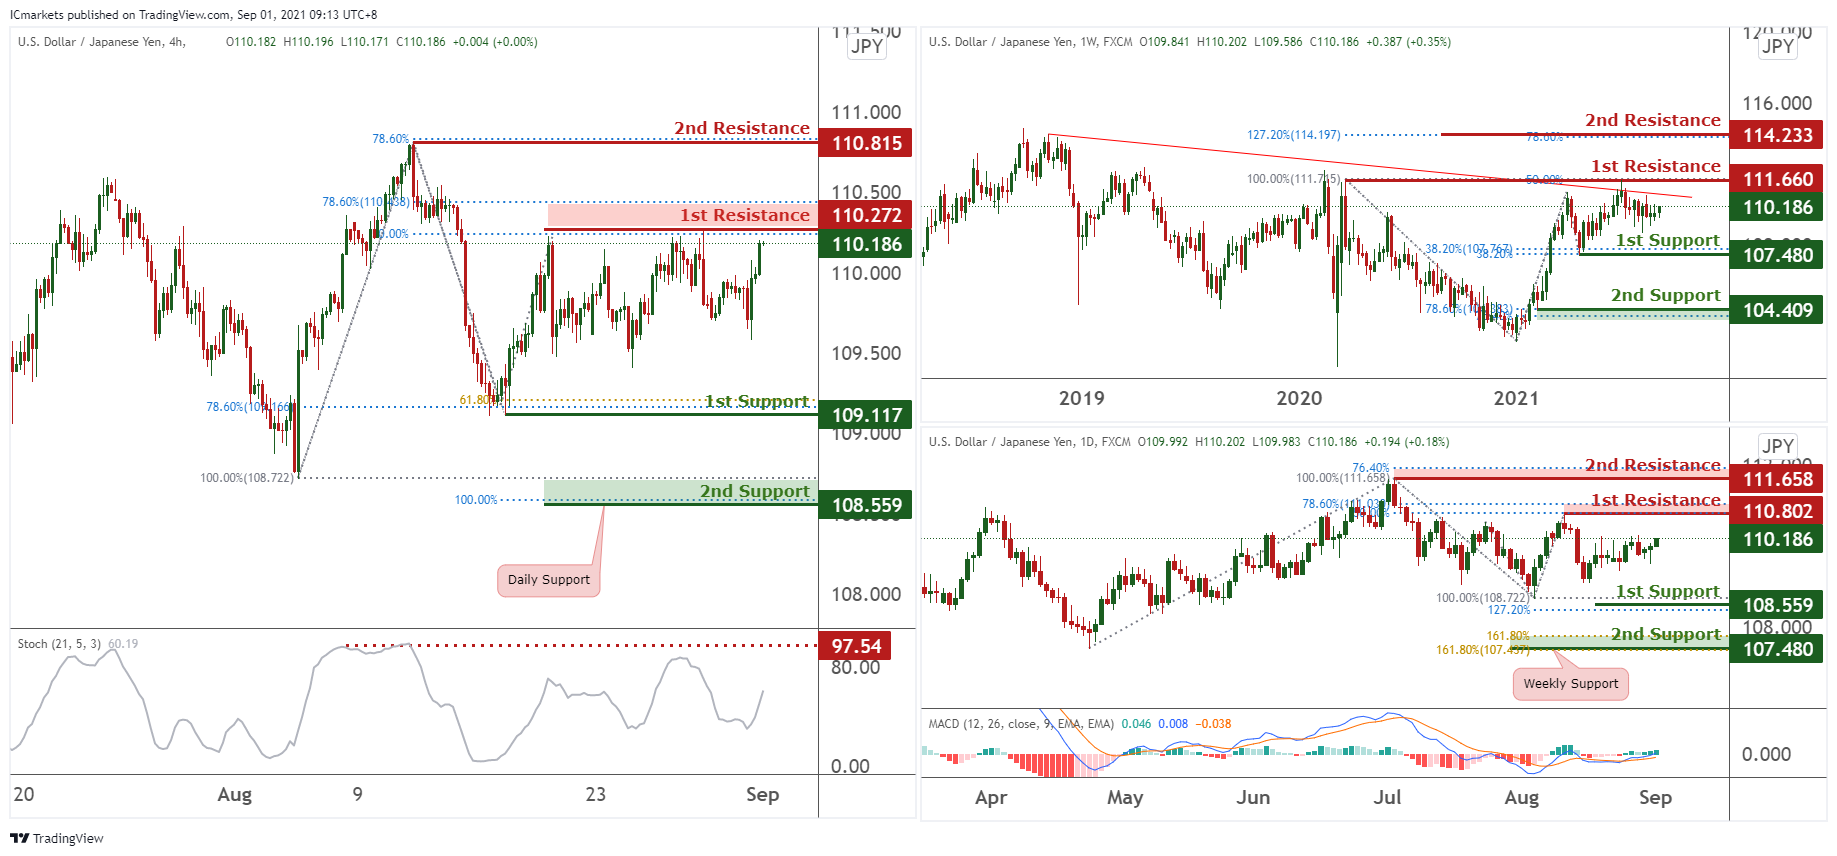
From the weekly timeframe, price is below the descending trendline resistance, and may bearish to 1st support 107.480 in line with 38.2% Fibonacci retracement and 38.2% Fibonacci extension. Otherwise, price might move towards the 1st resistance at 111.660 in line with Horizontal Swing High and 50% Fibonacci extension.
On the Daily timeframe, price may bearish to 1st support at 108.559 in line with Horizontal Swing Low and 127.2% Fibonacci extension. Our bearish view is further supported by how MACD is holding below the 0 line. Otherwise, price might move towards the 1st resistance at 110.802 in line with 78.6% Fibonacci retracement and 50% Fibonacci extension.
On the H4 timeframe, price is below the 1st resistance at 110.272 in line with 78.6% Fibonacci retracement and 50% Fibonacci extension and may bearish to the 1st support at 109.117 in line with 78.6% Fibonacci retracement and 61.8% Fibonacci extension. Our bearish view is further supported by how stochastic is reacting below the resistance where price dropped in the past. Otherwise, price might bullish towards the 2nd resistance at 110.815 in line with Horizontal Swing High and 78.6% Fibonacci extension.
Areas of consideration:
- H4 time frame, 2nd resistance of 110.815
- H4 time frame, 1st support of 109.117
AUD/USD:
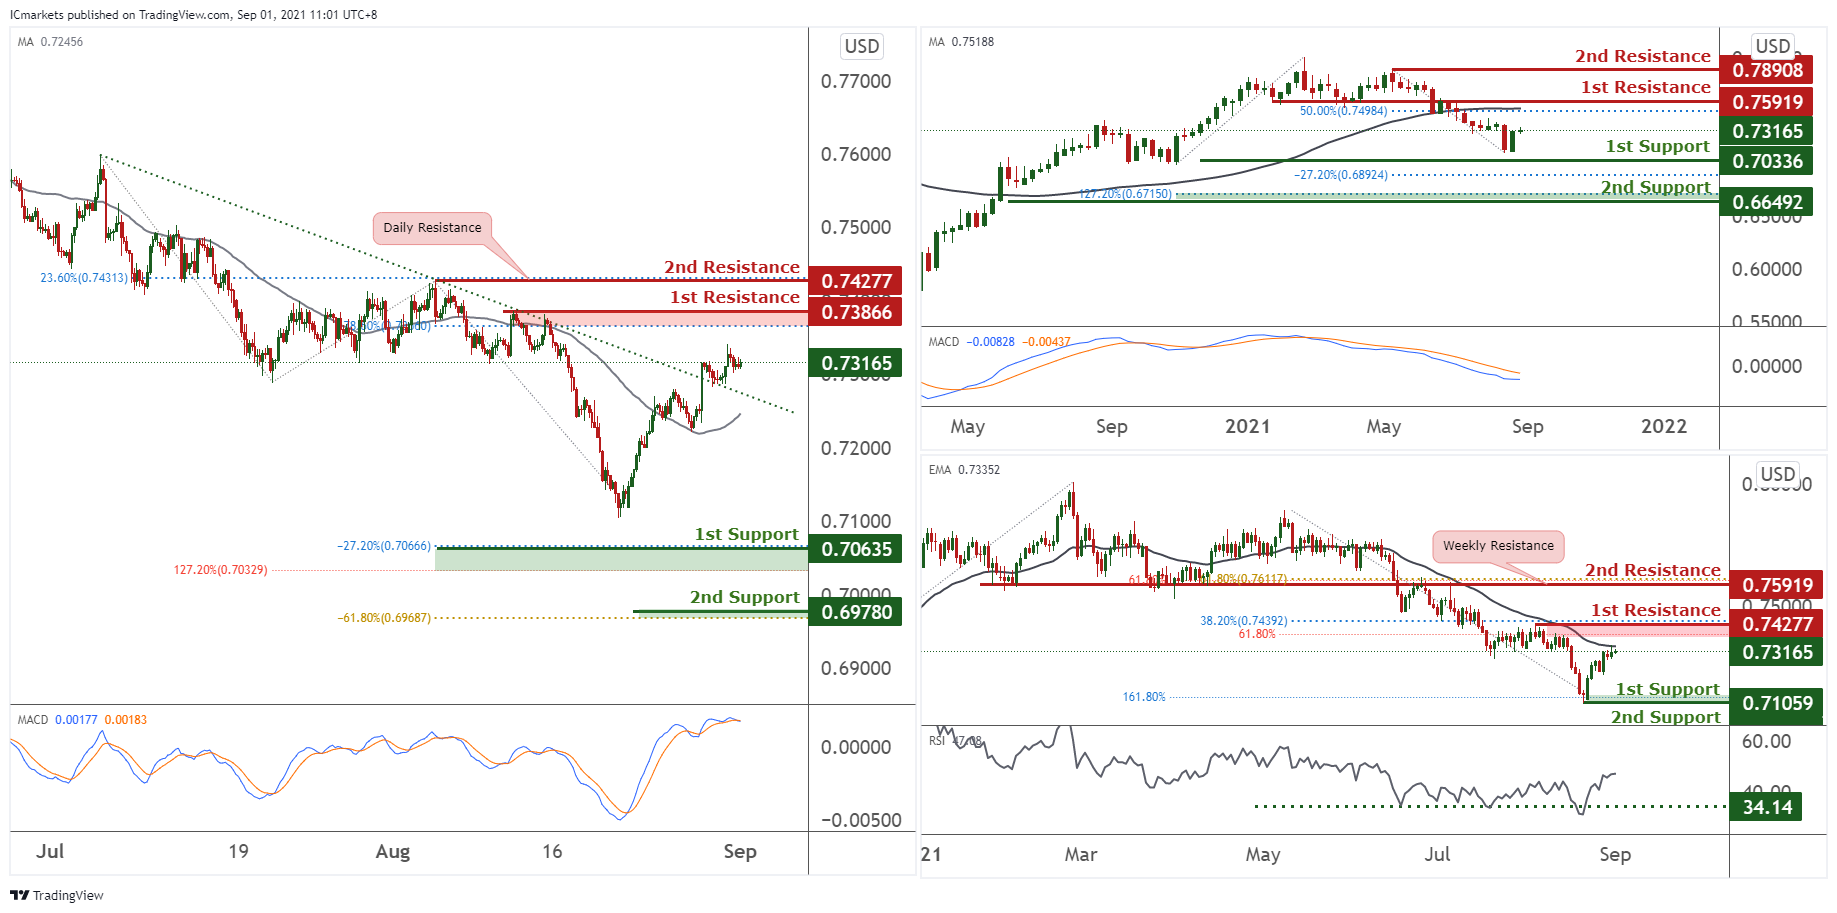
On the weekly, price is holding under the MA 50 showing bearish momentum, price is expected to put towards the first support in line with the -27.2% Fibonacci retracement level. Our bearish bias is further supported by the MACD indicator, where the MACD line has yet to cross above the Signal line to show a reversal from the bearish bias . On the Daily, the price is holding below EMA 34 showing a potential bearish momentum, however price bounced off from the first support towards the first resistance 0.74224 in line with the 61.8% Fibonacci extension and 38.2% Fibonacci retracement. Our potential short term bullish bias is further supported with the RSI indicator that broke the strong support level and bouncing back up.
On the H4, price is seen to have broken off the descending trendline resistance turned support and price is holding above the 50 Period MA. Our bias for the H4 chart in the short term would be bullish as the MACD indicator shows that the MACD line crosses above the signal line signifying a bullish momentum.
Areas of consideration:
- H4 1st resistance level 0.73866
- H4 1st support level 0.70459
NZD/USD:
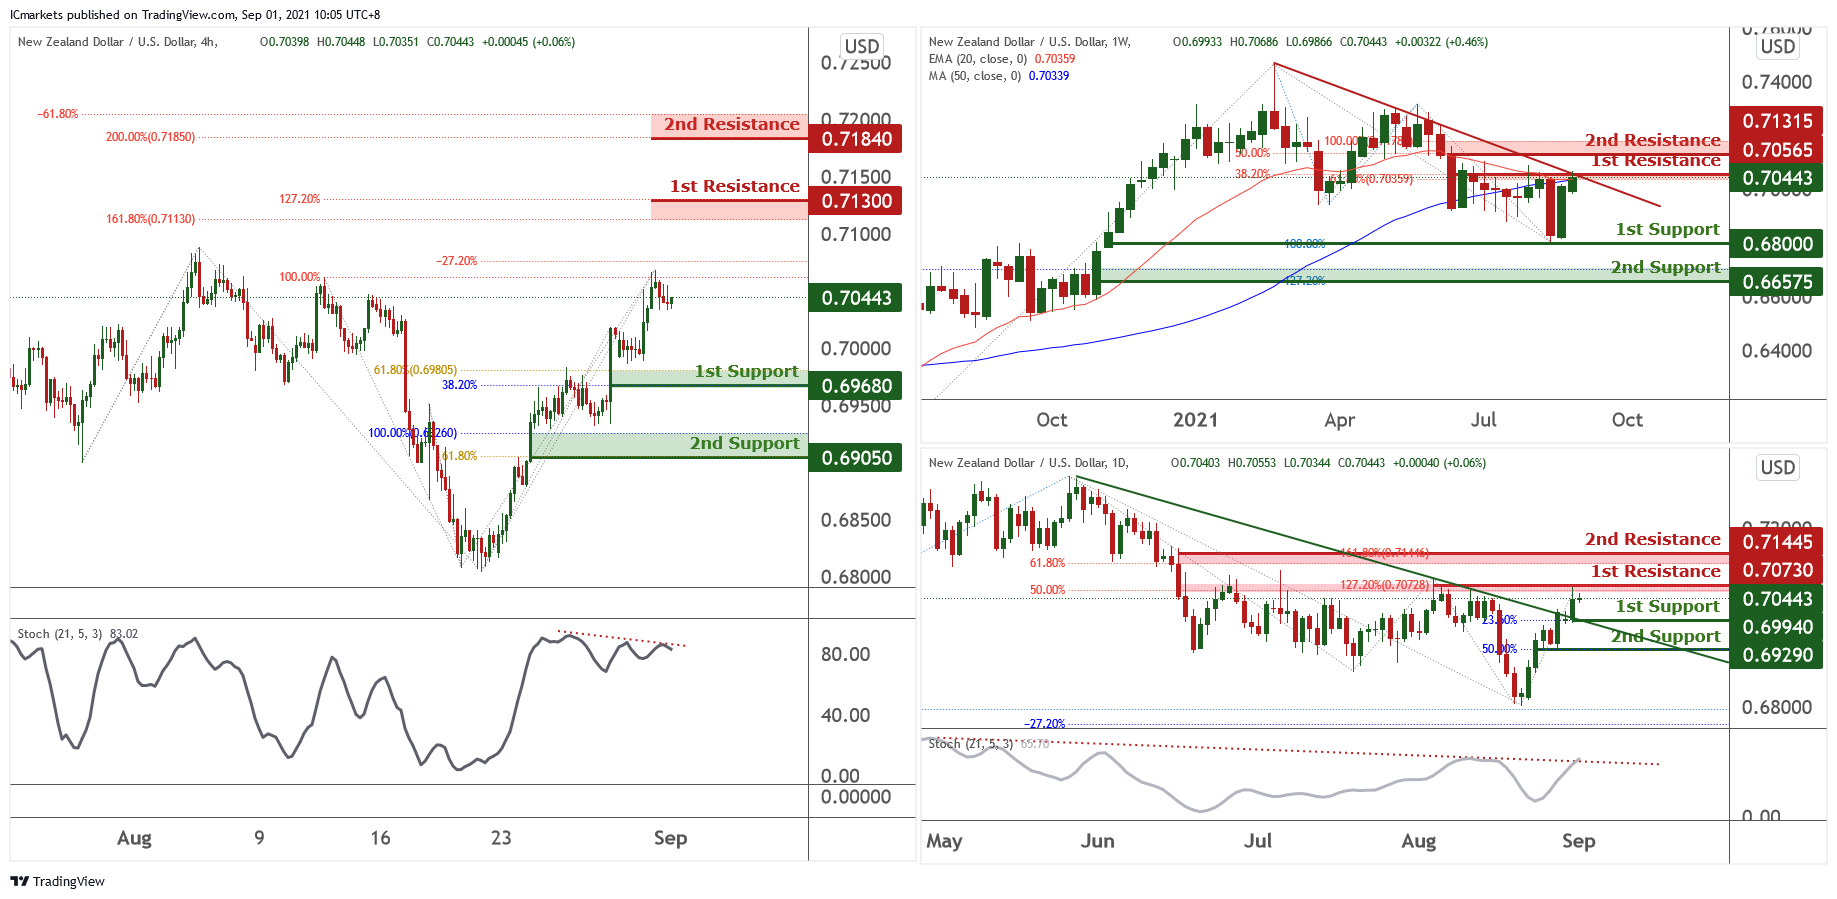
Looking at the weekly chart we could see that price is facing resistance at 0.70565, in-line with 38.2% Fibonacci retracement, 61.8% Fibonacci extension, 20EMA and 50MA. On the Daily chart, price swung towards resistance at 0.70730, in-line with 50% Fibonacci retracement and 127.2% Fibonacci extension. We could potentially see the price pull-back to first support at 0.69940, in-line with 23.6% Fibonacci retracement and descending trendline resistance-turned-support. Stochastic is also at descending trendline resistance for potential bearish pressure.
On the H4 timeframe, prices swung towards previous resistance at 0.70615, in-line with -27.2% Fibonacci retracement and 100% Fibonacci extension. Price could potentially face bearish pressure and pull-back to first support at 0.69575, in-line with 38.2% Fibonacci retracement and 61.8% Fibonacci extension. Stochastic is also forming negative bearish divergence for possible pull-back. The next potential support could be at 0.69000, in-line with 38.2% Fibonacci retracement and 61.8% Fibonacci extension.
If the price bounces higher, it could potentially swing towards first resistance at 0.71300, in-line with 127.2% Fibonacci retracement and 161.8% Fibonacci extension. The next potential resistance could be at 0.71840, in-line with -61.8% Fibonacci retracement and 200% Fibonacci extension.
Areas of consideration:
- H4 time frame, support level at 0.69575 and 69000
- H4 time frame, resistance level at 71300 and 0.71840
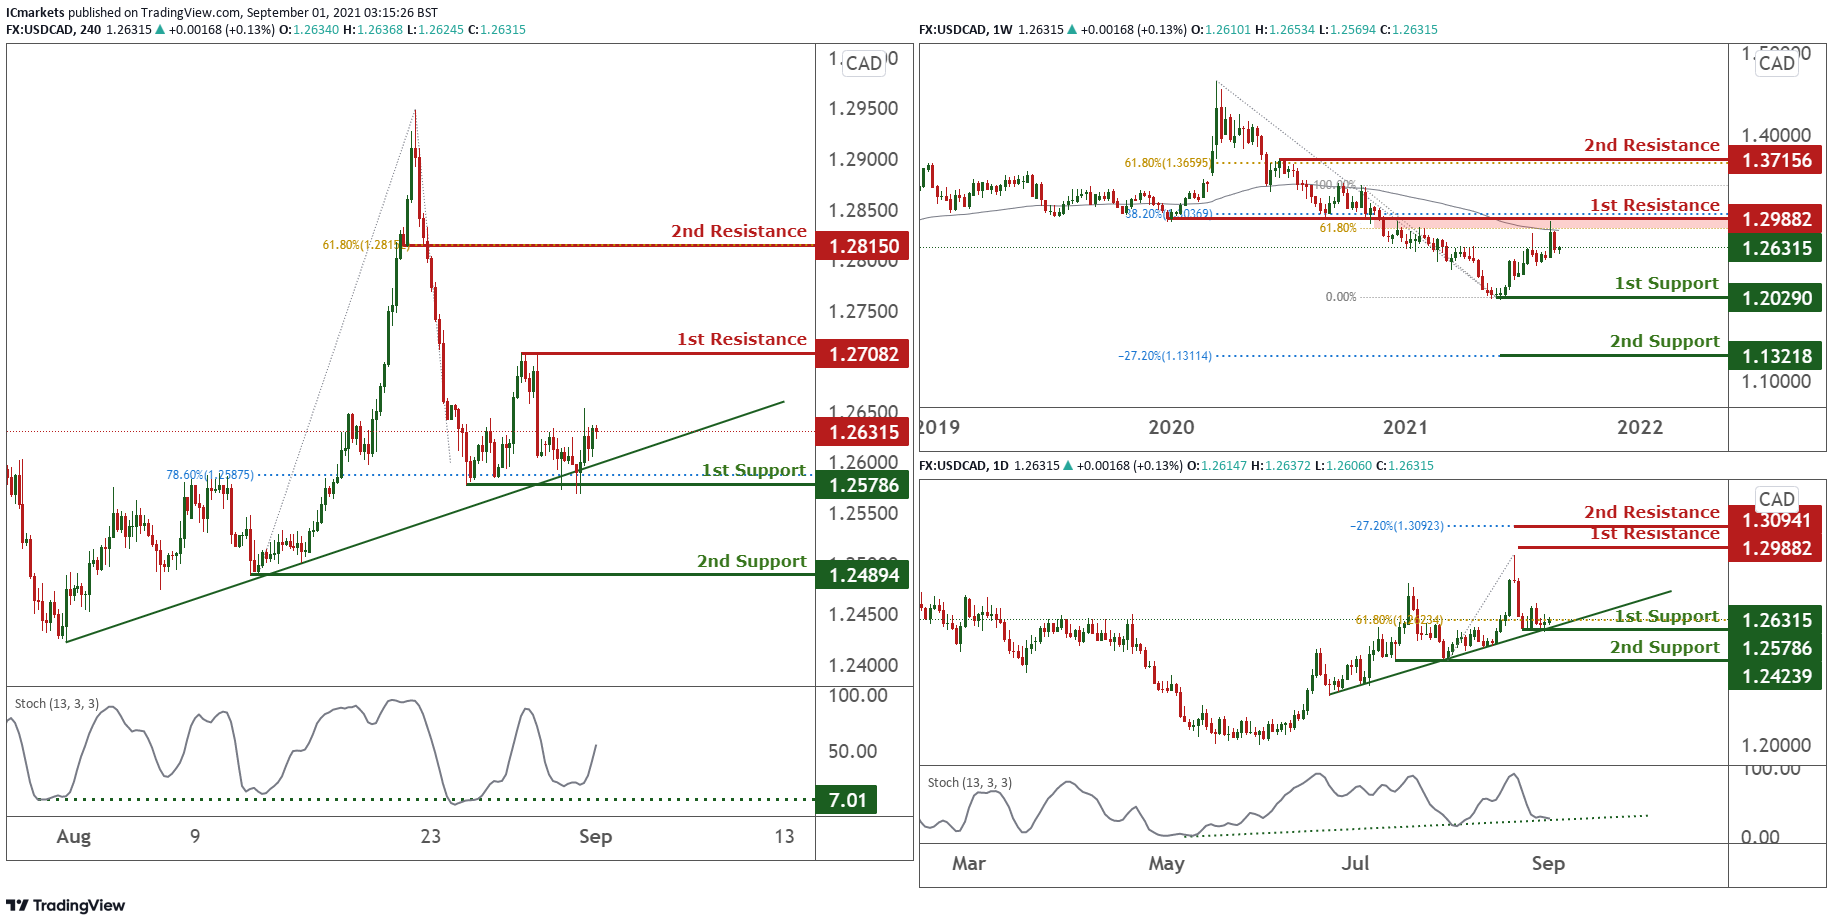
USD/CAD:
On the Weekly timeframe, price is testing long term moving average and also both 38.2% and 61.8% Fibonacci retracement level at 1.29882. As long as the price is holding below this level, we could potentially see the price facing further bearish pressure in the long term. On the Daily price is still holding above ascending trendline support. With stochastics reacting below resistance where price dropped in the past, we see price facing further bearish pressure and could likely find support at the ascending trendline support, in line with 61.8% Fibonacci retracement level.
On the H4, price bounced and pushed higher above our 1st support at 1.25786 where we also have ascending trendline support. We now see a medium probability bullish scenario where price could push higher towards recent swing high and 1st resistance at 1.27081. Otherwise, breaking below our 1st support will see the bullish bias fail and price drop lower towards 2nd support. Stochastcis on H4 also shows it testing support where price bounced in the past as well.
Areas of consideration:
- H4 time frame, support level at 1.25786
- Stochastics on Daily and H4 on support
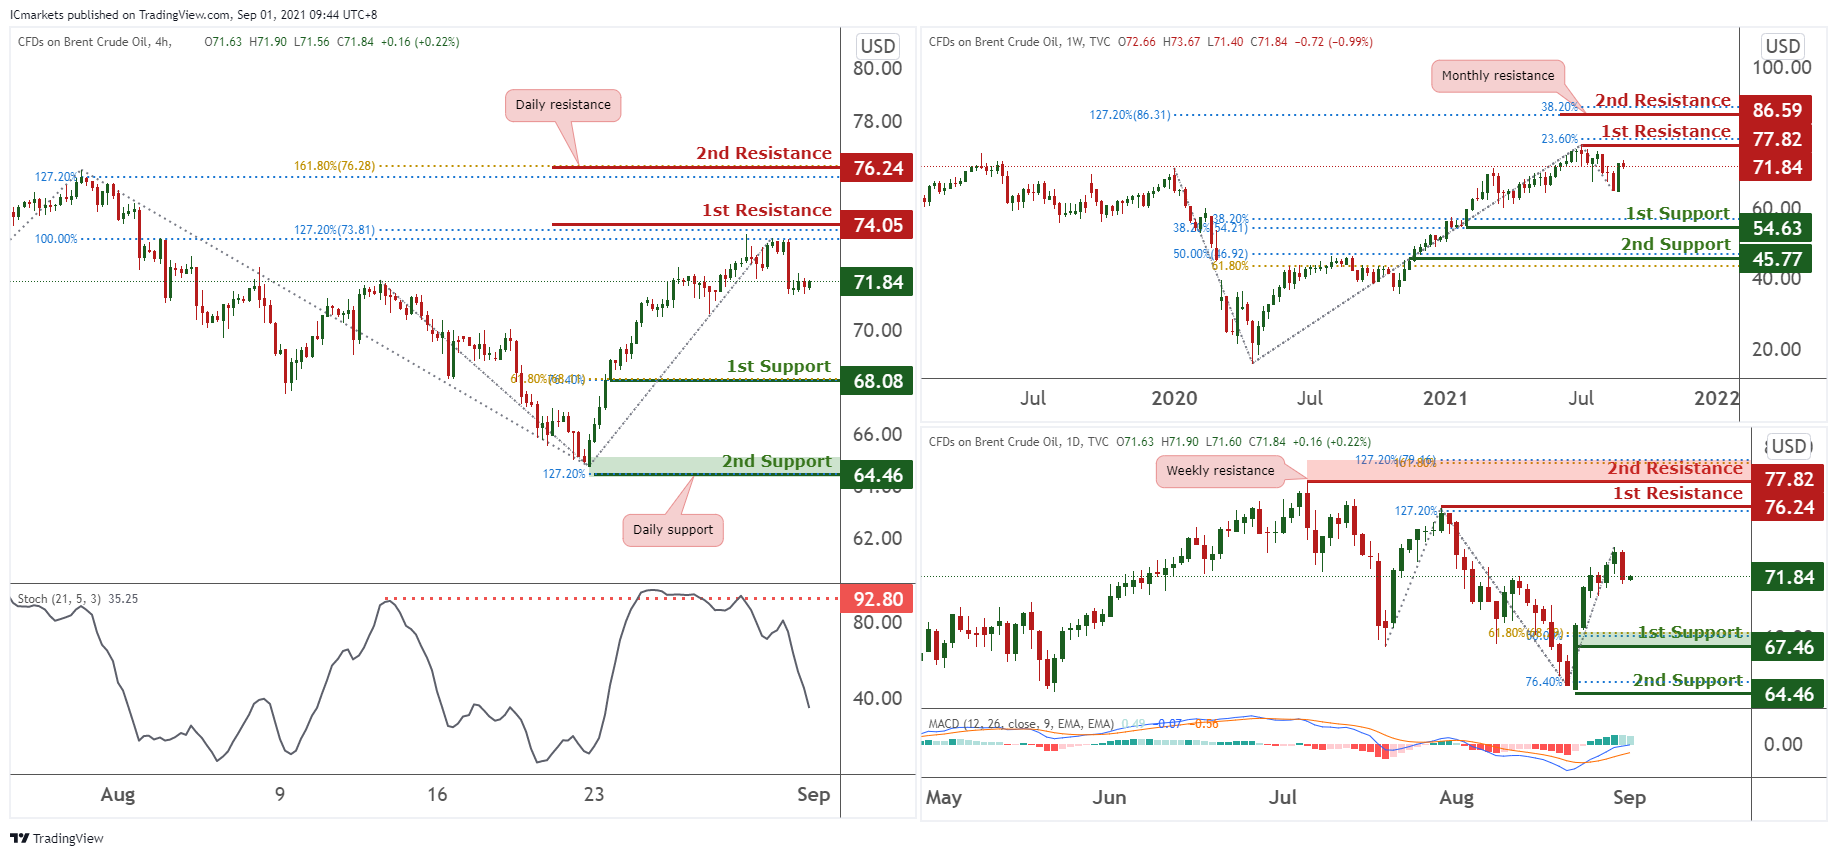
OIL:
On Weekly timeframe, we can see price below 1st resistance from horizontal swing high at 77.82 in line with 23.6% Fibonacci extension. Price may continue its bearish momentum and may find 1st support at 54.63 in line with 38.2% Fibonacci retracement and 38.2% Fibonacci extension. However, if price breaks above 77.82 which is 1st resistance at horizontal swing high in line with 23.6% Fibonacci extension, it may swing up towards the 2nd resistance at 86.59 in line with 127.2% Fibonacci retracement and 38.2 Fibonacci extension.
On the Daily timeframe, we are seeing a similar bearish pressure as price is below 1st resistance at 76.24 in line with Horizontal swing high and 127.2% Fibonacci extension and may find 1st support at 67.46 which is in line with 61.8% Fibonacci retracement and 50% Fibonacci extension. Our bearish bias is further supported by how MACD is shown to be holding below the 0 line. Otherwise, price may move towards the 1st support at 76.24 in line with Horizontal swing high and 127.2% Fibonacci extension.
Lastly, on the H4 timeframe, price is below the 1st resistance at 74.05 in line with 127.2% Fibonacci retracement and 100% Fibonacci extension and may bearish towards 1st support at 68.08 in line with 61.8% Fibonacci retracement and 76.4% Fibonacci extension. Our bearish bias is further supported by how Stocastic is testing resistance where price dropped in the past. Otherwise price may move towards the 2nd resistance at 76.24 in line with 161.8% Fibonacci retracement and 127.2% Fibonacci extension.
Areas of consideration:
- H4 time frame, 2nd resistance of 76.24
- H4 time frame, 1st support of 68.08
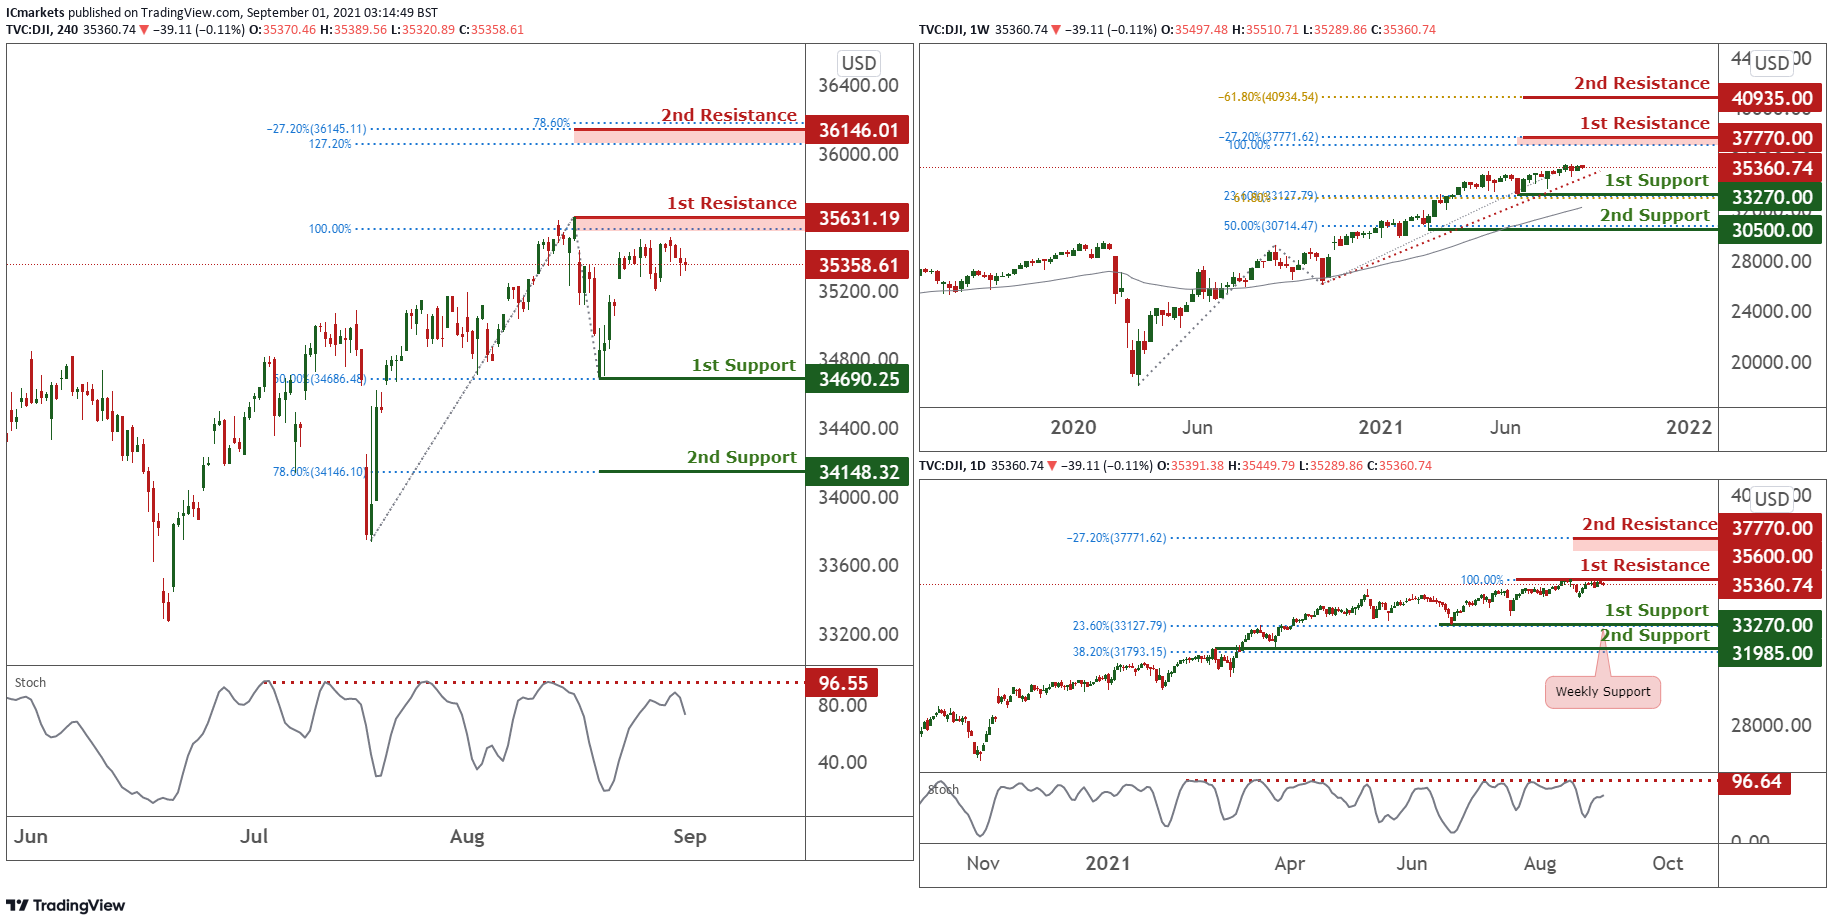
Dow Jones Industrial Average:
On the weekly chart, price is trading sideways holding between 33270 support and 38119.37 resistance. With price holding above long term moving average, we see a possibility of price facing further bullish pressure.
On the Daily chart, price is still testing and capped below resistance at 36021. With stochastic still holding below resistance where price dropped in the past, we see price facing possible bearish pressure.
On the H4, price drifting lower and still holding below 1st resistance at 35631. We see a medium probability bearish scenario where sellers may further add to their shorts to push price lower towards our 1st support at 34690. Otherwise a break above our 1st resistance will see price swing higher towards next resistance at 36146. Stochastic is testing resistance where price pulled back lower in the past as well.
Areas of consideration:
- 35631 resistance level on the H4 timeframe
- Stochastics testing resistance on Daily and H4
The accuracy, completeness and timeliness of the information contained on this site cannot be guaranteed. IC Markets does not warranty, guarantee or make any representations, or assume any liability regarding financial results based on the use of the information in the site.
News, views, opinions, recommendations and other information obtained from sources outside of www.icmarkets.com.au, used in this site are believed to be reliable, but we cannot guarantee their accuracy or completeness. All such information is subject to change at any time without notice. IC Markets assumes no responsibility for the content of any linked site.
The fact that such links may exist does not indicate approval or endorsement of any material contained on any linked site. IC Markets is not liable for any harm caused by the transmission, through accessing the services or information on this site, of a computer virus, or other computer code or programming device that might be used to access, delete, damage, disable, disrupt or otherwise impede in any manner, the operation of the site or of any user’s software, hardware, data or property.


