
Key risk events today:
New Zealand ANZ Business Confidence; Australia NAB Business Confidence.
(Previous analysis as well as outside sources – italics).
EUR/USD:
The US dollar index failed to extend Friday’s NFP-induced recovery, pushing the buck to lows at 96.66.
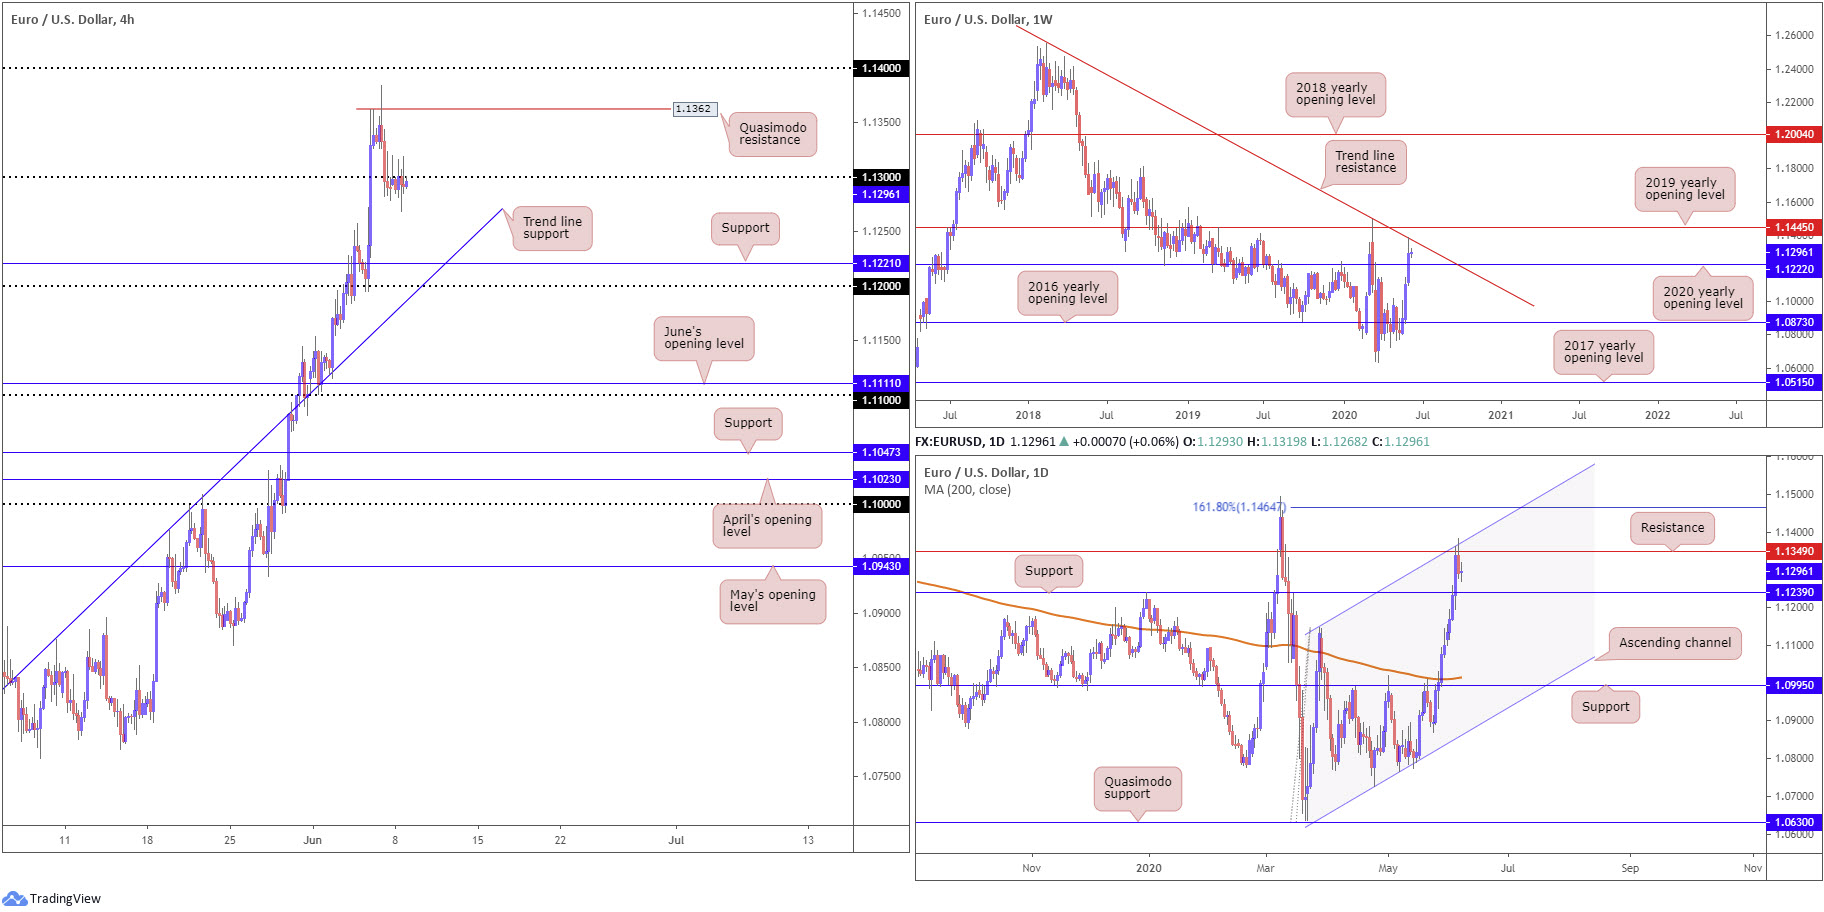
EUR/USD left Monday muted, glued to the underside of the 1.13 handle on the H4 timeframe, ranging between 1.1319/1.1268. Downside support from here, therefore, remains at 1.1221 (prior Quasimodo resistance), closely followed by the 1.12 handle and trend line support, taken from the low 1.0727.
Given a lacklustre Monday, Monday’s weekly report of the weekly and daily timeframes are unchanged:
Weekly timeframe:
Over the course of last week, EUR/USD extended recovery gains north of the 2020 yearly opening level at 1.1222, consequently grappling with trend line resistance into the close, a level extended from highs at 1.2555.
This may lure price lower this week, perhaps reconnecting with 1.1222. Further upside, on the other hand, could have the unit cross swords with the 2019 yearly opening level at 1.1445.
With respect to the long-term trend, the pair has remained under pressure since topping in early February 2018.
Daily timeframe:
The daily timeframe, meanwhile, pivoted lower from resistance at 1.1349 Friday after eight days of impressive gains. Price action traders may have also noted the converging channel resistance, extended from the high 1.1147.
Like the weekly timeframe, a push lower could also be on the cards this week here, though daily flow indicates support may materialise at 1.1239. In the event 1.1349 gives way, nevertheless, a 161.8% Fibonacci extension point at 1.1464 may make an appearance.
Areas of consideration:
Outlook remains unchanged from Monday’s weekly report:
All three timeframes suggest sellers have the upper hand, at least until we reach 1.1239: daily support.
As a result, traders may seek bearish strategies under 1.13, targeting 1.1239, followed by the 2020 yearly opening level on the weekly timeframe at 1.1222 and then 1.12 on the H4.
Conservative traders may also be short from here, owing to Monday printing an array of H4 shooting star candlestick patterns under 1.13, adding weight to the possibility of moves lower.
GBP/USD:
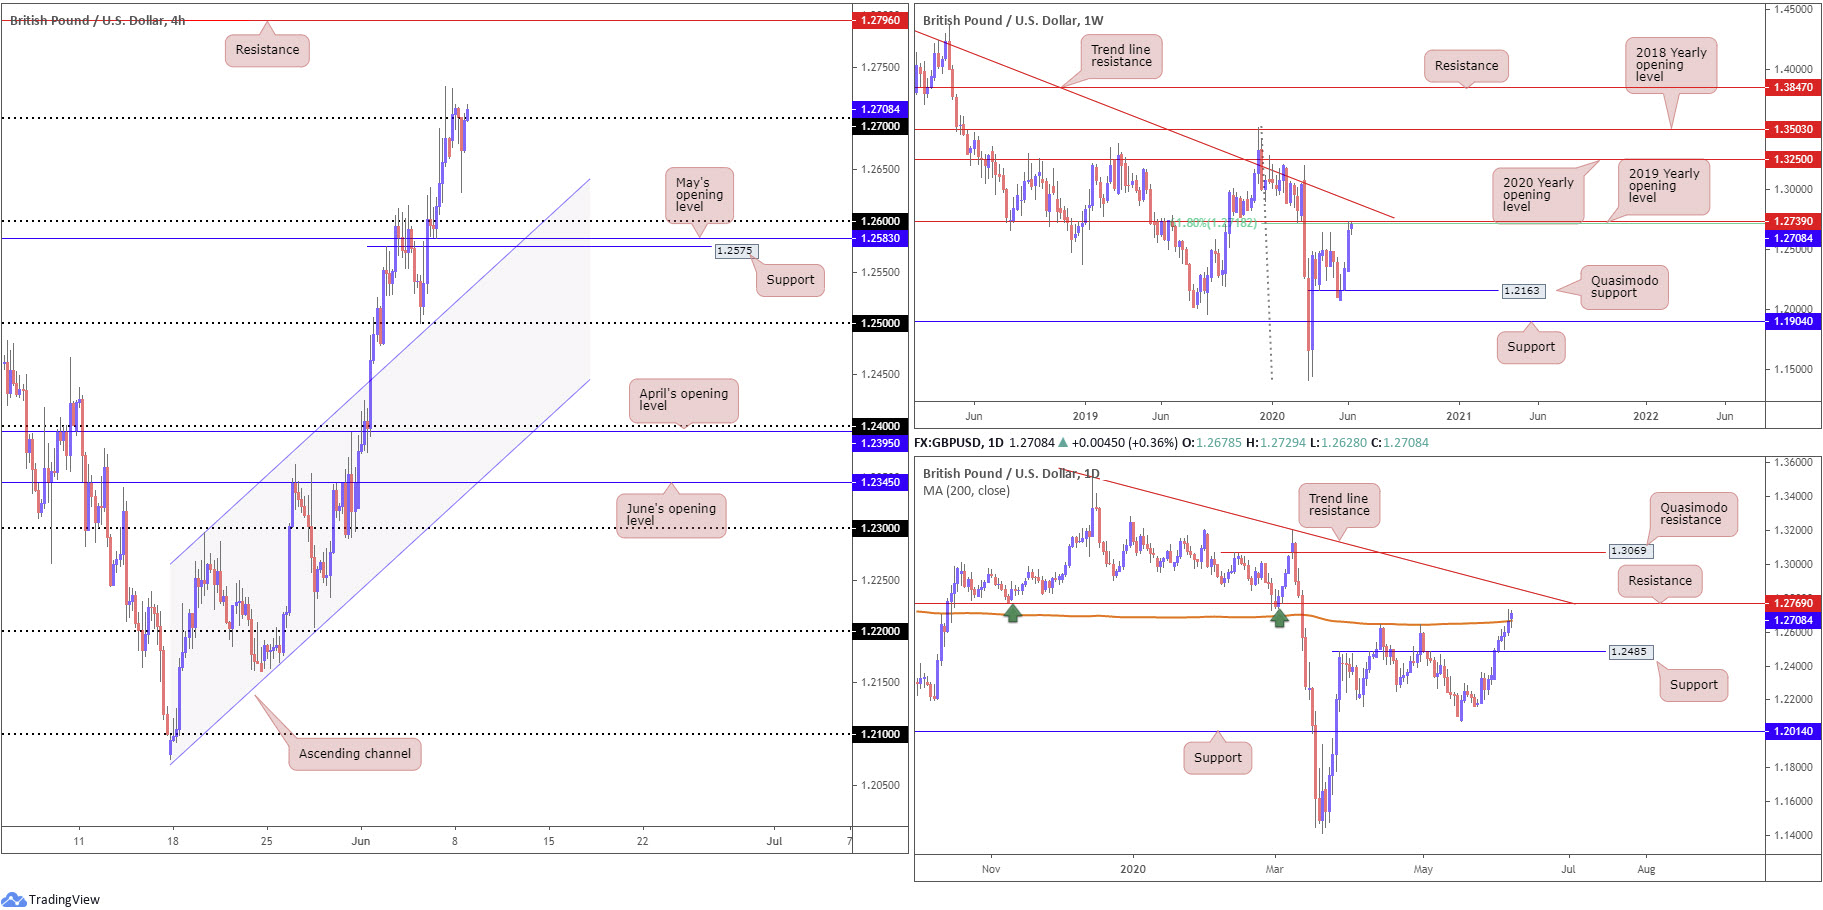
Sterling dipped to lows at 1.2628 Monday and began staging a recovery into US hours, moves aided by USD softness, which eventually tested waters above 1.27 on the H4 timeframe. An enthusiastic bid north of 1.27 is likely to target 1.2796 (prior Quasimodo support), a few pips under 1.28. Should we see a downturn, however, keep eyes on the 1.26 handle, aligning closely with May’s opening level at 1.2583, support at 1.2575 and channel resistance-turned support, etched from the high 1.2296.
In terms of price movement on the weekly timeframe, sterling recently shook hands with a 61.8% Fibonacci retracement ratio at 1.2718, situated a few pips south of the 2019 yearly opening level at 1.2739. Combined, this is impressive resistance. However, prudent traders will want to note trend line resistance, extended from the high 1.5930, in the event we spin off into another phase of buying this week. A rejection from current resistance, nevertheless, has plenty of room to manoeuvre until reaching Quasimodo support at 1.2163.
The 200-day SMA (orange – 1.2668) gave way Monday, floating underneath resistance plotted at 1.2769 and trend line resistance, taken from the high 1.3514. Although registering its eighth consecutive daily gain, resistance at 1.2769, owing to its history, could put a lid on gains. Initial support still resides at 1.2485.
Areas of consideration:
Weekly resistance making an appearance between 1.2718/1.2739 may cause longer-term sellers to make an appearance. Daily price, nonetheless, looks set to approach resistance at 1.2769.
Moves above 1.27 appear likely on H4, given the surrounding picture, though buying north of here is a challenge, as higher-timeframe technical structure suggests sellers inhabit the area between 1.2769/1.2718. Consequently, conservative sellers may wait until H4 price retakes 1.27 to the downside after testing higher-timeframe resistances, before pulling the trigger.
AUD/USD:
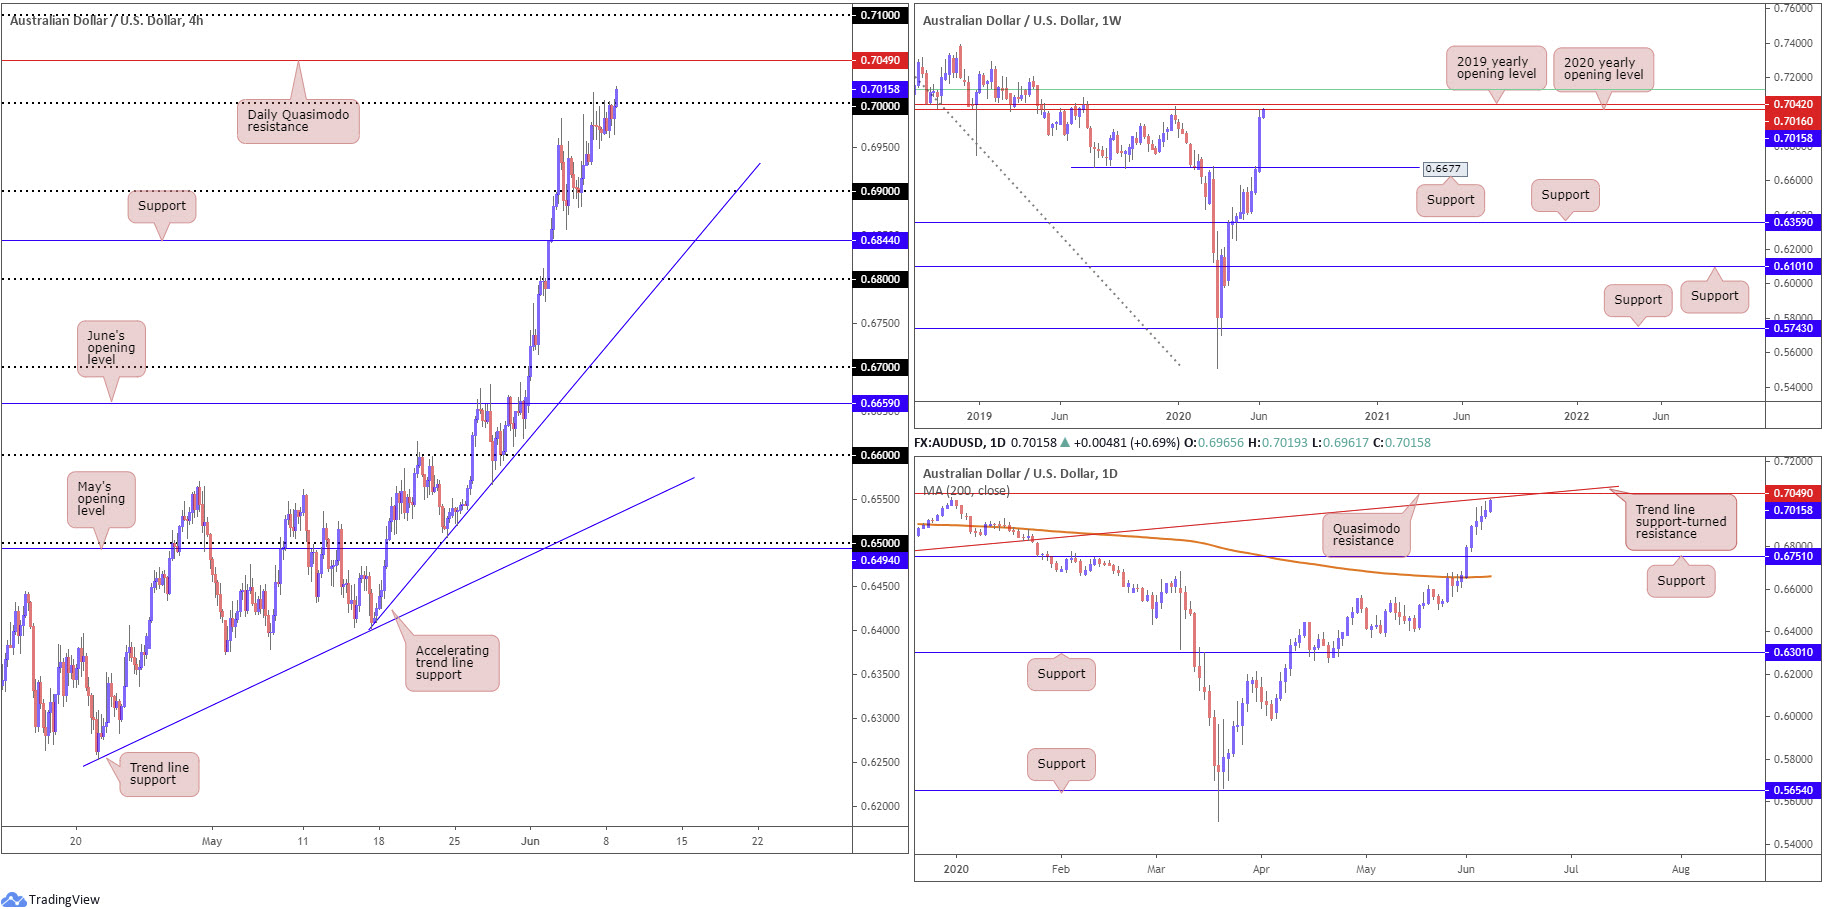
In recent hours, after a phase of unresponsive movement under the key figure 0.70, buyers regained consciousness and are making headway above the noted round number. Although this buying is in line with the current uptrend, recording its eighth consecutive move higher, higher-timeframe resistances may throw a spanner in the works here.
The weekly timeframe reveals price action to be testing the 2020 yearly opening level at 0.7016, sited a touch under the 2019 yearly opening level at 0.7042. What’s more, daily price is within striking distance of shaking hands with trend line support-turned resistance, taken from the low 0.6670, and a Quasimodo resistance seen nearby at 0.7049 (also marked on the H4 timeframe).
Areas of consideration:
Having noted higher-timeframe resistance positioned above the key figure 0.70 on the H4 timeframe highlights the possibility of a fakeout scenario unfolding. Protective stop-loss orders above 0.70 are currently being filled from those attempting to fade the figure, while buy-stops derived from breakout buyers are also being triggered. Combined, this provides ample liquidity for bigger players to sell from the higher-timeframe resistances.
Conservative sellers, though, are likely to wait and see if H4 can close back under 0.70 before engaging.
USD/JPY:
The US dollar wrapped up strongly lower against its Japanese counterpart Monday, snapping a four-day bullish phase. Yesterday’s descent appeared unfazed by upbeat risk sentiment, which tends to weigh on the Japanese yen.
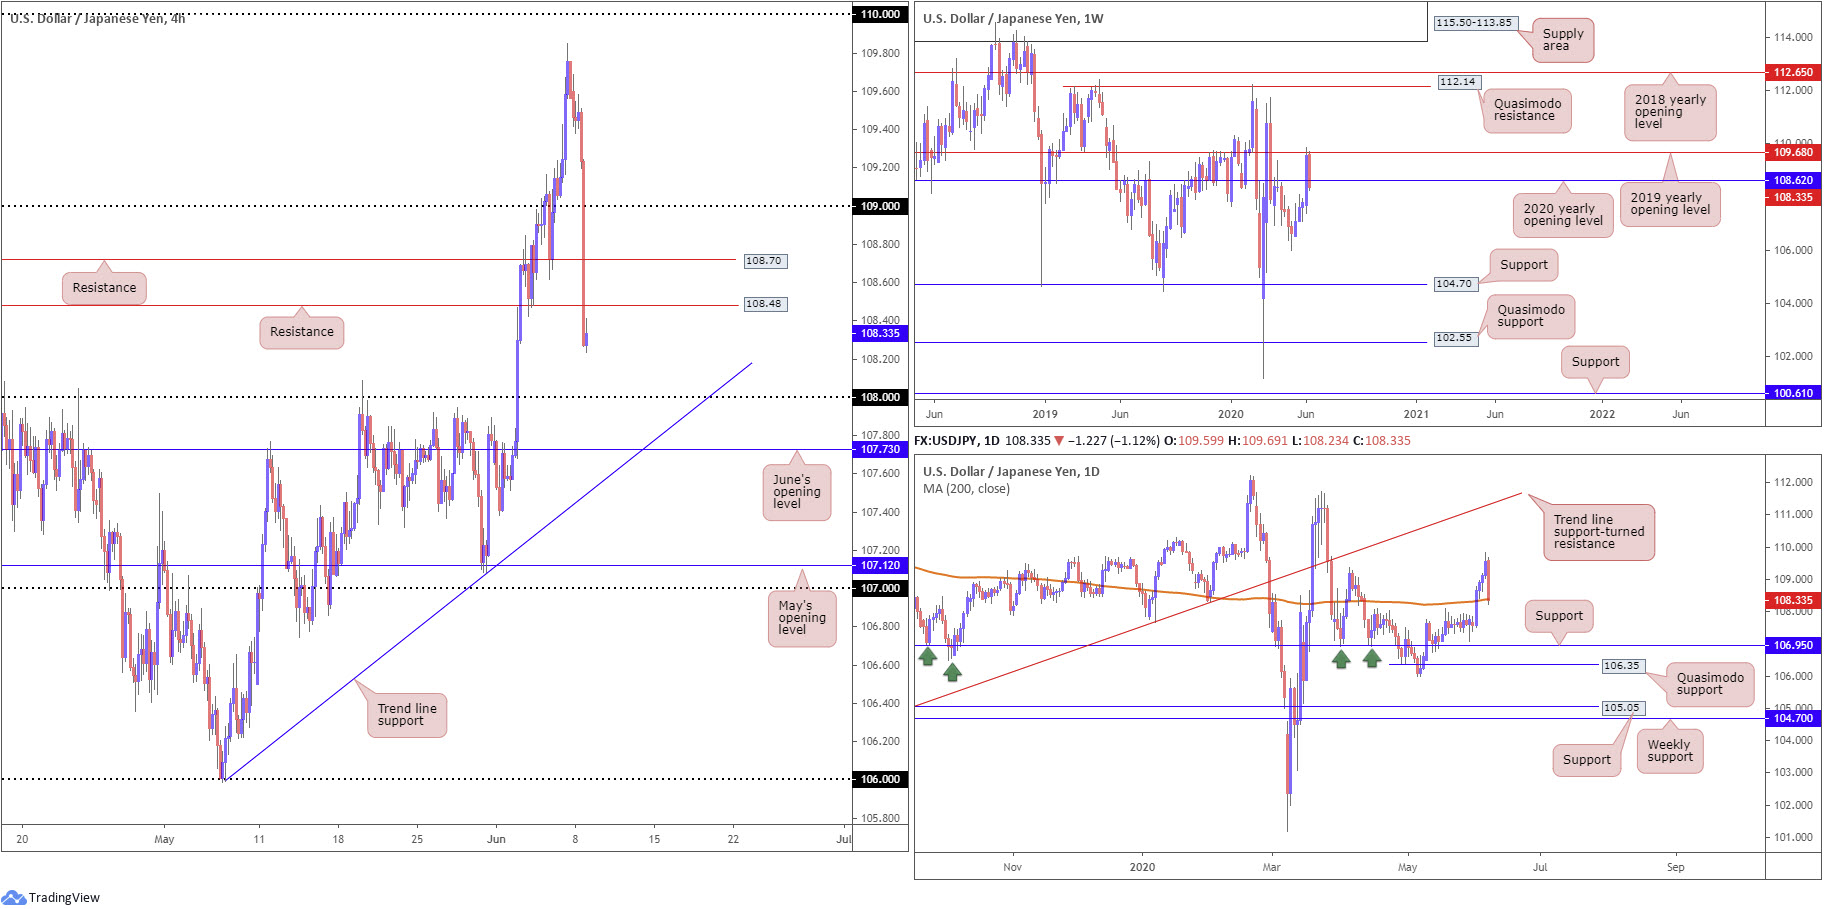
Down more than 1% and leaving behind Friday’s NFP-induced rally, H4 retreated from near three-month tops and tunnelled through a number of key technical supports, consequently unlocking the door to 108. A retest at 108.48 is certainly a possibility today – a prior Quasimodo resistance level – targeting 108. Having seen this round number cap upside on a number of occasions since mid-April, it’s likely we’ll see some support emerge from this barrier.
The 2019 yearly opening level at 109.68, based on the weekly timeframe, capped upside beautifully, sending buyers marginally back under the 2020 yearly opening level at 108.62. Territory beneath 108.62 has the 105.98 6th May low to target. The story on the daily timeframe, nonetheless, has price action crossing swords with the 200-day SMA (orange – 108.38), with a break exposing support coming in at 106.95.
Areas of consideration:
Monday’s weekly technical briefing underlined the following:
The 2019 yearly opening level at 109.68 may hamper upside this week, stinging breakout buyers above the 109.38 April 6 high and frustrating traders wanting to short 1.10.
H4 shows price ended the week producing a notable bearish candlestick formation under 1.10, closing at its lows. Given weekly resistance, along with fuel provided from breakout buy orders above 109.38 (liquidity to sell into), a retreat could be thrown in the pot early trade.
Well done to any traders who managed to take advantage of recent moves.
Going forward, short plays off 108.48 are possible, though buyers off the 200-day SMA could be too much for sellers to contend with here. Therefore, a cautionary stance is necessary.
USD/CAD:
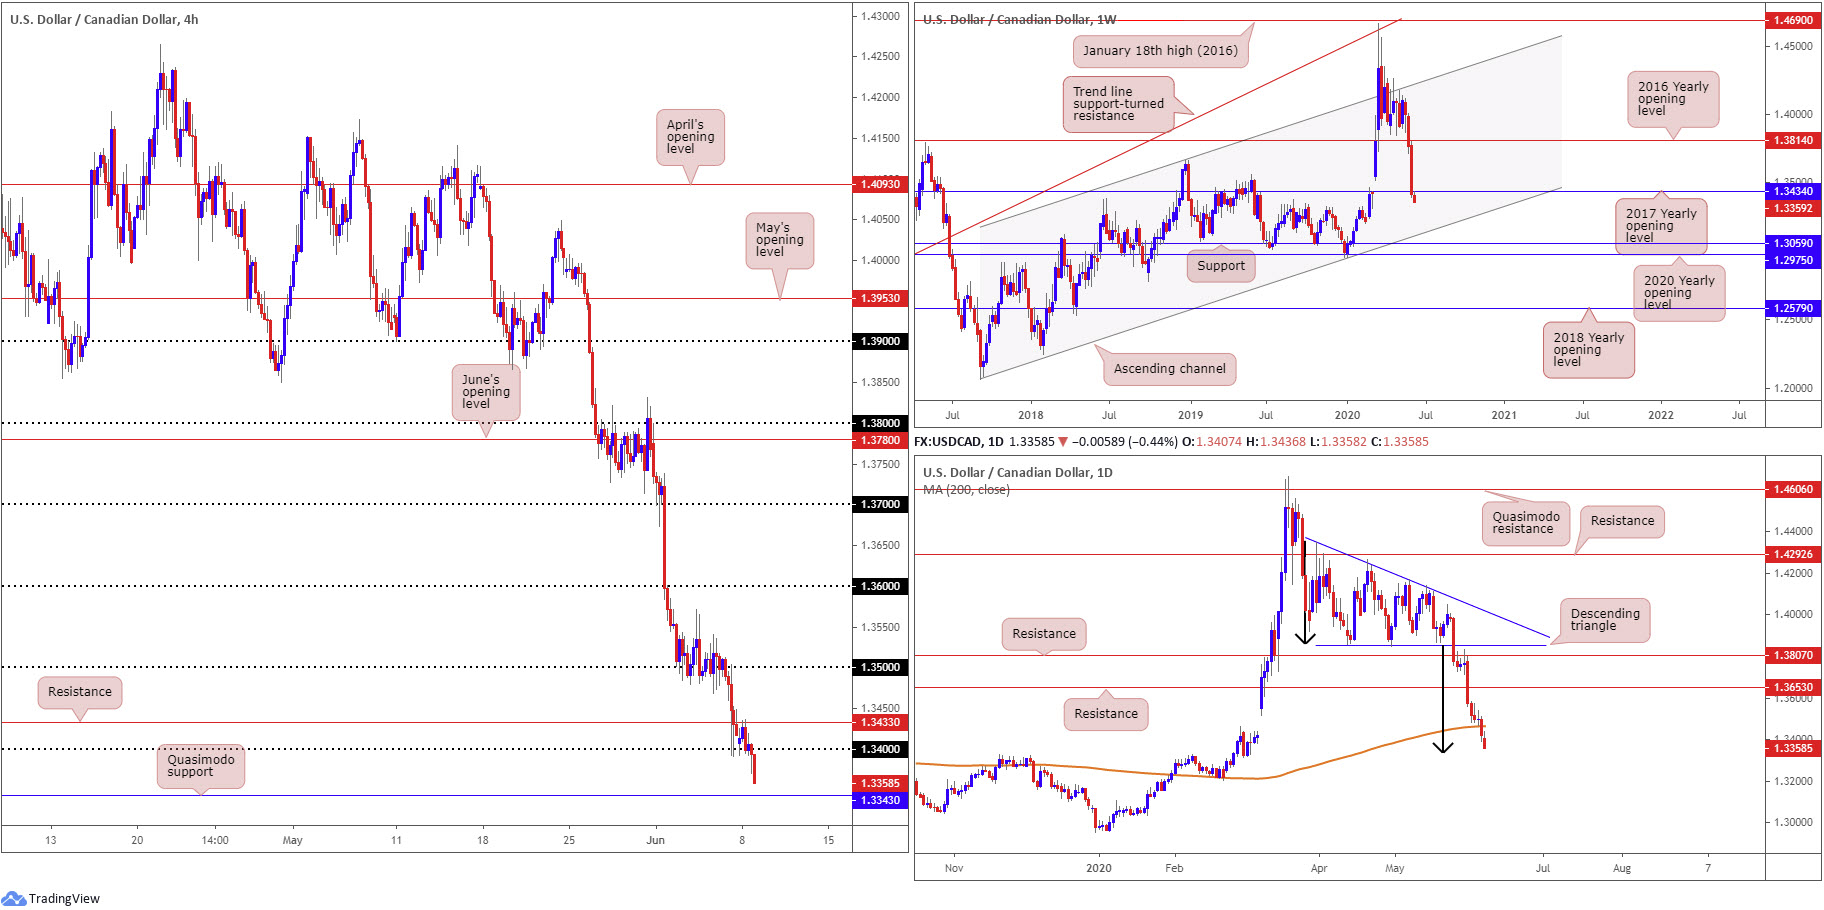
Despite WTI dropping 2%, USD/CAD appears to have followed the DXY lower Monday, respecting the underside of H4 resistance at 1.3433 and reclaiming 1.34 to the downside, subsequently drawing H4 Quasimodo support at 1.3343 into the realm of possibility today.
The higher timeframes reveal weekly price attempting to overthrow the 2017 yearly opening level at 1.3434, which if it comes to pass, channel support, extended from the low 1.2061, may enter the frame.
On the daily timeframe, the beginning of April began the process of carving out a descending triangle pattern between 1.4349 and 1.3855. As evident from the chart, after breaking the lower boundary along with nearby support at 1.3807, we’ve since witnessed price tunnel through a number of key supports, including the 200-day SMA (orange – 1.3464). This places the descending triangle’s take-profit base at 1.3332 (black arrows) on the radar.
Areas of consideration:
Continued downside has support forming between H4 Quasimodo support at 1.3343 and the daily descending triangle’s take-profit base at 1.3332. Traders may, therefore, witness a bounce from here. This is backed by the threat of buying still developing off the 2017 yearly opening level at 1.3434 on the weekly timeframe. As such, selling this market could be a chancy endeavour, despite the current trend favouring as such.
USD/CHF:
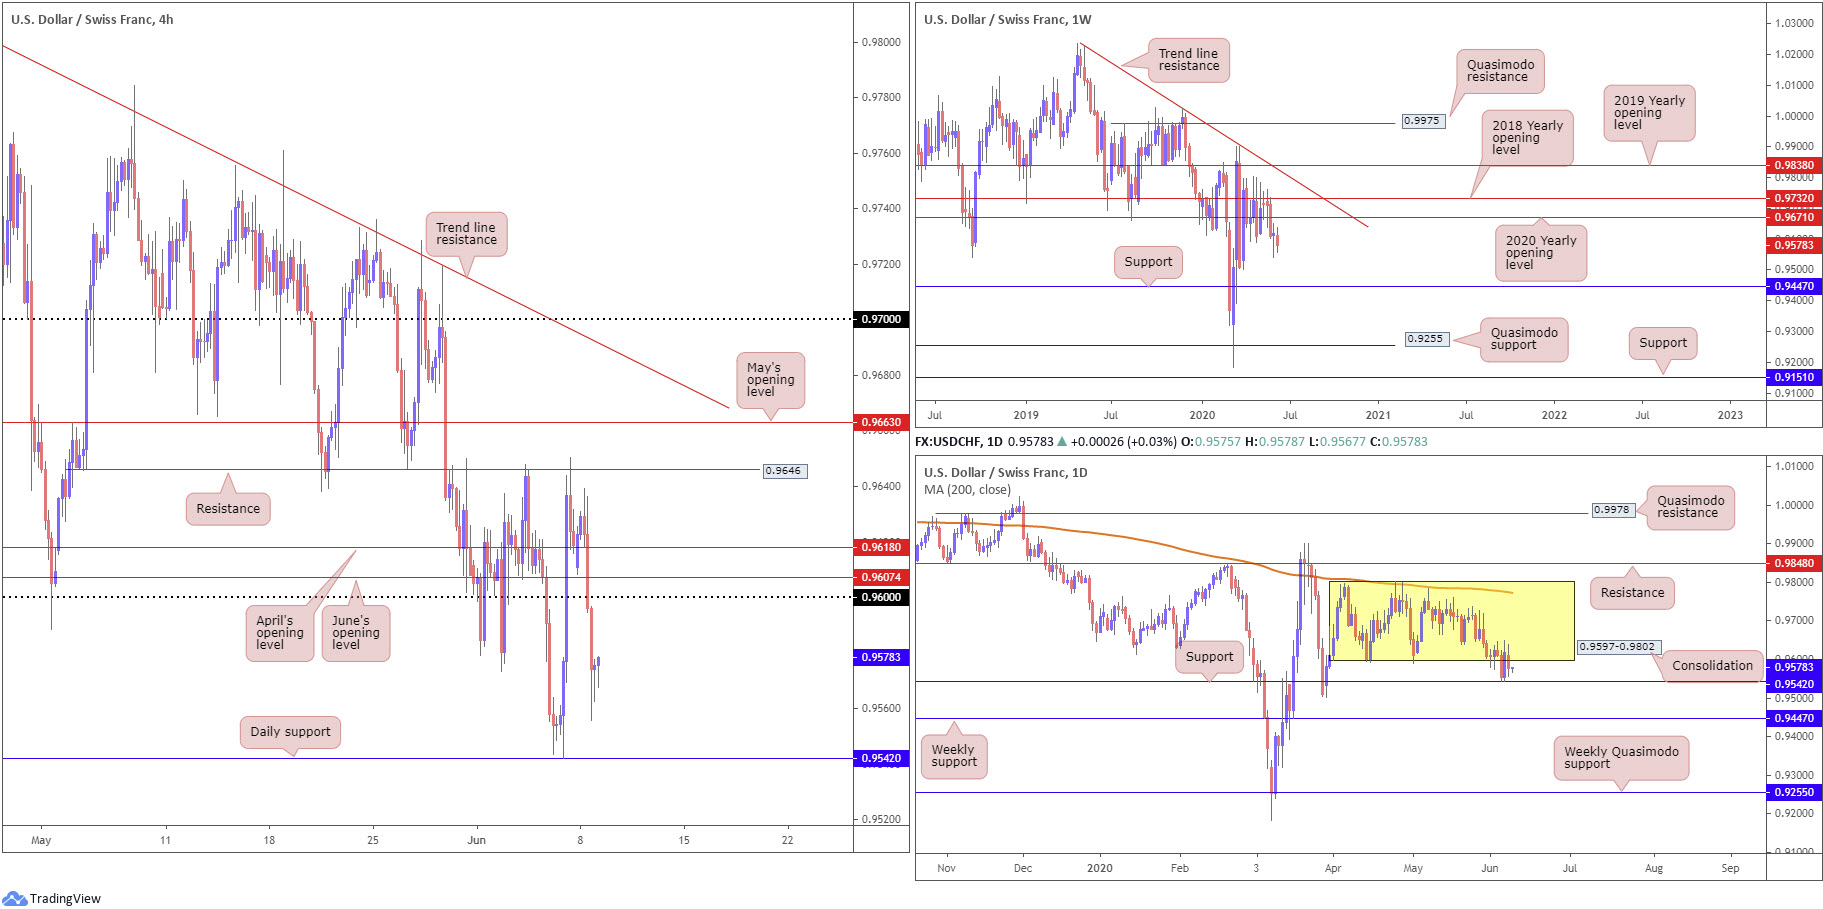
Demand for safe-haven currencies took hold Monday, a surprising move given Friday’s US payrolls beat and US equities closing positively across the board. H4 price is now circling near Friday’s session lows at 0.9542, with a break here threatening a continuation move to the 0.95 handle.
Meanwhile, on the weekly timeframe we have price movement languishing south of the 2020 yearly opening level at 0.9671. This leaves the pair exposed to either a possible retest scenario at 0.9671, or additional selling to support at 0.9447.
Since early April, price action on the daily timeframe has consolidated between 0.9802/0.9597. Interestingly, the lower boundary came under fire into the tail end of last week, forged in the shape of a 2-candle fakeout off nearby support from 0.9542. As you can see, little emerged from this in the form of additional buying on Monday.
Areas of consideration:
Weekly price hints at lower levels, according to its current position. Daily sellers, however, must contend with support at 0.9542 before nudging lower, consequently clearing the path to weekly support at 0.9447.
Intraday shorts under 0.9542 are an option to 0.95. Alternatively, sellers may favour a retest at the area made up of April’s opening level at 0.9618 and the 0.96 handle on the H4 timeframe.
Dow Jones Industrial Average:
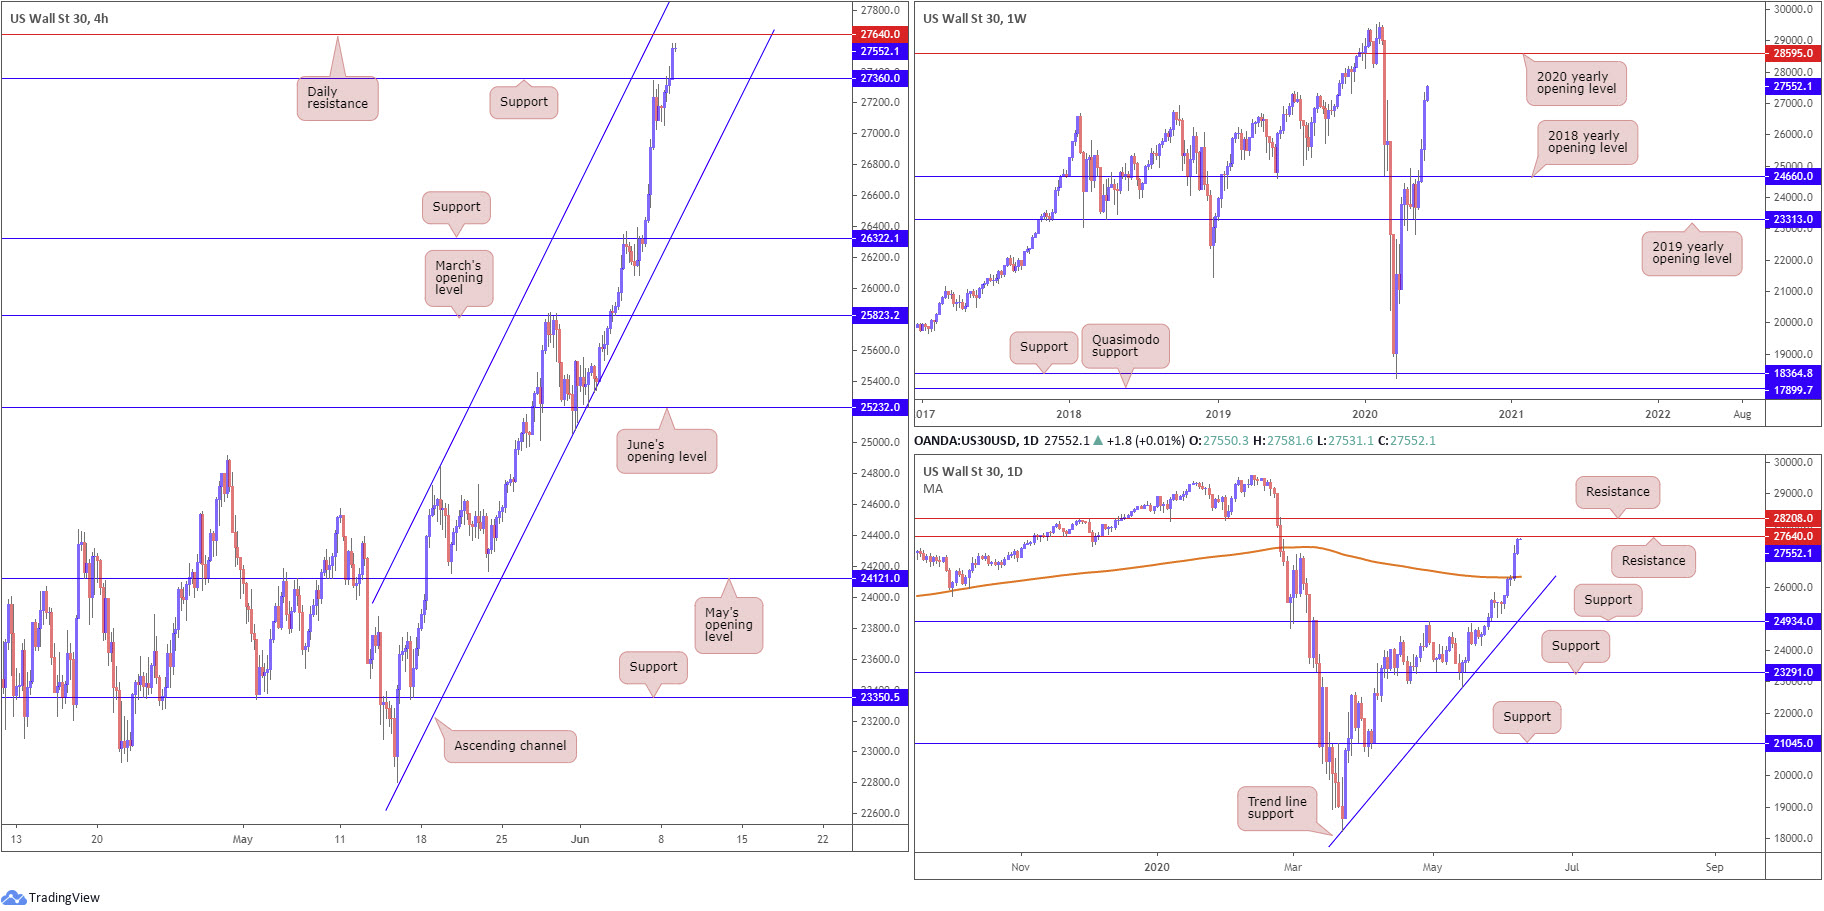
US equities kicked off the week in fine form, finishing Monday around all-time highs as easing lockdowns sparked optimism. The Dow Jones Industrial Average climbed 461.46 points, or +1.7%; the S&P 500 rallied 38.46 points, or 1.2%, and the tech-heavy Nasdaq 100 concluded higher by 77.13 points, or 0.79%.
From the weekly timeframe this morning, traders can see the 2020 yearly opening level at 28595 is, following three consecutive weeks of healthy gains, now within touching distance, followed by all-time peaks at 29595.
Elsewhere, daily movement, after moving through its 200-day SMA (orange – 26355) is nearing resistance drawn from 27640, closely shadowed by another layer of resistance fixed at 28208. Combined, these two levels could put a lid on gains.
On the H4 timeframe, we recently elbowed through Quasimodo resistance (now a serving support), and have the daily resistance mentioned above at 27640 in sight, followed by channel resistance, extended from the high 24849.
Areas of consideration:
A rejection off daily resistance at 27640 may be enough to generate a retest at H4 support taken from 27360 for potential buying opportunities. The reason we do not expect price to push through 27360 is simply due to the strong uptrend, which ultimately has the 2020 yearly opening level on the radar at 28595 as an upside target.
XAU/USD (GOLD):
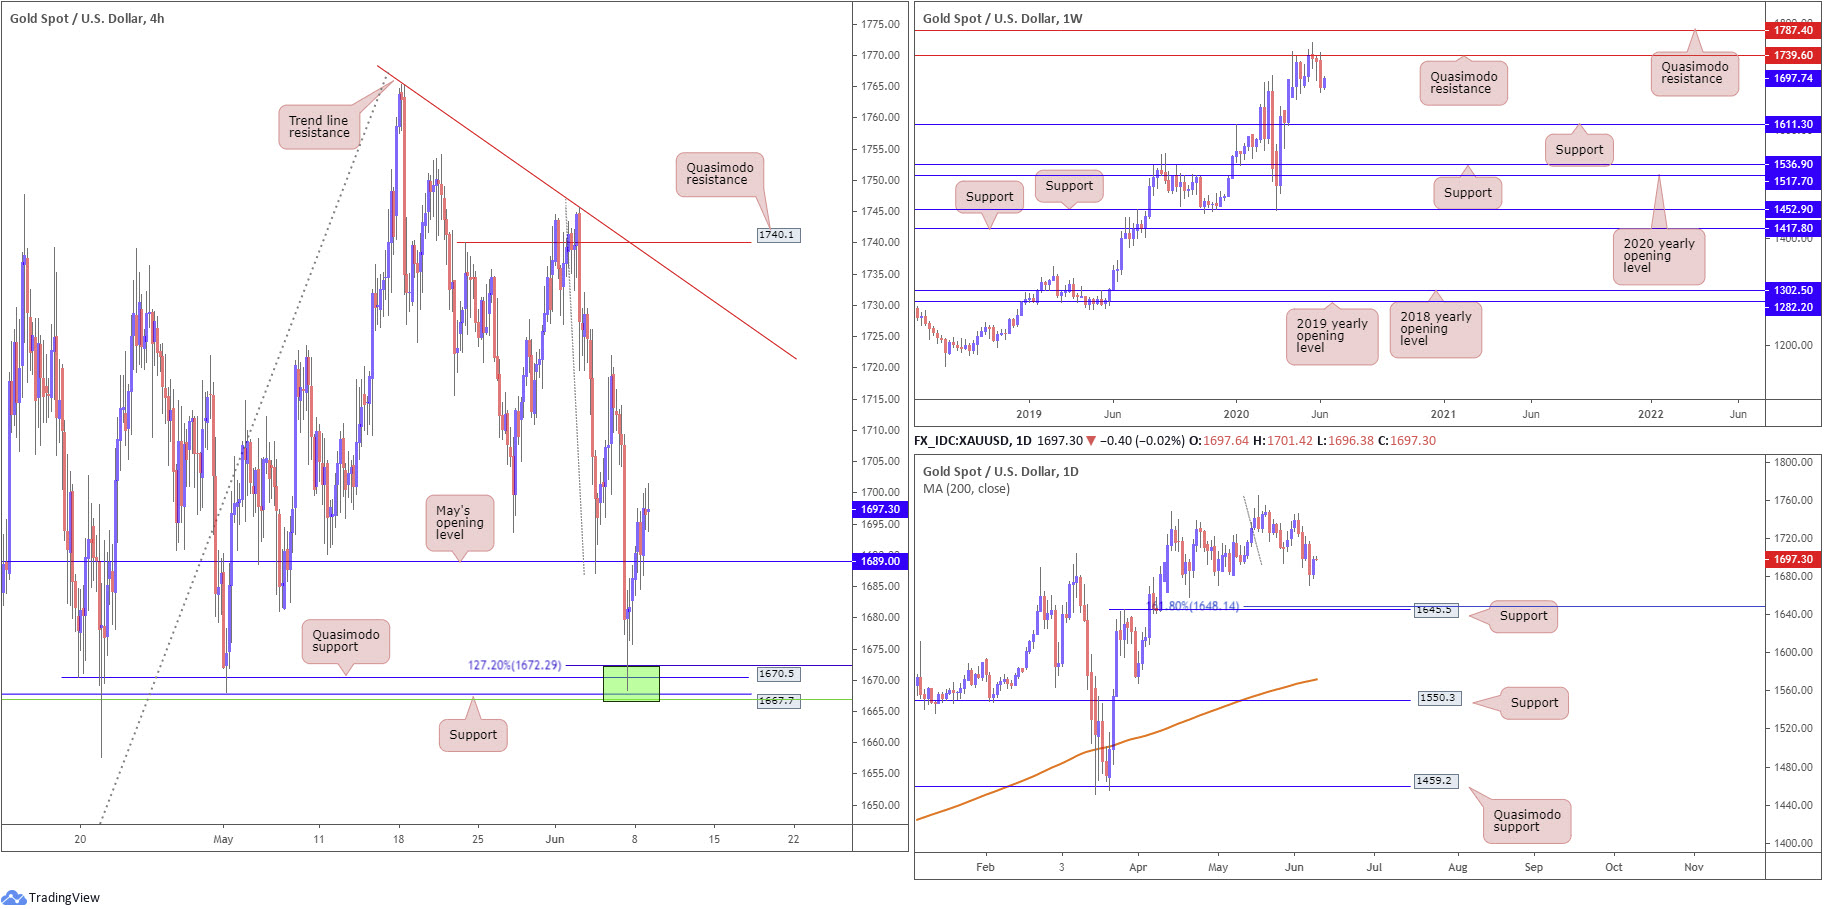
XAU/USD spot price staged a modest comeback Monday, following Friday’s plunge on the back of US non-farm payrolls data. The situation on the H4 timeframe observed a close form above May’s opening level at 1689.0, which exhibited support after a swift retest. This follows Friday’s mild end-of-day recovery out of 1666.8/1672.2 (green), made up of a Quasimodo formation from 1670.5, a support at 1667.7, a 127.2% Fibonacci extension at 1672.2 and a 50.0% retracement ratio at 1666.8 (green line). Holding north of 1689.0 has, aside from the 1722.0 June 4 high, trend line resistance, taken from the high 1765.1, to target.
Shaped by way of a bearish outside pattern, weekly buyers, once again, lost their flavour under Quasimodo resistance at 1739.6 last week, capped since mid-April. Clearance of 1739.6 underlines another Quasimodo resistance at 1787.4, while downside has support in view at 1611.3. It may also interest some traders to note the trend on gold has faced a northerly trajectory since 2016.
Despite Monday welcoming a recovery, bullion appears to be starved of support on the daily timeframe until reaching 1645.5, a level drawing a close connection to a 161.8% Fibonacci extension point at 1648.1.
Areas of consideration:
With both weekly and daily structure perhaps directing candles to lower levels, it’s questionable how long H4 price can hold north of May’s opening level at 1689.0. That’s not to say we cannot reach H4 trend line resistance, however. As such, intraday bearish strategies may be something to consider either under 1689.0 or 1666.8/1672.2, should we push lower.
Alternatively, given the strong uptrend, should we retest 1689.0 as support for a second time and hold, preferably in the shape of a H4 bullish candlestick pattern, this could be enough to convince traders we may have sufficient fuel left in the tank to reach higher levels.
The accuracy, completeness and timeliness of the information contained on this site cannot be guaranteed. IC Markets does not warranty, guarantee or make any representations, or assume any liability regarding financial results based on the use of the information in the site.
News, views, opinions, recommendations and other information obtained from sources outside of www.icmarkets.com.au, used in this site are believed to be reliable, but we cannot guarantee their accuracy or completeness. All such information is subject to change at any time without notice. IC Markets assumes no responsibility for the content of any linked site.
The fact that such links may exist does not indicate approval or endorsement of any material contained on any linked site. IC Markets is not liable for any harm caused by the transmission, through accessing the services or information on this site, of a computer virus, or other computer code or programming device that might be used to access, delete, damage, disable, disrupt or otherwise impede in any manner, the operation of the site or of any user’s software, hardware, data or property.


