
Key risk events today:
Limited.
(Previous analysis as well as outside sources – italics).
EUR/USD:
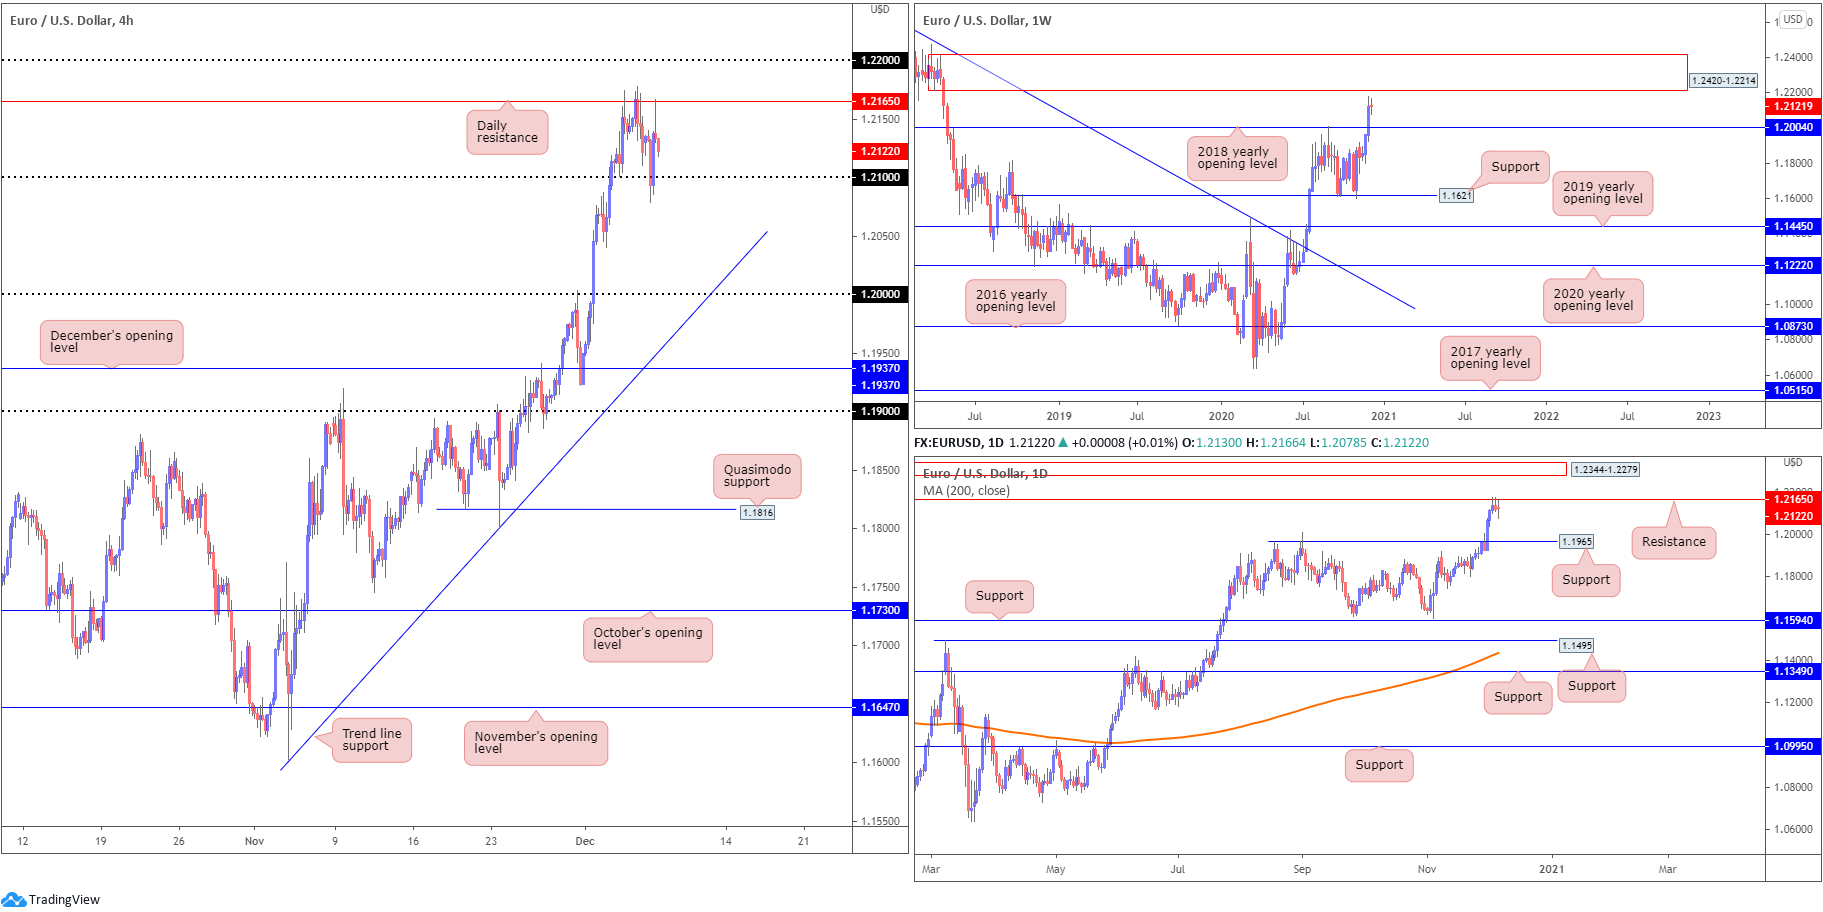
Monday had EUR/USD dip through 1.21 to test lows at 1.2078 on the H4, likely tripping sell-stops. A short-lived rebound, as you can see, triggered a run back to daily resistance at 1.2165, forming a H4 shooting star candle pattern. Above daily resistance, the 1.22 handle resides close by, while overthrowing 1.21 turns the radar back to the key figure 1.20 and a H4 trend line support, extended from the low 1.1602.
From the weekly scale, we can see the unit rallied more than 150 pips and tested fresh YTD peaks last week. Underpinned on the back of USD softness, the technical picture on the weekly chart reveals the pair overwhelmed the 2018 yearly opening value at 1.2004, drawing out supply at 1.2420-1.2214. In terms of trend, it seems upside remains favoured, more so if price overthrows the 1.2555 February 12 high (2018). The above implies buyers may remain at the wheel until testing the aforementioned supply zone.
Before reaching weekly supply, buyers must contend with daily resistance at 1.2165.
1.2165 made an appearance into the second half of last week and produced back-to-back shooting star candles (bearish signals). Despite this, Monday offered little in terms of downside. A solid rejection from here, however, shines the spotlight on support at 1.1965, a previous Quasimodo resistance. A 1.2165 breach, on the other hand, swings the pendulum in favour of a run to supply drawn from 1.2344-1.2279 (sited within the parapets of current weekly supply).
Areas of consideration:
- The uptrend remains in a healthy state, seen clearly from both the weekly and daily timeframes.
- Daily resistance (1.2165) is a level to be mindful of, though given H4 buyers defended 1.21 on Monday, buyers could take control today and perhaps make a run for 1.22.
- 22 is a significant barrier, one which could entice sellers. A mild fakeout above the level, a whipsaw that not only taps into any buy-stop liquidity above 1.22 but also tests the underside of weekly supply at 1.2214, unlocks the possibility of fresh sellers making an appearance.
GBP/USD:
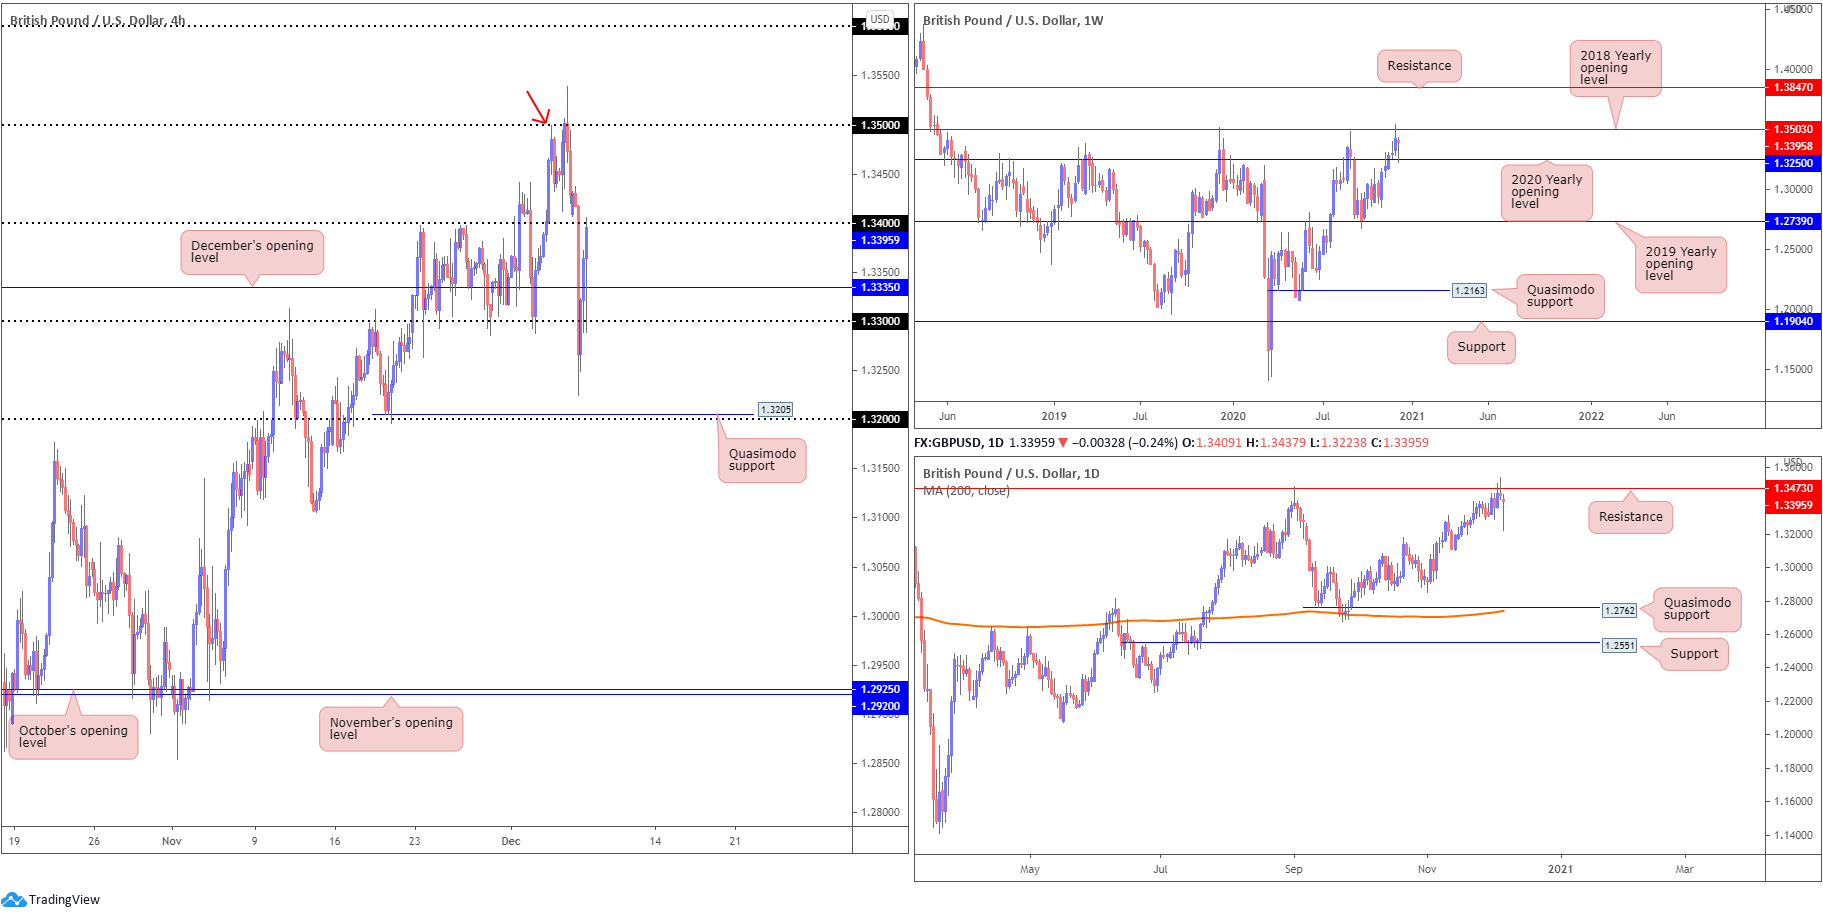
Ranging between 1.3437/1.3223, GBP/USD experienced notable volatility Monday amid a slew of Brexit-related headlines.
Sell-stops south of the 1.33 handle were annihilated on the H4 scale, dropping to lows ahead of the 1.32 level and H4 Quasimodo support at 1.3205. The spirited recovery witnessed going into US hours, however, reclaimed 1.33+ status and also regained December’s opening value at 1.3335. 1.34 and 1.35 rest as logical upside targets, with the latter merging with a Quasimodo resistance level (red arrow).
From the weekly timeframe, five weeks of buying set aside the 2020 yearly opening value at 1.3250 and shook hands with the 2018 yearly opening value at 1.3503. Note Monday retested 1.3250 as support. A break of 1.3503 could send price as far north as resistance plotted at 1.3847. Similar to EUR/USD, GBP/USD also managed to eke out fresh YTD highs last week, with the immediate trend pulling to the upside since March troughs at 1.1409.
The daily chart, as you can see, provides a magnified view of the current uptrend. The chart also parades resistance at 1.3473, joining the fight last Thursday with price establishing a shooting star candle pattern Friday (bearish signal). Territory above the aforementioned resistance shows space for buyers to perhaps push as far north as resistance at 1.3763.
Areas of consideration:
- 34 is a resistance to be aware of, following the formation of the lower low at 1.3224.
- The 1.35 region remains interesting resistance, merging closely with weekly resistance at 1.3503 and daily resistance found at 1.3473.
- The trend remains to the upside, therefore a close forming north of 1.35 could activate breakout bullish scenarios, targeting at least 1.36.
AUD/USD:
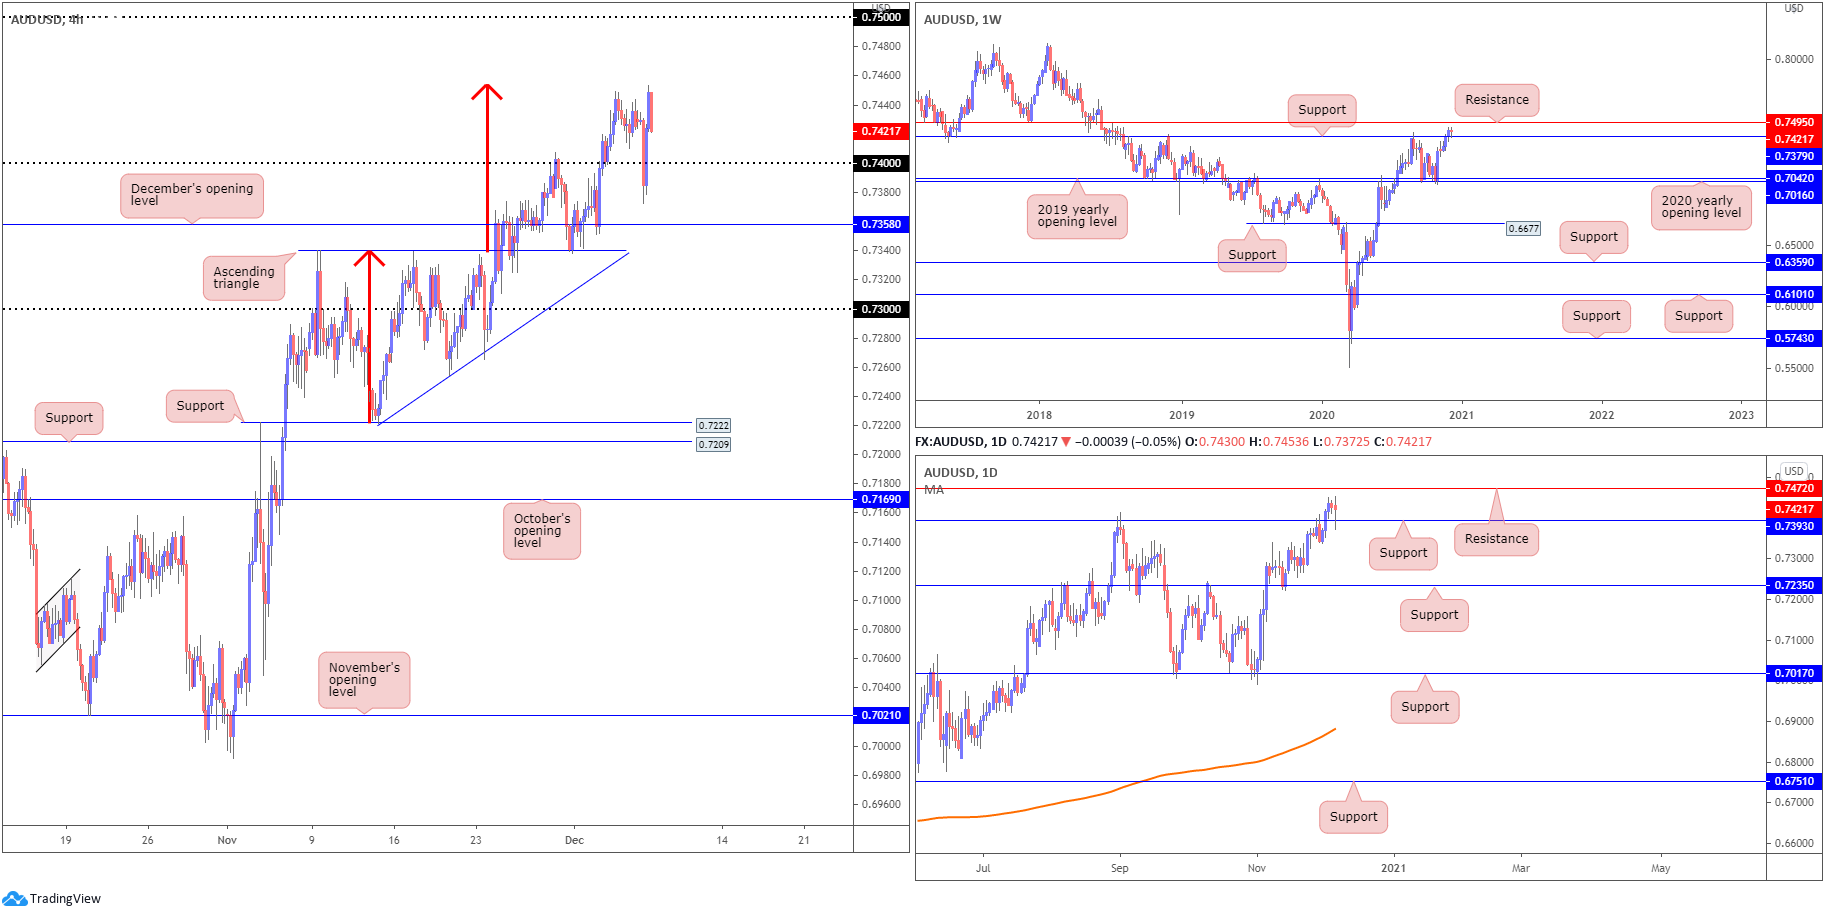
Following a rather rigorous whipsaw through orders at 0.74, movement that scraped lows at 0.7372, AUD/USD bulls entered an offensive phase Monday and refreshed YTD pinnacles.
For those who read Monday’s technical briefing you may recall the following (italics):
Recent trade retested 0.7340, the upper boundary of a H4 ascending triangle pattern, and challenged the underside of the 0.74 handle. Above, traders may be looking towards the ascending triangle take-profit target (red arrows) at 0.7453.
With latest action holding north of 0.74, buyers are seen closing in on the ascending triangle take-profit target.
From the weekly timeframe:
After retesting the 2020 (0.7016) and 2019 (0.7042) yearly opening values (supports) in early November, last week established a third consecutive weekly gain and climbed resistance at 0.7379, registering fresh YTD highs. This week so far has also seen 0.7379 retested as support. In view of this market trending higher since early 2020, buyers may also be eyeballing resistance parked at 0.7495.
In similar fashion to the weekly timeframe, price action on the daily timeframe bumped through resistance at 0.7393 during mid-week trading and retested the latter as support on Monday. This likely has traders’ crosshairs focused on resistance at 0.7472, sited just beneath weekly resistance at 0.7495.
Areas of consideration:
Outlook mostly unchanged.
- Buyers long the ascending triangle support at 0.7340 likely reduced risk at 0.74 with many now eyeing 0.7453 as an initial take-profit region. Daily price demonstrating scope to approach resistance at 0.7472, together with weekly price honing in on resistance from 0.7495, shows buyers may push beyond 0.7453 in favour of higher timeframe resistances.
USD/JPY:
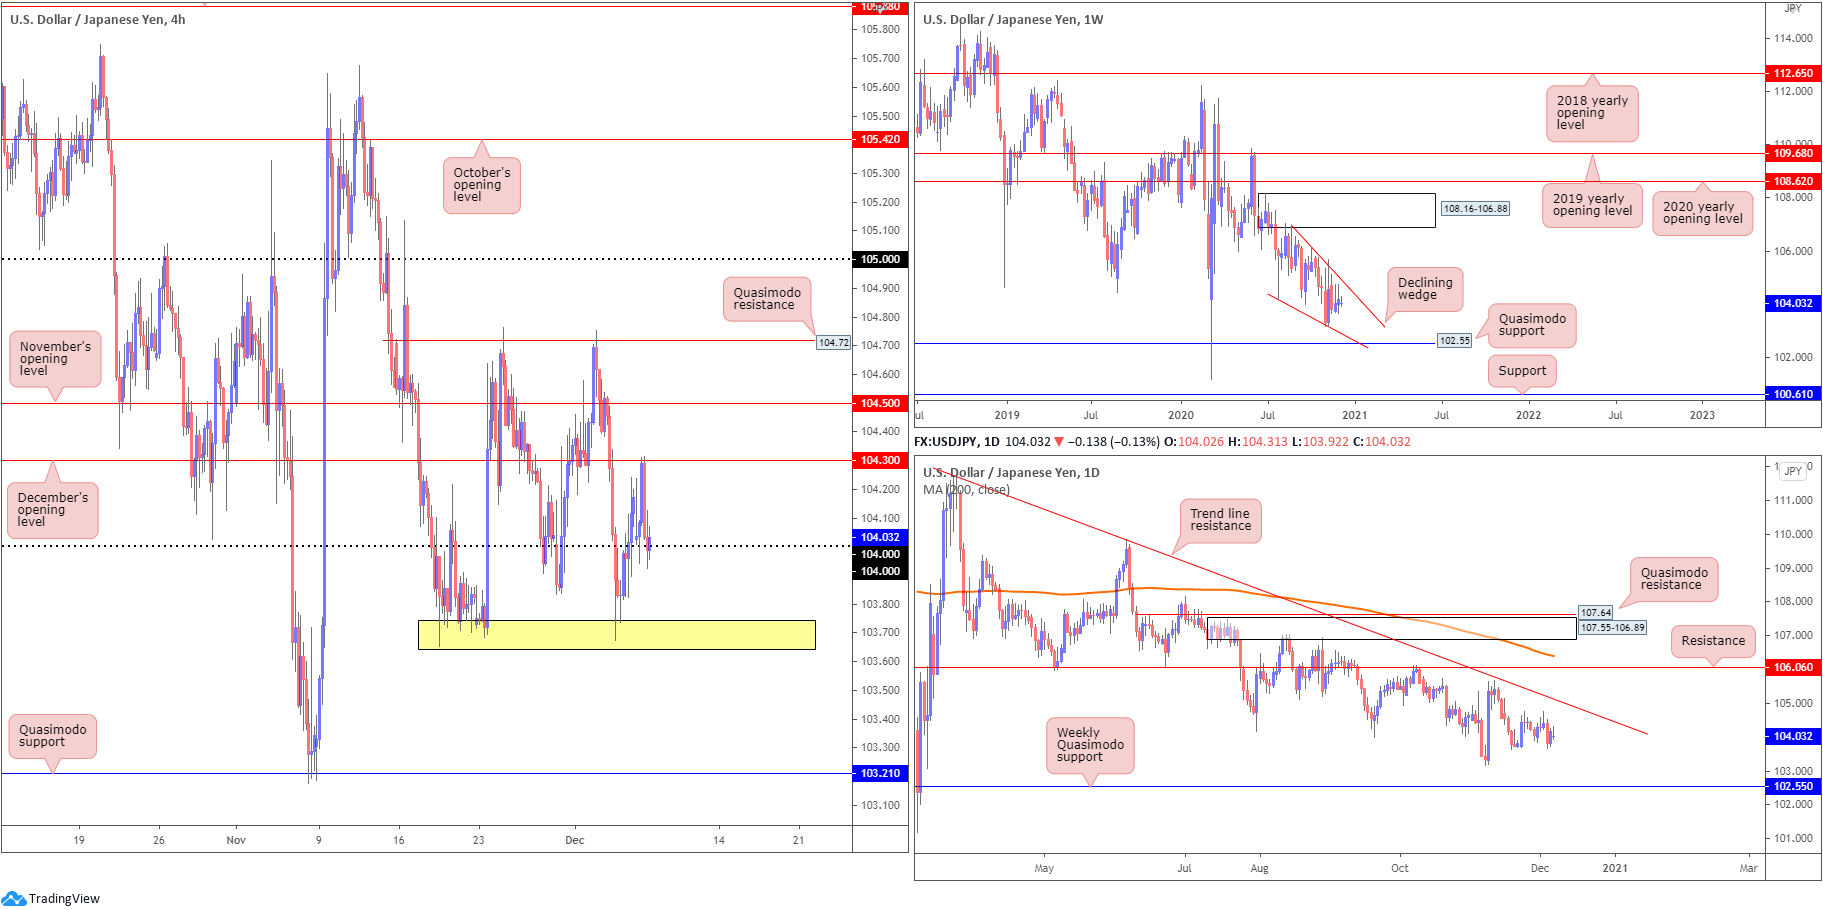
After a fleeting 104 visit on the H4 scale Monday, buyers aggressively pushed for December’s opening value at 104.30 to which sellers responded equally aggressively and retested 104. The plot of support around 103.70 (yellow) remains important, as do resistances around November’s opening value priced in at 104.50 and the Quasimodo resistance at 104.72.
The weekly timeframe’s structure remains unchanged (italics):
Since connecting with the underside of supply at 108.16-106.88 in August, price has gradually shifted lower and developed a declining wedge (106.94/104.18).
Quasimodo support at 102.55 is also in the picture, with a break revealing support plotted at 100.61. A strong bounce from 102.55 may provide enough impetus for buyers to attempt a breakout above the current declining wedge.
Daily timeframe’s picture also remains unchanged (italics):
The technical landscape from the daily timeframe reveals scope to close in on trend line resistance, extended from the high 111.71. Sellers taking over, however, could lead price to the 103.17 November 6 low, followed by the noted weekly Quasimodo support at 102.55.
Areas of consideration:
- 104 may remain interesting support, as might support around 103.70 on the H4 scale. Upside targets north of 104 stands at 104.30/104.50/104.72.
- Removing H4 support around 103.70 moves H4 Quasimodo support at 103.21 on to the radar as a possible downside objective for intraday bearish scenarios.
The accuracy, completeness and timeliness of the information contained on this site cannot be guaranteed. IC Markets does not warranty, guarantee or make any representations, or assume any liability regarding financial results based on the use of the information in the site.
News, views, opinions, recommendations and other information obtained from sources outside of www.icmarkets.com.au, used in this site are believed to be reliable, but we cannot guarantee their accuracy or completeness. All such information is subject to change at any time without notice. IC Markets assumes no responsibility for the content of any linked site.
The fact that such links may exist does not indicate approval or endorsement of any material contained on any linked site. IC Markets is not liable for any harm caused by the transmission, through accessing the services or information on this site, of a computer virus, or other computer code or programming device that might be used to access, delete, damage, disable, disrupt or otherwise impede in any manner, the operation of the site or of any user’s software, hardware, data or property


