
Key risk events today:
RBA Cash Rate and Rate Statement; FOMC Member Bullard Speaks.
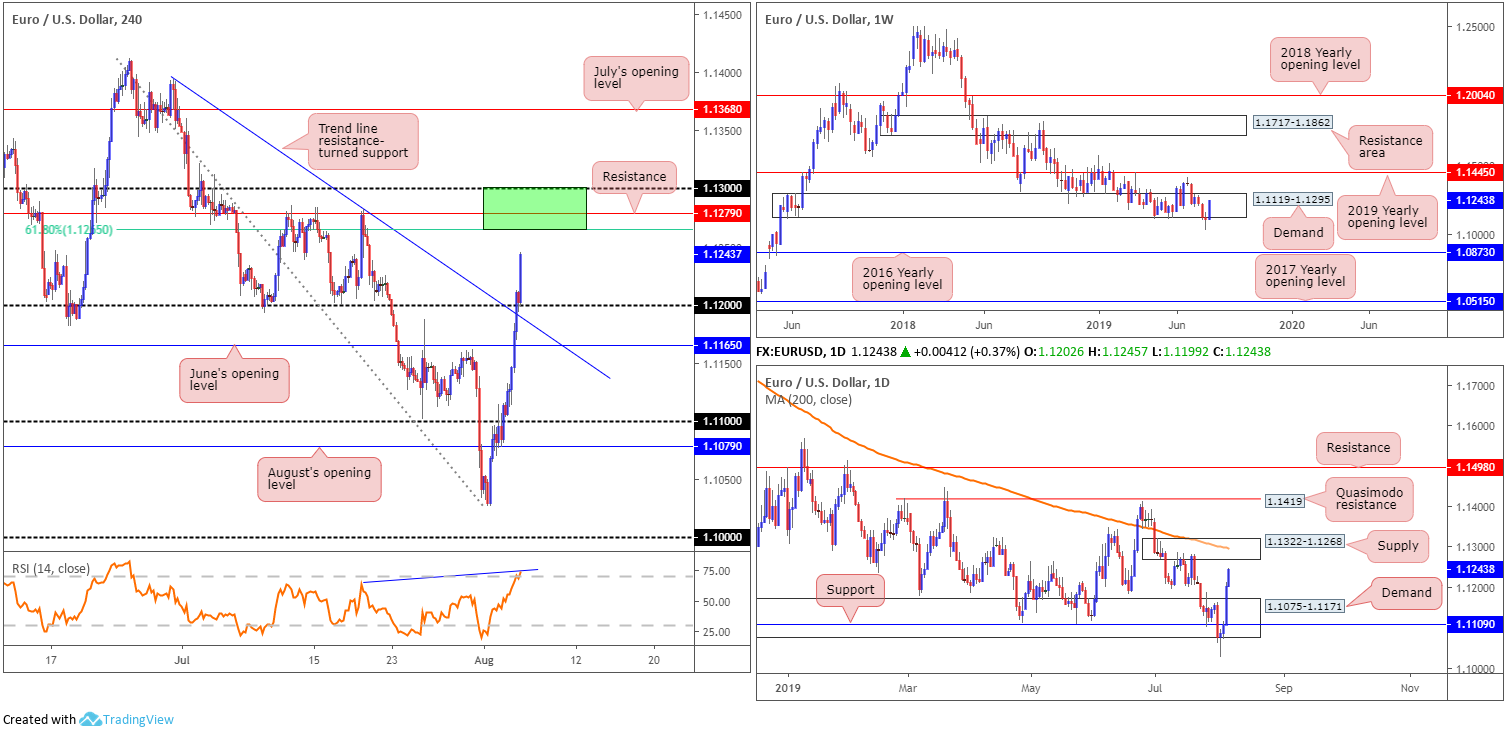
EUR/USD:
Europe’s single currency, a clear outperformer within the G10 space, advanced 0.87% vs. the buck Monday amid risk-off trade following the yuan depreciating to 7 against the greenback, a level not seen since 2008. The measure was taken as retaliation against the latest round of tariffs announced by US President Trump. In addition to this, US non-manufacturing ISM fell to a three-year low, falling to 53.7 from 55.1; the data suggests that the downturn seen in manufacturing is now spreading into the larger services sector.
In terms of the technical picture, the H4 candles recently reclaimed 1.12+ status and theoretically set the stage for further upside towards resistance coming in at 1.1279, closely followed by 1.13. It might also be worth noting we have a 61.8% Fibonacci resistance value lurking just beneath the two levels at 1.1265, and the RSI indicator currently pencilling in hidden divergence within overbought territory (blue line).
On a wider perspective, despite clocking multi-year lows of 1.1026 last week, long-standing weekly demand at 1.1119-1.1295 remains in motion. Continued bidding from this region has the 2019 yearly opening level at 1.1445 to target. Daily action, on the other hand, is seen fast approaching supply drawn from 1.1322-1.1268 which intersects with a 200-day SMA (orange).
Areas of consideration:
Although weekly price proposes additional buying, considerable resistance is visible on H4 and daily timeframes. Traders, therefore, can expect sellers to make an appearance within the green H4 zone at 1.13/1.1265. Whether this, along with daily supply mentioned above at 1.1322-1.1268, is sufficient to send prices to 1.12 is difficult to judge. For that reason, it might be worth considering waiting and seeing if H4 price chalks up a bearish candlestick signal (entry/risk can be set according to this structure) before pulling the trigger.
GBP/USD:
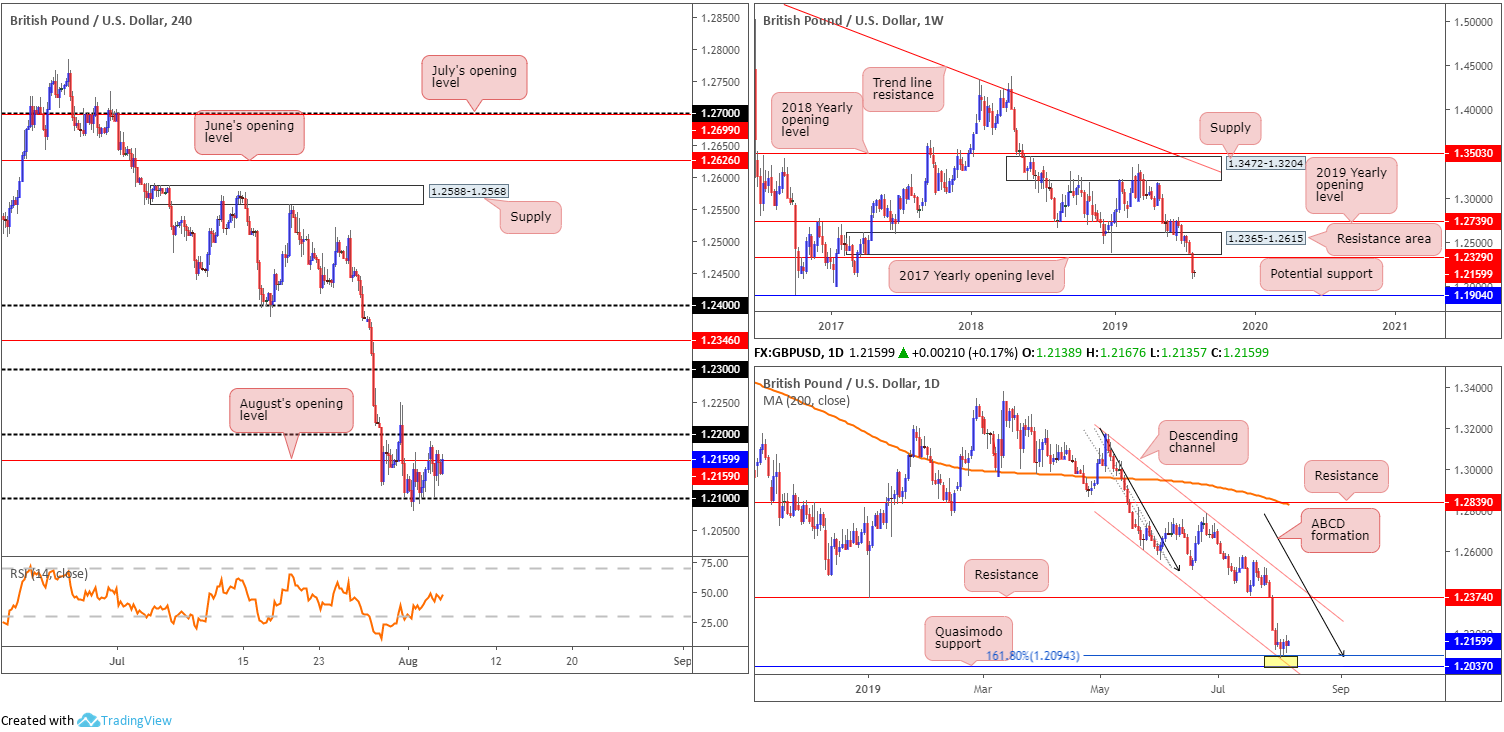
Risk sentiment was hit Monday following China’s PBoC allowing the yuan to trade above the psychological 7.00 mark for the first time since 2008, consequently resulting in flows into safe-haven assets. The greenback fell sharply amid mounting trade tensions, and despite UK Markit services PMI improving to 51.4 in July, Brexit woes limited upside in GBP markets.
In light of Monday’s lacklustre performance, much of the following analysis will air similar thoughts put forward in Monday’s briefing.
From the weekly timeframe:
Since retesting the underside of the 2019 yearly opening level at 1.2739 in May, the British pound has been grinding lower against its US counterpart. Tunnelling through bids residing within long-standing demand at 1.2365-1.2615 and eventually overthrowing the 2017 yearly opening level at 1.2329, longer-term flow is exposed to further downside this week, targeting potential support from 1.1904: a standout low clocked in early October 2016.
The daily timeframe:
Contrary to the weekly timeframe’s estimation, daily movement is bottoming around the top edge of a rather interesting support zone between 1.2037/1.2094. Comprised of a 161.8% ABCD (black arrows) pattern at 1.2094, a channel support extended from the low 1.2605 and a Quasimodo support at 1.2037, does this area possess enough oomph to send price towards resistance at 1.2374 this week?
The H4 timeframe:
As of current price, the H4 candles are ranging between psychological marks 1.22 and 1.21, with the RSI indicator touching the underside of its mid-point value (50.0). What’s also notable is in between the two round numbers we have August’s opening level at 1.2159.
Areas of consideration:
Weekly price portends further downside this week, while daily price reveals a clear-cut support area at 1.2037/1.2094. In cases such as this, it’s always best to plot the H4 position. For example, a break of 1.22 to the upside confirms bullish strength not only on the H4 timeframe, but also on the daily timeframe, and, therefore, may make a run to 1.23. As such, a long entry either on the breakout or retest at 1.22 is an option.
A break of 1.12, nonetheless, implies weakness within the daily support area and strength on the weekly timeframe. Traders can then expect a possible run towards 1.1904 on the weekly scale.
For traders still long from 1.21, specifically the H4 bullish engulfing candle, there’s little you can do at the moment except wait for a move to take shape.
AUD/USD:
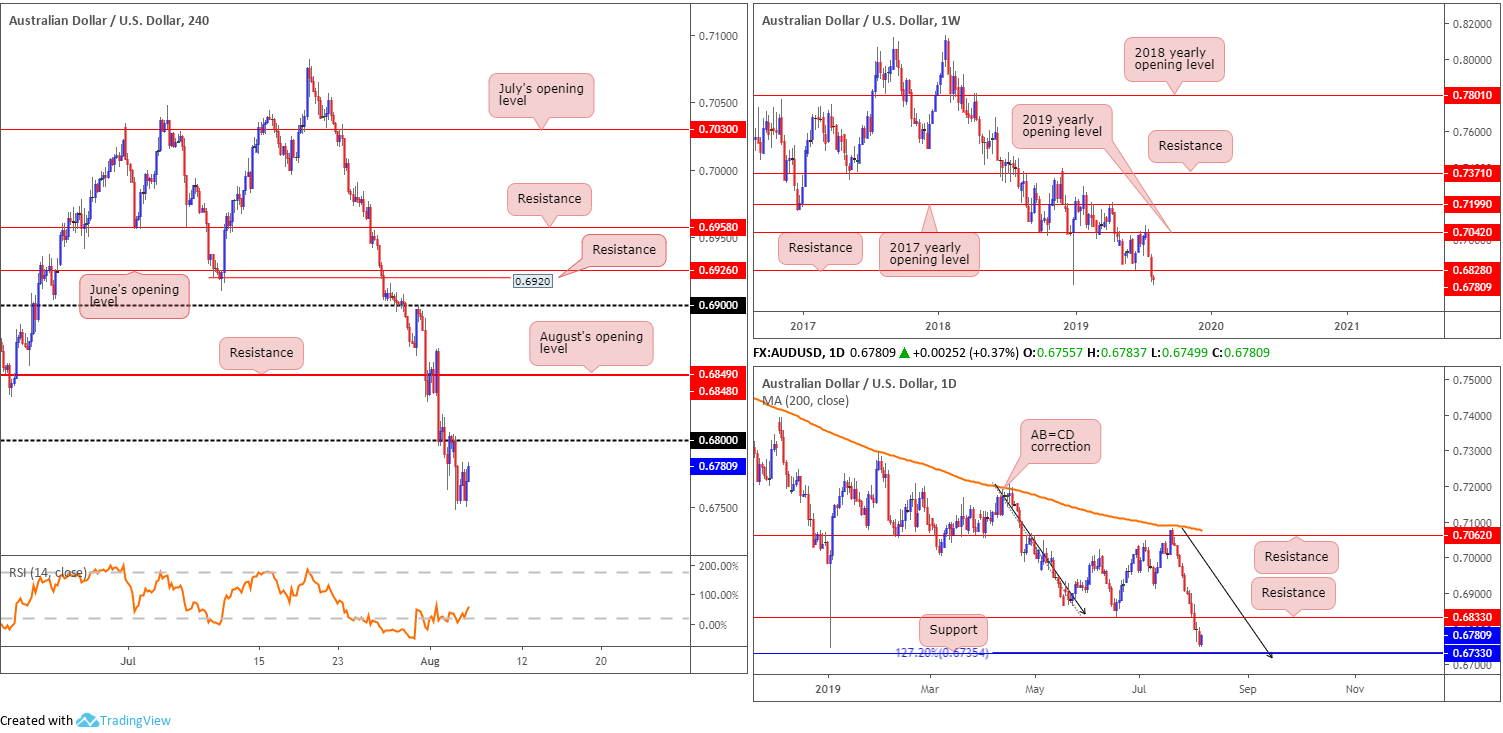
The Australian dollar is weaker vs. the dollar this morning, reaching lows of 0.6748 Monday and registering its twelfth consecutive losing day. The commodity-linked currency came under pressure in early hours following China’s PBoC allowing the yuan to trade above the psychological 7.00 mark for the first time since 2008. This comes amid growing fears the US-China trade battle is now a full-blown currency war. On the data front, markets also had the release of Chinese Caixin services PMI, which came in at 51.6 for July, missing the expected 52.9 and down from the preceding month’s reading of 52.00.
From the weekly timeframe this morning, price action remains languishing beneath notable support at 0.6828 (now potentially serving as resistance), extending the pullback from the 2019 yearly opening level (resistance) at 0.7042. The next support is not visible until 0.6395 on this timeframe (not seen on the screen).
In tandem with weekly price, daily flow engulfed the 0.6833 June 18 low last Thursday (now acting resistance), though is seen closing in on the next support target at 0.6733, which happens to merge with a 127.2% AB=CD (black arrows) formation at 0.6735.
A closer reading of price action on the H4 timeframe reveals the unit sold off from the underside of 0.68.
Areas of consideration:
While H4 price printed little in terms of a bearish candlestick signal off 0.68, the level held nicely. Well done to any of our readers who still managed to jump aboard this move as 0.68 was a noted resistance for shorts. As highlighted above, the next port of call to the downside falls in around daily support at 0.6733, closely followed by the 0.67 handle on the H4 timeframe. Therefore, should the H4 candles retest 0.68 for a second time and produce a bearish candlestick signal (entry/risk parameters can be sited according to the candlestick structure), this could be another opportunity to take advantage of the weakening Aussie dollar.
USD/JPY:
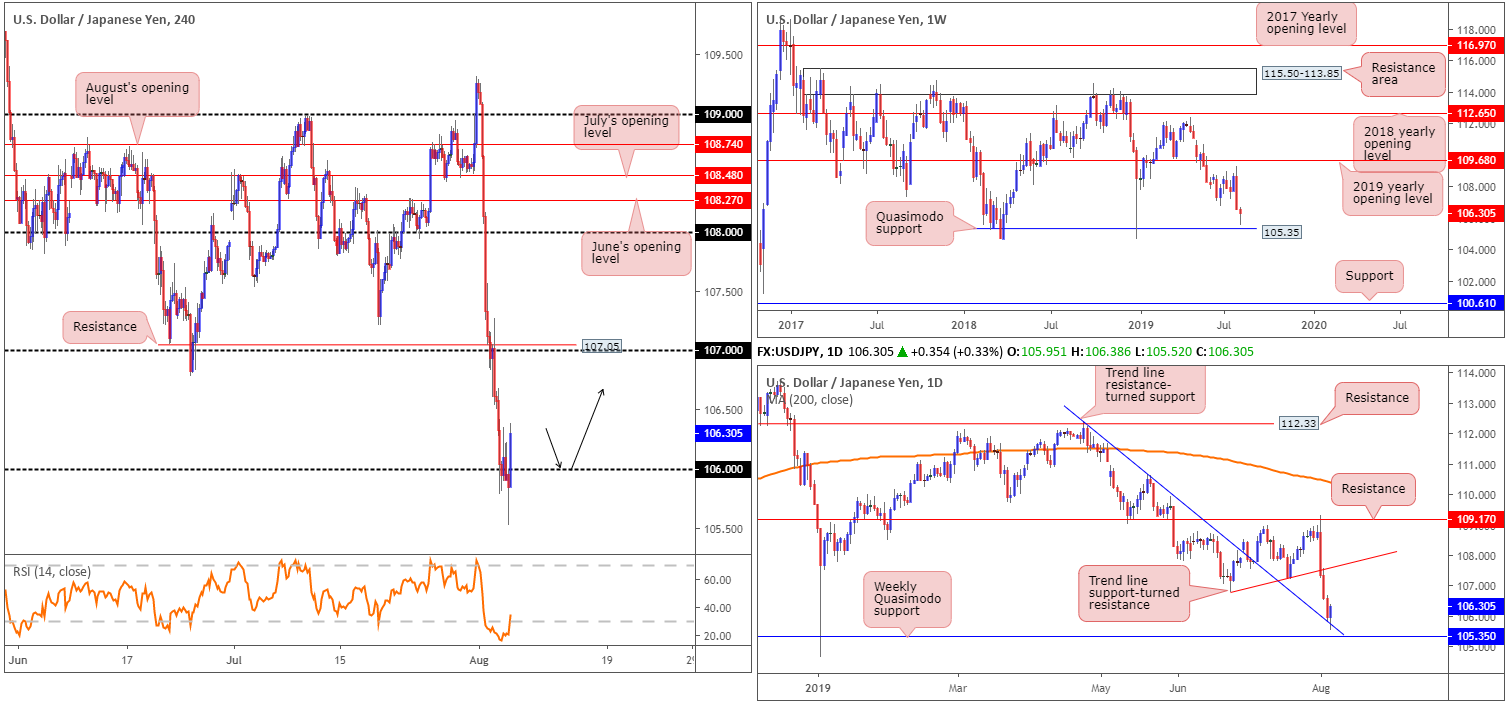
The USD/JPY fell to fresh lows Monday on the back of dollar weakness and risk-off flows. Despite this, the H4 candles recently stabilised and reclaimed 106 to the upside in Tokyo trade. Volatility remains high this morning as trade concerns take grip.
Additional buying could take shape today as the path north on the H4 timeframe is reasonably clear until shaking hands with 107, closely shadowed by Quasimodo support-turned resistance at 107.05. What’s also notable from a technical standpoint is daily price fading a trend line resistance-turned support (extended from the high 112.40). Although H4 price suggests resistance may enter the fray around the 107 neighbourhood, daily price shows a possible run to trend line support-turned resistance (taken from the low 106.78).
Areas of consideration:
In view of the current technical surroundings, a retest (black arrows) at 106 is something to keep an eye open for today. Traders are urged to consider waiting for additional H4 candlestick confirmation before pulling the trigger, however, as round numbers are prone to fakeouts. In the event 106 fails to offer support, traders’ crosshairs will then likely be fixed on the aforementioned daily trend line resistance-turned support, followed by weekly Quasimodo support at 105.35.
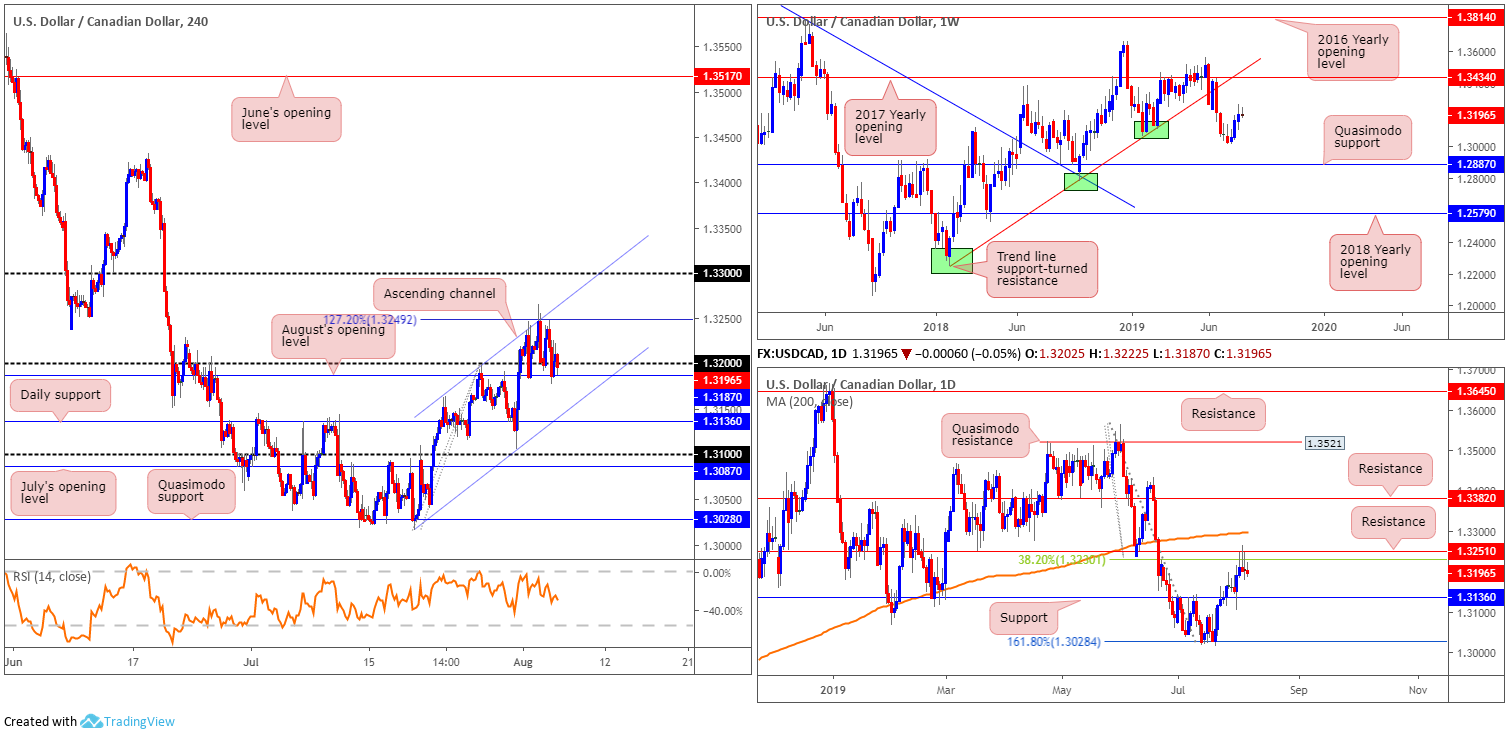
USD/CAD:
Overall, considering dollar weakness and risk-off flows, the USD/CAD market remained pretty much stable Monday. As a result, some of the following report will echo thoughts aired in Monday’s briefing.
As of the weekly timeframe, the USD/CAD has been steadily grinding higher since bottoming at 1.3018 in the form of an inverted hammer pattern. Continued buying from this point has the 2017 yearly opening level at 1.3434 to target, closely shadowed by trend line support-turned resistance etched from the low 1.2247. In the event we turn lower, however, traders’ crosshairs will likely be fixed on Quasimodo support at 1.2887.
Closer examination of price action on the daily timeframe, nonetheless, reveals the pair shook hands with resistance at 1.3251 Friday and formed a striking shooting star pattern. This, alongside a 38.2% Fibonacci resistance at 1.3230 and Monday’s rejection, may be sufficient to entice sellers into the market this week, permitting a retest of support at 1.3136. We could potentially push much further beyond 1.3136, though, as the weekly timeframe broke beneath trend line support (extended from the low 1.2247), possibly signalling the beginning of a downtrend.
As for the H4 candles, price action remains confined between channel resistance (taken from the high 1.3199)/ merging 127.2% Fibonacci ext. point at 1.3249 and August’s opening level at 1.3187/1.32 handle. In the event 1.3187/1.32 fails to hold price, the next layer of support can be found on the daily timeframe highlighted above at 1.3136, which aligns closely with H4 channel support etched from the low 1.3015.
Areas of consideration:
According to the technical studies presented above, sellers appear to have the upper hand at the moment. That is at least until daily support at 1.3136 enters the fray. Therefore, keeping things simple this morning, the research team notes to keep eyes on the H4 channel support highlighted above for possible long opportunities, as this aligns nicely with the daily support level. Traders have the choice of either entering long on the back of candlestick confirmation or simply entering at market with protective stop-loss orders plotted just beneath the said H4 channel support. As for upside targets, the 1.3187/1.32 barrier is a logical starting point.
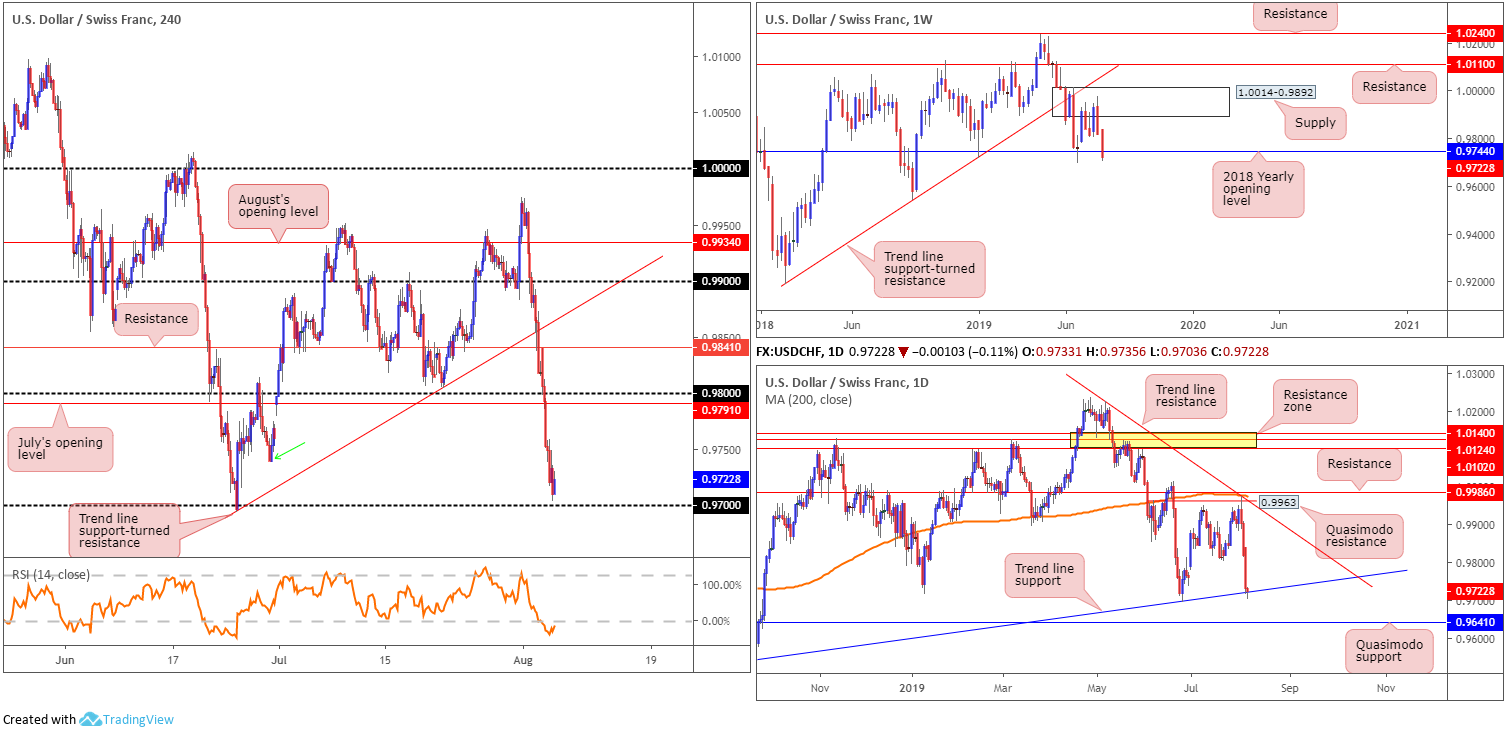
USD/CHF:
Down 0.87% and recording its third consecutive daily loss Monday, the USD/CHF dethroned the 0.98 handle on the H4 timeframe as well as July’s opening level at 0.9791 amid broad-based USD selling, consequently bottoming a few points north of 0.97 into the close. Indicator-based traders may also wish to acknowledge the RSI entered oversold territory.
On more of a broader outlook, trend line support on the daily timeframe (etched from the low 0.9542) elbowed its way into the spotlight Monday. According to this timeframe, a move higher could potentially target trend line resistance (extended from the high 1.0226), while further downside has Quasimodo support in sight at 0.9641.
Higher up on the curve, however, we can see weekly price overthrew the 2018 yearly opening level at 0.9744. A close beneath this base may lead to a move towards the September 17 low 0.9542.
Areas of consideration:
Longs from 0.97 are likely on the radar for some traders this morning, even more so knowing daily trend line support is in motion as well as the H4 RSI indicator testing oversold waters. A H4 bullish candlestick configuration formed off 0.97 would, therefore, be considered a high-probability buying opportunity, targeting 0.9750ish as the first upside target (due to the lows marked with a green arrow). Waiting for a bullish candlestick pattern to form not only helps identify buyer intent off an area of interest, it also provides traders entry and risk levels to work with.
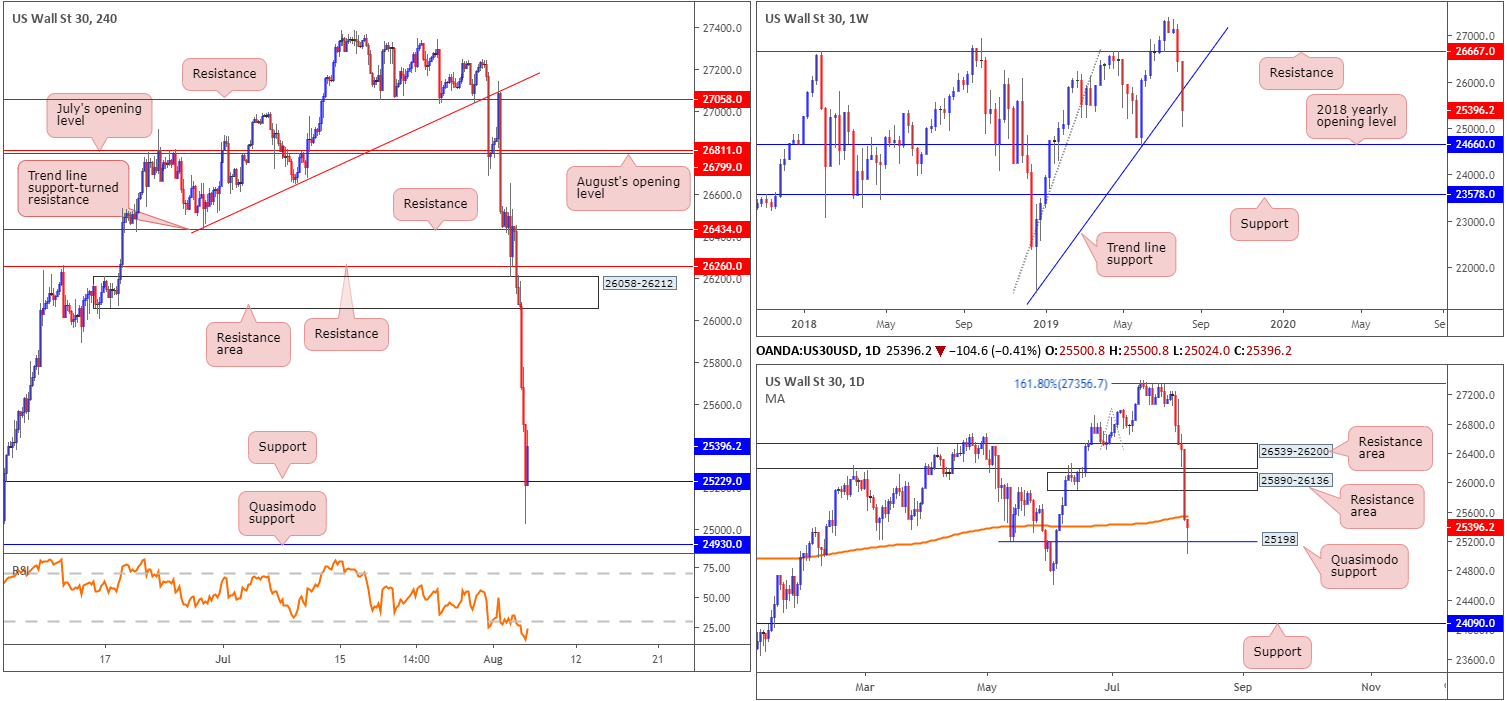
Dow Jones Industrial Average:
US stocks registered their biggest one-day drop of the year after China permitted its currency to fall through a key threshold, consequently escalating the trade war between the US and China and raising concerns about the outlook for global growth. The Dow Jones Industrial Average erased 767.27 points, or 2.90%; the S&P 500 lost 87.31 points, or 2.98% and the Nasdaq declined 277.11 points, or 3.60%.
Inspecting the Dow from the charts, the research team notes weekly price overthrew trend line support (extended from the low 21452) in recent movement, potentially clearing the pathway south towards the 2018 yearly opening level at 24660.
Offering some much-needed respite, however, daily Quasimodo support at 25198 appears to be holding ground in Asia trade this morning, though the market may be strongly offered around 25554: the 200-day SMA (orange). Overhead, nonetheless, the market has room to approach two layers of resistance areas at 26539-26200 and 25890-26136.
H4 support at 25229, aligning closely with the daily Quasimodo support at 25198 and confirmed by the H4 RSI indicator testing oversold territory, is in motion as we write, despite a rather aggressive push to lows of 25024. Should the unit continue exploring lower ground today, Quasimodo support on the H4 timeframe resides close by at 24930.
Areas of consideration:
We have the following to work with:
- Weekly price suggesting lower prices after breaking trend line support.
- Daily action finding a floor off Quasimodo support at 25198, though facing potential resistance around 25554.
- H4 price holding at support, with plenty of room to push higher.
Irrespective of the direction one selects, opposing structure/directional flow is evident. As such, in the absence of clearer price action, opting to remain on the sidelines may be the better path to take today.
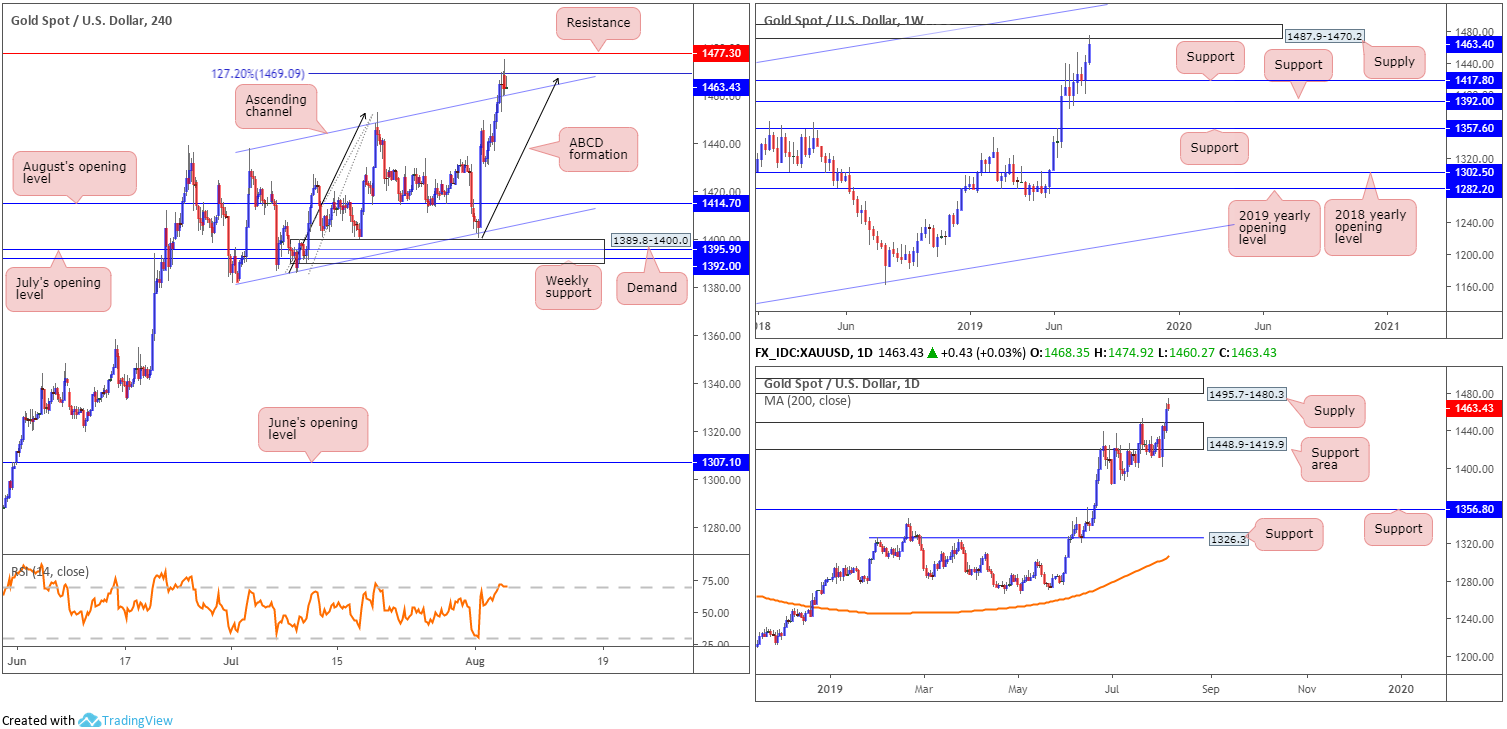
XAU/USD (GOLD):
Monday witnessed the bulls reassert their dominance in XAU/USD, as havens JPY, CHF and XAU caught a bid amid the risk-off tone after China’s yuan slid against the USD.
Thanks to recent buying, weekly price shook hands with supply at 1487.9-1470.2, extended from April 2013. Further buying here could eventually land bullion at channel resistance taken from the high 1375.1, whereas a rotation lower has support at 1417.8 to target. The story on the daily timeframe, nevertheless, shows room to inch higher until connecting with supply at 1495.7-1480.3, after engulfing supply at 1448.9-1419.9 (now acting support area).
In terms of where we stand on the H4 timeframe, we can see the candles crossed swords with a 127.2% ABCD (black arrows) formation at 1469.0, which happens to be situated just south of resistance coming in at 1477.3 and confirmed by the RSI indicator testing overbought terrain. While this is considered a bearish indicator, traders may want to take into account price is also finding a floor off channel resistance-turned support extended from the high 1437.7.
Areas of consideration:
Aside from daily structure, weekly and H4 flow exhibits strong resistance in play at the moment. This could lead to a bout of profit taking today. However, selling in this market, against such a dominant trend, is chancy. Therefore, the research team recommends waiting and seeing if the H4 candles can close back beneath the channel support. A close beneath here implies seller strength and may lead to an approach towards the top edge of the daily support area at 1448.9, closely followed by weekly support at 1417.8 and then August’s opening level at 1414.7 on the H4. Traders have the choice of either entering based on the breakout candle or waiting for a retest of the level to materialise.
The accuracy, completeness and timeliness of the information contained on this site cannot be guaranteed. IC Markets does not warranty, guarantee or make any representations, or assume any liability regarding financial results based on the use of the information in the site.
News, views, opinions, recommendations and other information obtained from sources outside of www.icmarkets.com.au, used in this site are believed to be reliable, but we cannot guarantee their accuracy or completeness. All such information is subject to change at any time without notice. IC Markets assumes no responsibility for the content of any linked site.
The fact that such links may exist does not indicate approval or endorsement of any material contained on any linked site. IC Markets is not liable for any harm caused by the transmission, through accessing the services or information on this site, of a computer virus, or other computer code or programming device that might be used to access, delete, damage, disable, disrupt or otherwise impede in any manner, the operation of the site or of any user’s software, hardware, data or property.


