
EUR/USD:
Despite substandard lower-tier data out of the US, the greenback (the US dollar index) extended gains Monday and tested highs of 96.82.
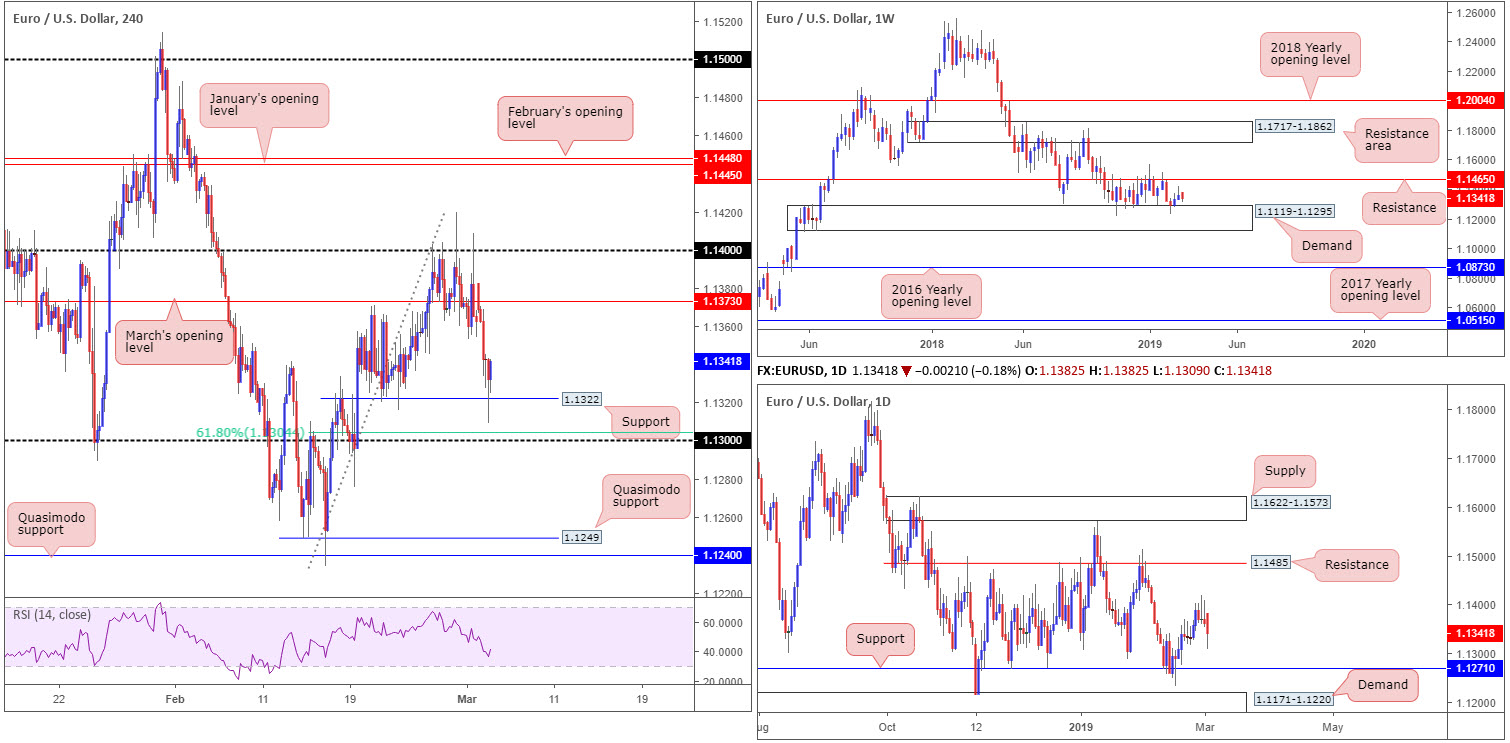
A rising buck, as you can see, weighed on the euro. Following a sloppy retest to the underside of March’s opening level at 1.1373 on the H4 timeframe, the EUR/USD touched gloves with support at 1.1322, which, for now, is holding ground. Beneath this base, 1.13 is visible. Beyond here, however, a reasonably clear run south towards Quasimodo support at 1.1249 is potentially in store.
In terms of the bigger picture, the weekly timeframe shows buyers and sellers, since October 2018, have been battling for position between a long-standing support/resistance at 1.1465 and notable demand coming in at 1.1119-1.1295. Overall, the trend continues to face a southerly direction on this timeframe, with the possibility of a subsequent lower low forming in the future.
The picture on the daily timeframe has support at 1.1271 in view, following yesterday’s decline. Traders may also want to acknowledge demand seen at 1.1171-1.1220. To the upside, apart from the 1.1419 Feb 28 high, resistance falls in around the 1.1485 neighbourhood.
Areas of consideration:
Buying from the H4 support mentioned above at 1.1322 is appealing from a H4 perspective, though from the daily and weekly timeframes, a move lower is suggested.
The 1.13 handle is an area buyers are likely to make an appearance. Not only has it additional support emerging from a 61.8% H4 Fibonacci value at 1.1304, it’s also further bolstered by the top edge of weekly demand at 1.1295. A long from 1.13 would, according to our technical studies, have an initial upside target of 1.1373 (March’s opening level highlighted above), though clearing 1.1322 (which would be acting resistance at that point) would be the first port of call, and possibly a cue to consider reducing risk to breakeven. In regards to entry, the research team believes 1.1295 is high probability, with a stop-loss placement at 1.1274 (beneath the 1.1276 Feb 19 low).
Today’s data points: FOMC Member Rosengren Speaks; ISM Non-Manufacturing PMI.
GBP/USD:
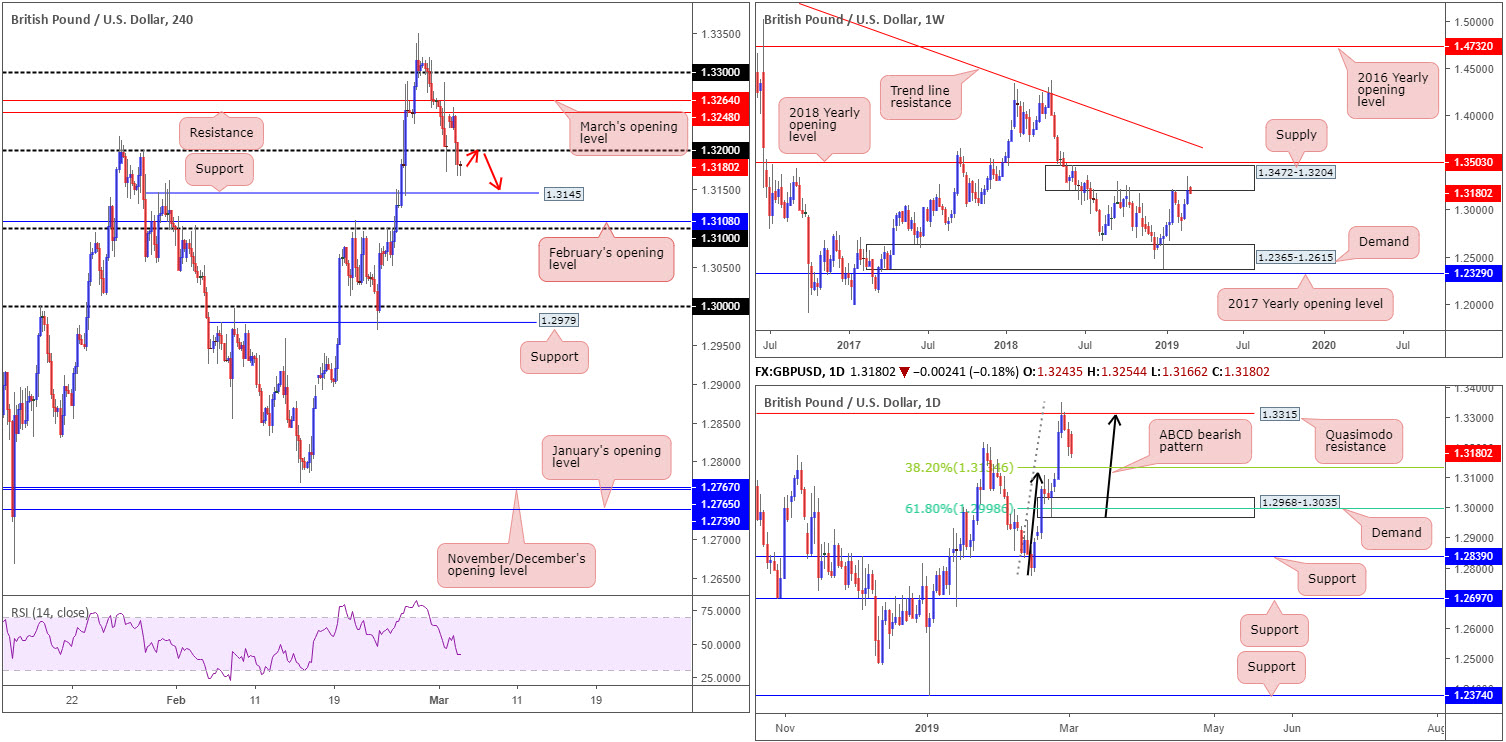
The GBP/USD kicked off the week opening markedly higher, though swiftly found H4 resistance at 1.3248 as the candles entered into London’s session. Largely piggybacking off a USD advance, H4 price tested and eventually overthrew 1.32 to the downside, exposing H4 support at 1.3145, followed by February’s opening level at 1.3108 and then the 1.31 handle.
Against the backdrop of H4 flow, weekly movement is engaging with the lower edge of supply pictured at 1.3472-1.3204 (positioned just south of the 2018 yearly opening level at 1.3503). In parallel with weekly action, daily price crossed swords with a Quasimodo resistance level parked at 1.3315 Wednesday and turned lower into the week’s close. Adding weight to this resistance is the approach: an ABCD bearish formation (black arrows). The 38.2% Fibonacci support value at 1.3134 on this timeframe is considered the first take-profit target for those short the ABCD bearish pattern, followed by the 61.8% Fibonacci support at 1.2998, wrapped within the limits of a fresh demand base at 1.2968-1.3035.
Areas of consideration:
Despite higher-timeframe structure backing sellers, limited room to manoeuvre is visible on the H4. The only somewhat attractive scenario in this market is an intraday break/retest play of 1.32 (red arrows), targeting 1.3145 as the initial port of call, which combines with the 38.2% daily Fibonacci support highlighted above at 1.3134. Traders wishing to add a little more confirmation to the mix have the option of drilling down to the lower timeframes and entering on the back of a bearish candlestick play on the retest of 1.32 (entry/stop levels can be defined according to this structure).
Today’s data points: UK Services PMI; BoE Gov Carney Speaks; FOMC Member Rosengren Speaks; ISM Non-Manufacturing PMI.
AUD/USD:
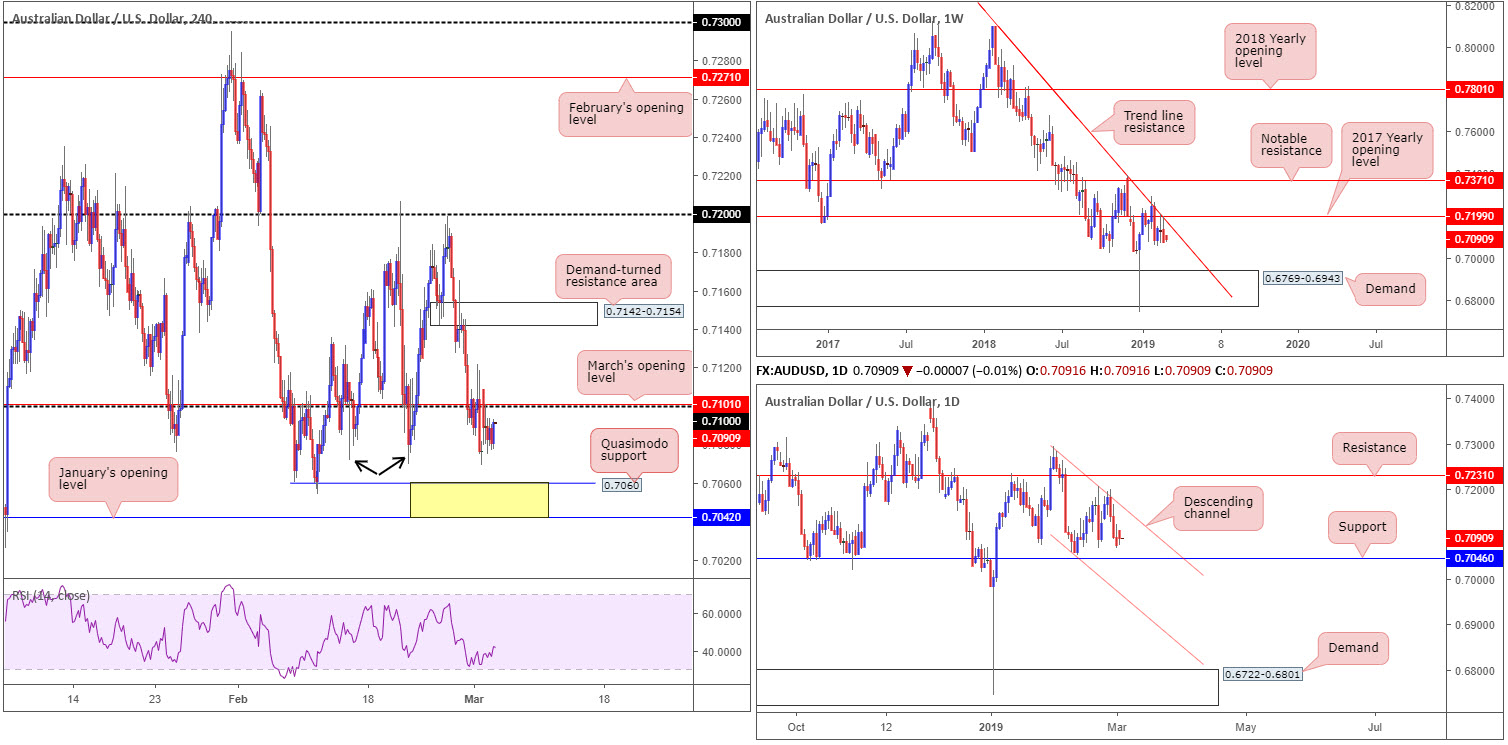
In spite of a somewhat enthusiastic market open this week amid headlines suggesting US President Trump and China’s Xi could sign a trade agreement when they meet in later March (Bloomberg), resistance entered the fold around 0.71ish on the H4 timeframe: the round number and March’s opening level.
Although the market witnessed the US dollar extend its recovery to highs of 96.82 (US dollar index) Monday, the Australian dollar entered into a lifeless consolidation 15 pips south of 0.71 and just north of 0.7072ish: a double bottom support (black arrows). Beneath 0.7072, traders may wish to acknowledge nearby Quasimodo support plotted at 0.7060, tailed closely by January’s opening level at 0.7042 (yellow).
Weekly flow is contained by the 2017 yearly opening level at 0.7199 and merging trend line resistance (taken from the 2018 yearly high of 0.8135). This coupled with downside displaying room to press as far south as demand at 0.6769-0.6943 on this timeframe, sellers appear to have the upper hand this week.
Daily action is compressing within a descending channel (0.7295/0.7060), though currently hovering a few pips north of notable support at 0.7046. This level boasts reasonably clean history dating as far back as late August 2015.
Areas of consideration:
Should we reach the yellow zone on the H4 timeframe this week, preferably bringing in daily support at 0.7046 which inhabits the lower limit of the area, longs may be in the offing. Though, do bear in mind, a bounce is all that’s expected as you are effectively buying against weekly selling here.
For folks who feel threatened by the possibility of weekly selling, waiting for additional confirmation to take shape out of the yellow area is an option. Confirmation techniques are, of course, trader dependent, though a basic method of confirming an area’s validity can be as simple as drilling down to the lower timeframes and entering on a resistance-turned support setup, preferably backed up with a candlestick signal.
In terms of upside targets out of 0.7042/0.7060, the 0.71 barrier is likely to be the first port of call.
Today’s data points: Australian Current Account; RBA Rate Statement and Cash Rate; FOMC Member Rosengren Speaks; ISM Non-Manufacturing PMI.
USD/JPY:
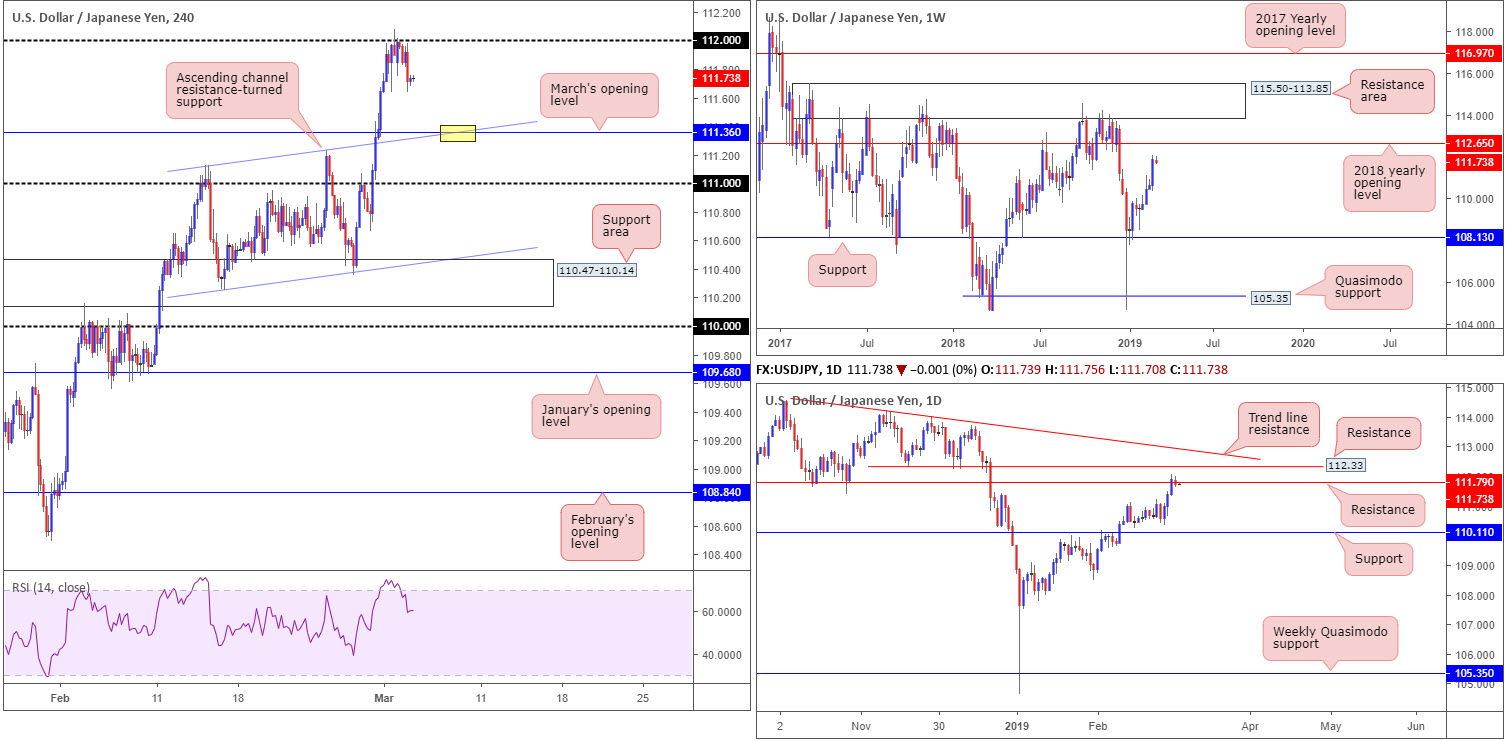
The sharp drop observed in US equity indexes and the 10-year US Treasury yield shows risk-aversion took control of the market Monday, consequently weighing on the USD/JPY sub 112 on the H4 timeframe. Assuming further selling takes form today and possibly into the week, the H4 candles will shake hands with March’s opening level drawn from 111.36, which, as you can see, links closely with an ascending channel resistance-turned support (taken from the high 111.12).
Pivotal resistance at 112.65 (the 2018 yearly opening level) is seen on the weekly timeframe, demonstrating this market still has room to advance. The story on the daily timeframe, however, shows resistance at 111.79 is in the spotlight. Note directly above this barrier, we have another layer of resistance pencilled in at 112.33, followed by trend line resistance extended from the high 114.23.
Areas of consideration:
On account of the above reading, daily sellers will likely push for lower ground today/mid-week and possibly bring the H4 candles towards March’s opening level on the H4 timeframe at 111.36. This barrier, particularly at the point the channel support merges with the level (yellow), is an interesting buy zone given we have room to move higher on the weekly timeframe to at least 112.65.
For traders wishing for a little more confirmation out of 111.36, waiting for a H4 bullish candlestick formation to come about is an option. Not only will the candlestick signal identify buyer intent, it’ll serve as a guide for entry and risk levels.
Today’s data points: FOMC Member Rosengren Speaks; ISM Non-Manufacturing PMI.
USD/CAD:
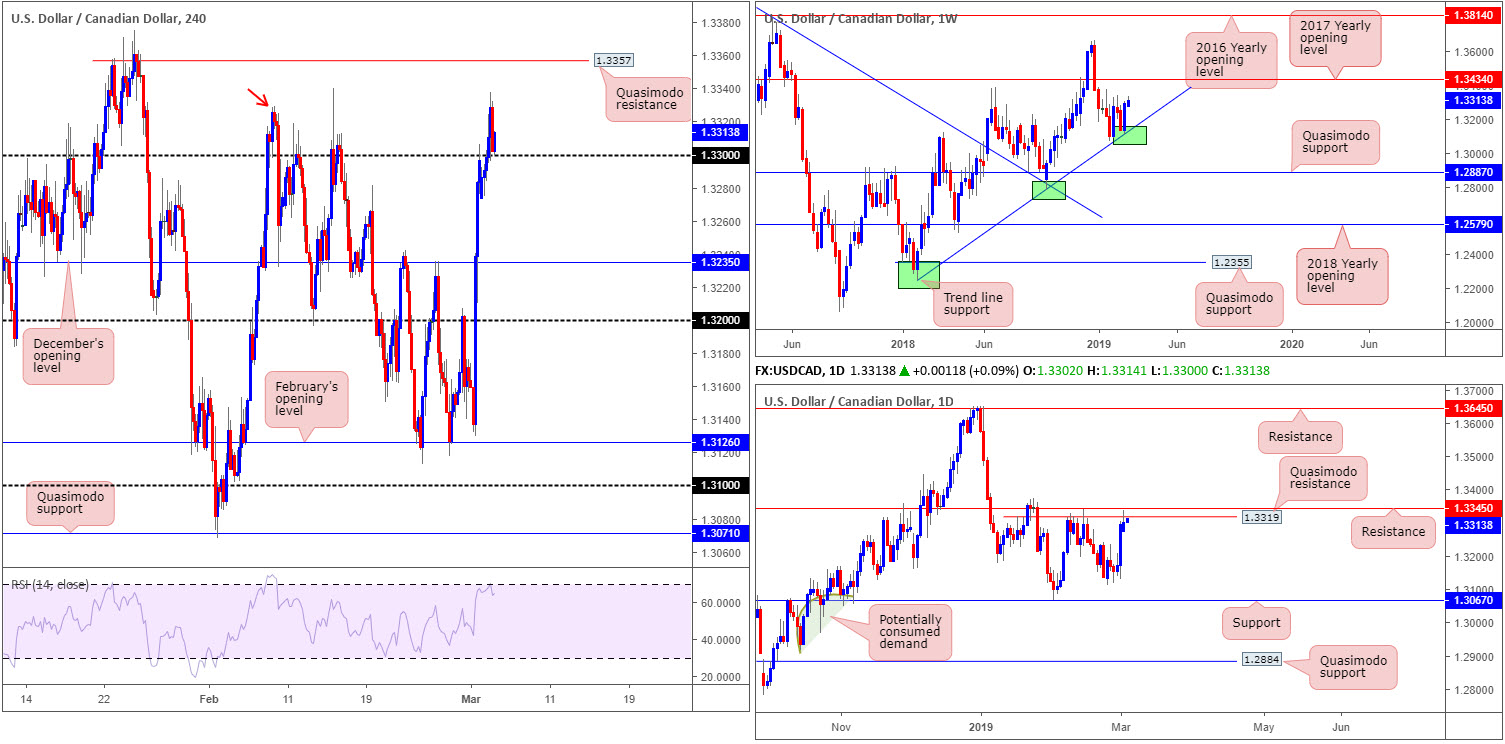
A modest pickup in USD demand provided the USD/CAD enough gas to explore higher ground Monday, consequently breaking through orders circulating around 1.33 on the H4 timeframe and reaching highs of 1.3337.
According to our technical studies on the H4 timeframe, the unit is seen retesting 1.33 as support which could generate follow-through buying today. The caveat, however, is the daily Quasimodo resistance (marked with a red arrow on the H4) at 1.3319 is in motion, which happens to be closely followed by daily resistance at 1.3345.
Supporting further upside, nevertheless, is the weekly timeframe. Shaped in the form of a clear-cut bullish engulfing candle off trend line support (extended from the low 1.2247), the US dollar outperformed vs. its Canadian counterpart last week. Further buying on the back of this could eventually probe orders around the 2017 yearly opening level priced in at 1.3434.
Areas of consideration:
On the whole, buying is higher probability knowing we’re coming from weekly trend line support. Therefore, should H4 price close strongly off 1.33, a long based on this candle structure is an idea, targeting daily resistance at 1.3345 as an initial take-profit zone, followed by a H4 Quasimodo resistance at 1.3357. The ultimate take-profit target, though, is the 2017 yearly opening level mentioned above on the weekly timeframe at 1.3434.
Today’s data points: FOMC Member Rosengren Speaks; ISM Non-Manufacturing PMI.
USD/CHF:
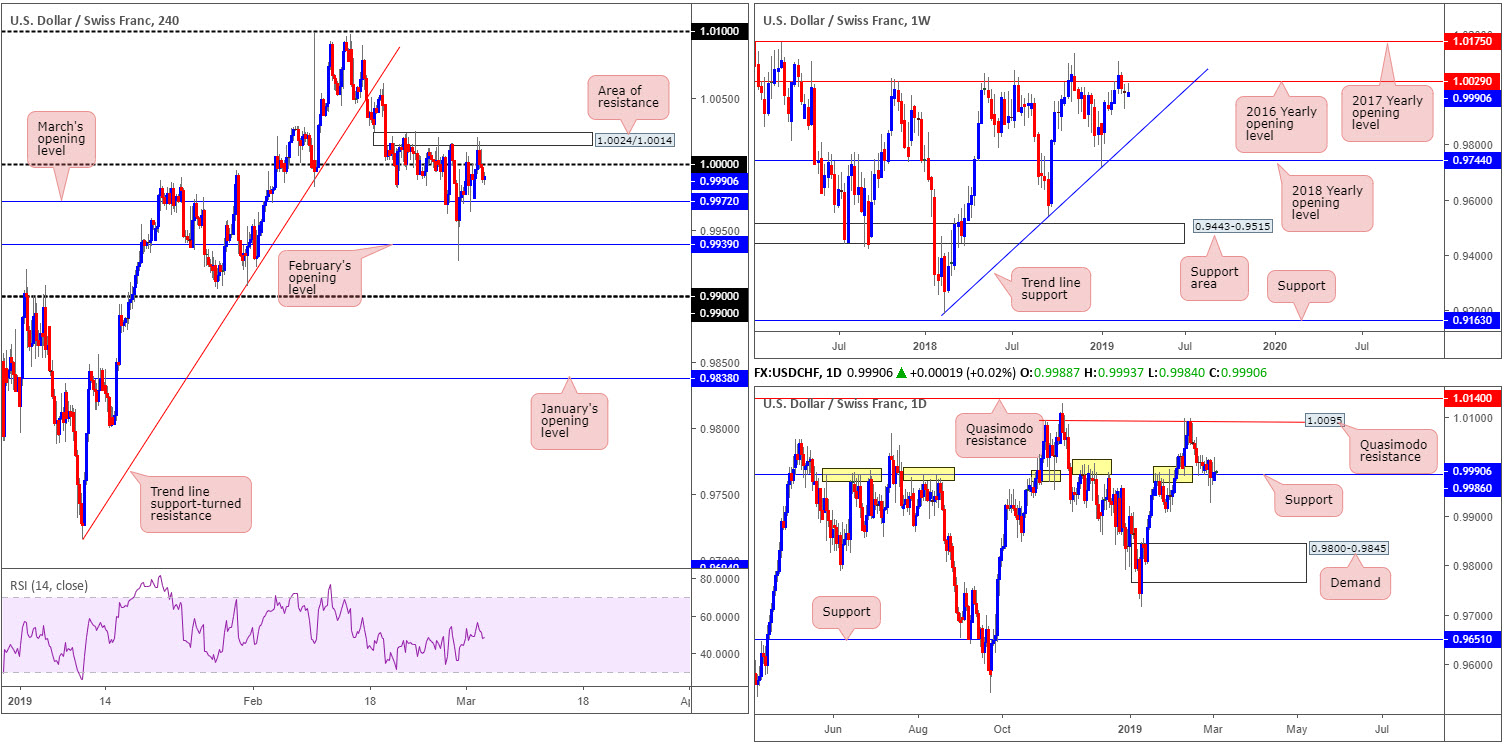
Kicking things off with a look at the weekly timeframe, price continues to languish beneath the 2016 yearly opening level at 1.0029. As highlighted in the previous weekly briefing, 1.0029’s history as a resistance – dating as far back as February 2016 – may draw in sellers towards trend line support (etched from the low 0.9186) over the coming weeks.
A closer look at price action on the daily timeframe turns the spotlight towards notable support seen at 0.9986. The level’s history (yellow) is a prominent feature on this chart. Buyers long from this number were likely consumed mid-week and finished off Thursday with a drop to lows of 0.9926. A possible support beyond here is the 0.9905 Jan 28 low, followed by demand pressed at 0.9800-0.9845.
Over on the H4 timeframe, however, an area of resistance is seen in play around 1.0024/1.0014, capping upside on a number of occasions since Feb 20. Despite broad-based USD buying Monday, the H4 candles failed to conquer 1.0000 (parity) and concluded the day settling at 0.9988. Downside targets on the H4 timeframe fall in at March’s opening level at 0.9972, followed by February’s opening level at 0.9939, and then 0.99.
Areas of consideration:
Seeing weekly flow positioned beneath 1.0029, and daily support at 0.9986 suffering a reasonably wild blow Thursday last week, the pendulum still appears to be swinging towards more of a decline. This, as well as, H4 action failing to overthrow 1.0000 certainly positions sellers in the driving seat, according to our technical studies. While all three timeframes suggest further selling could be on the cards, the H4 supports mentioned above at 0.9927 and 0.9939 (March and Februay’s opening levels) are problematic obstacles.
Should 1.0000 draw in a retest as resistance today and you’re able to drill down to a small enough timeframe that permits a trade factoring in reasonable risk/reward to 0.9972, then a sell in this market is high probability.
Today’s data points: FOMC Member Rosengren Speaks; ISM Non-Manufacturing PMI.
Dow Jones Industrial Average:
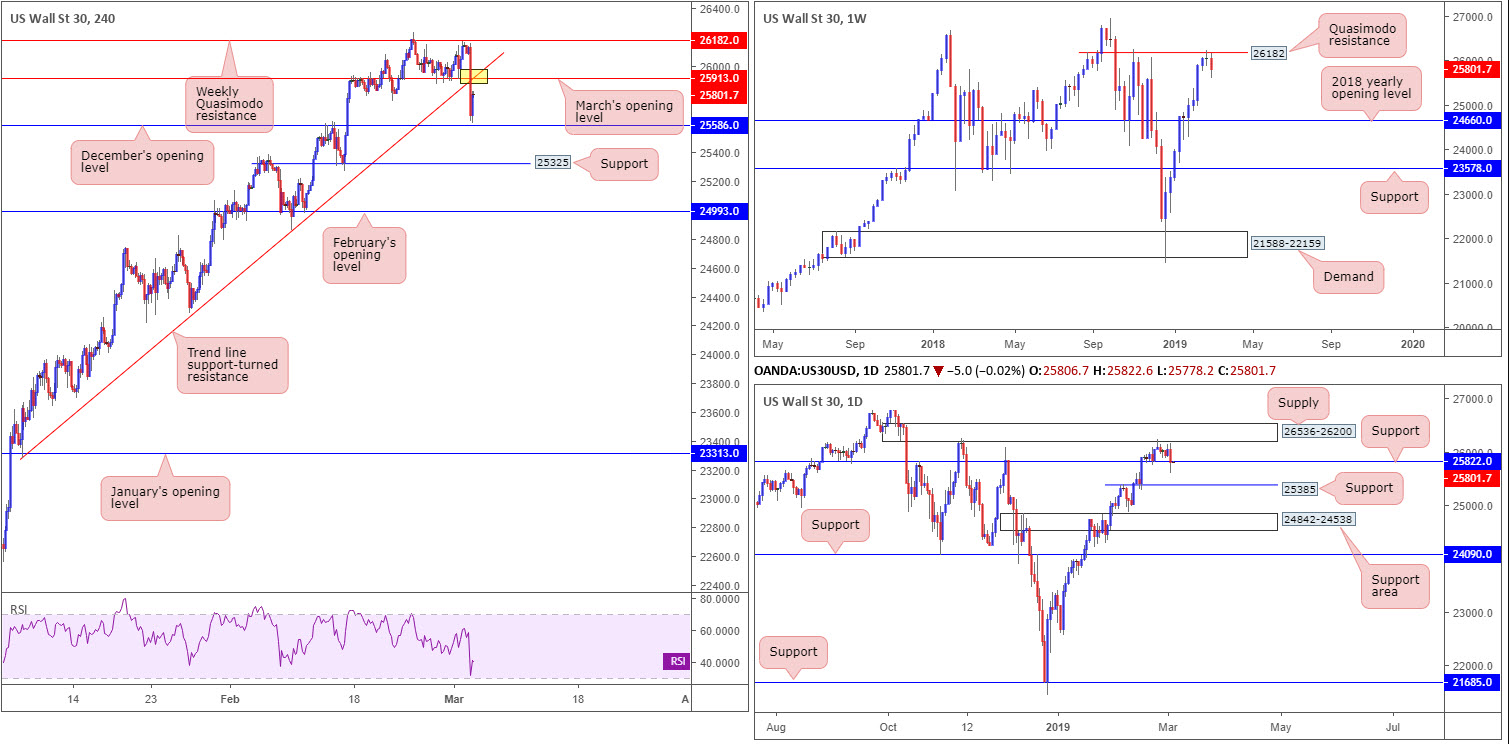
Wall Street kicked off the week reflecting a bearish stance as trade concerns hit the US economy.
Technically speaking from the weekly timeframe, the move was to be expected. Upward momentum diminished over the course of last week, as the index embraced Quasimodo resistance at 26182. The next downside support target rests at 24660: the 2018 yearly opening level. In conjunction with weekly flow, daily price made a run for support at 25822 yesterday, testing lows of 25605. In the event buyers are consumed here, the next area of concern can be seen around 25385.
A closer look at price action on the H4 timeframe shows recent selling obliterated March’s opening level at 25913 and its converging trend line support (etched from the low 23277), and bottomed just north of December’s opening level at 25586.
Areas of consideration:
Based on weekly price fading Quasimodo resistance and daily sellers making a play for support, the point at which March’s opening level at 25913 and the H4 trend line support-turned resistance merge (yellow) is an area active sellers likely reside.
For conservative traders concerned about having their stop-loss orders consumed on a fakeout through 25913, waiting for additional candlestick confirmation will help avoid this (entry and stop parameters can be defined according to the candlestick’s rules of engagement).
Today’s data points: FOMC Member Rosengren Speaks; ISM Non-Manufacturing PMI.
XAU/USD (GOLD):
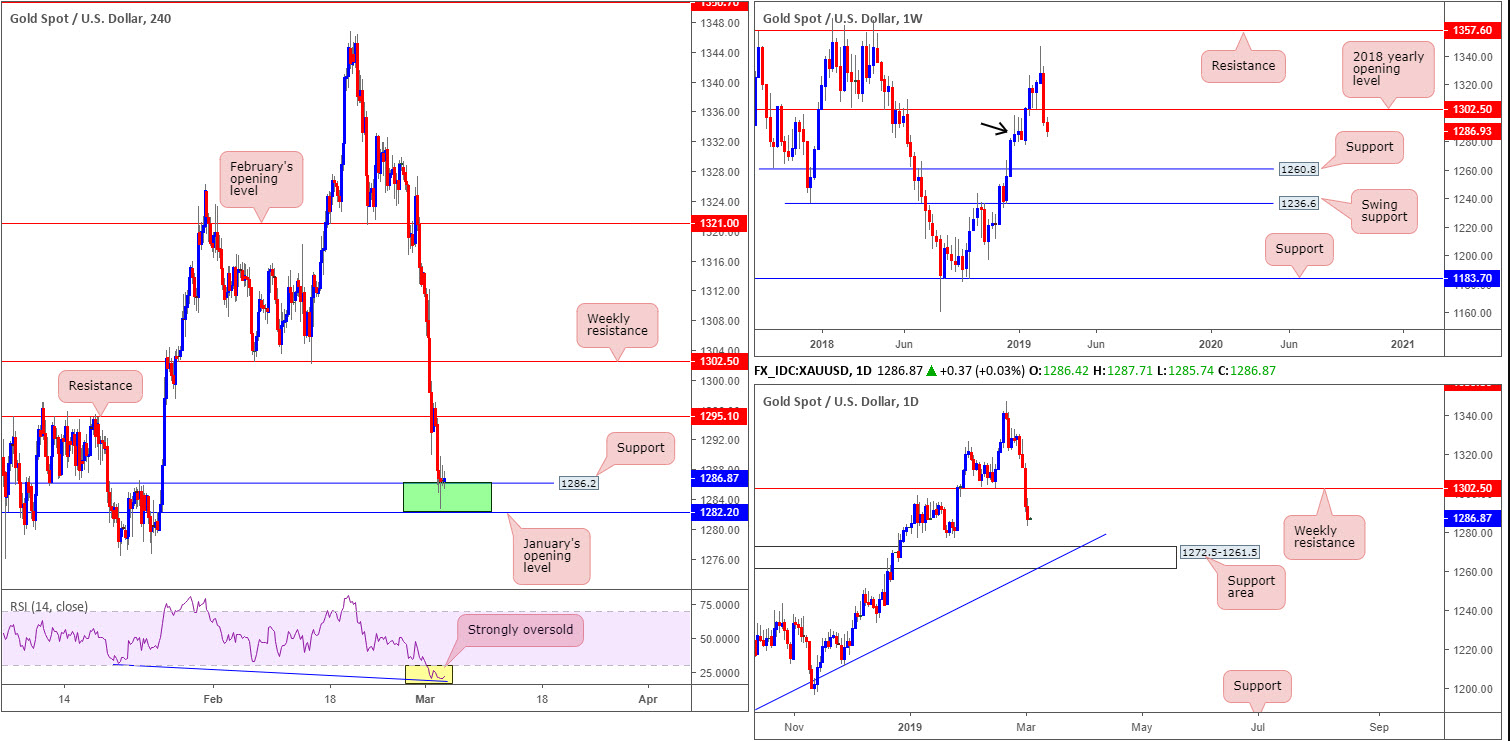
Bullion suffered at the hands of a robust US dollar Monday as the yellow metal chalked up its fourth consecutive loss, testing lows just north of January’s opening level at 1282.2 on the H4 timeframe. Note also support is positioned a few pips ahead of this monthly level at 1286.2, and the RSI indicator is seen displaying a strong oversold/divergence reading.
By way of a near-full-bodied bearish candle, weekly price engulfed the 2018 yearly opening level at 1302.5 in strong fashion. We do still have some demand in motion around 1276.5-1298.5 (black arrow), which could force a retest of 1302.5 as resistance this week. Beyond the parapets of the current weekly demand, the daily chart has eyes on a support area coming in at 1272.5-1261.5, which happens to align with a trend line support (taken from the low 1160.3).
Areas of consideration:
The green zone on the H4 timeframe between January’s opening level at 1282.2 and support at 1286.2 stands a firm chance of holding today. This is largely because of where the zone is located on the weekly timeframe: demand. The first upside target from 1282.2/1286.2 falls in around H4 resistance at 1295.1, followed then by weekly resistance at 1302.5.
For those already long from the said H4 zone, stop-loss orders are likely positioned a couple of pips beneath the area. For conservative traders wanting a confirming candlestick signal, as of yet, little in has been seen, despite price holding. Should a bullish signal form, entry and risk can be determined according to the selected candle’s rules.
The accuracy, completeness and timeliness of the information contained on this site cannot be guaranteed. IC Markets does not warranty, guarantee or make any representations, or assume any liability with regard to financial results based on the use of the information in the site.
News, views, opinions, recommendations and other information obtained from sources outside of www.icmarkets.com.au, used in this site are believed to be reliable, but we cannot guarantee their accuracy or completeness. All such information is subject to change at any time without notice. IC Markets assumes no responsibility for the content of any linked site. The fact that such links may exist does not indicate approval or endorsement of any material contained on any linked site.
IC Markets is not liable for any harm caused by the transmission, through accessing the services or information on this site, of a computer virus, or other computer code or programming device that might be used to access, delete, damage, disable, disrupt or otherwise impede in any manner, the operation of the site or of any user’s software, hardware, data or property.


