
EUR/USD:
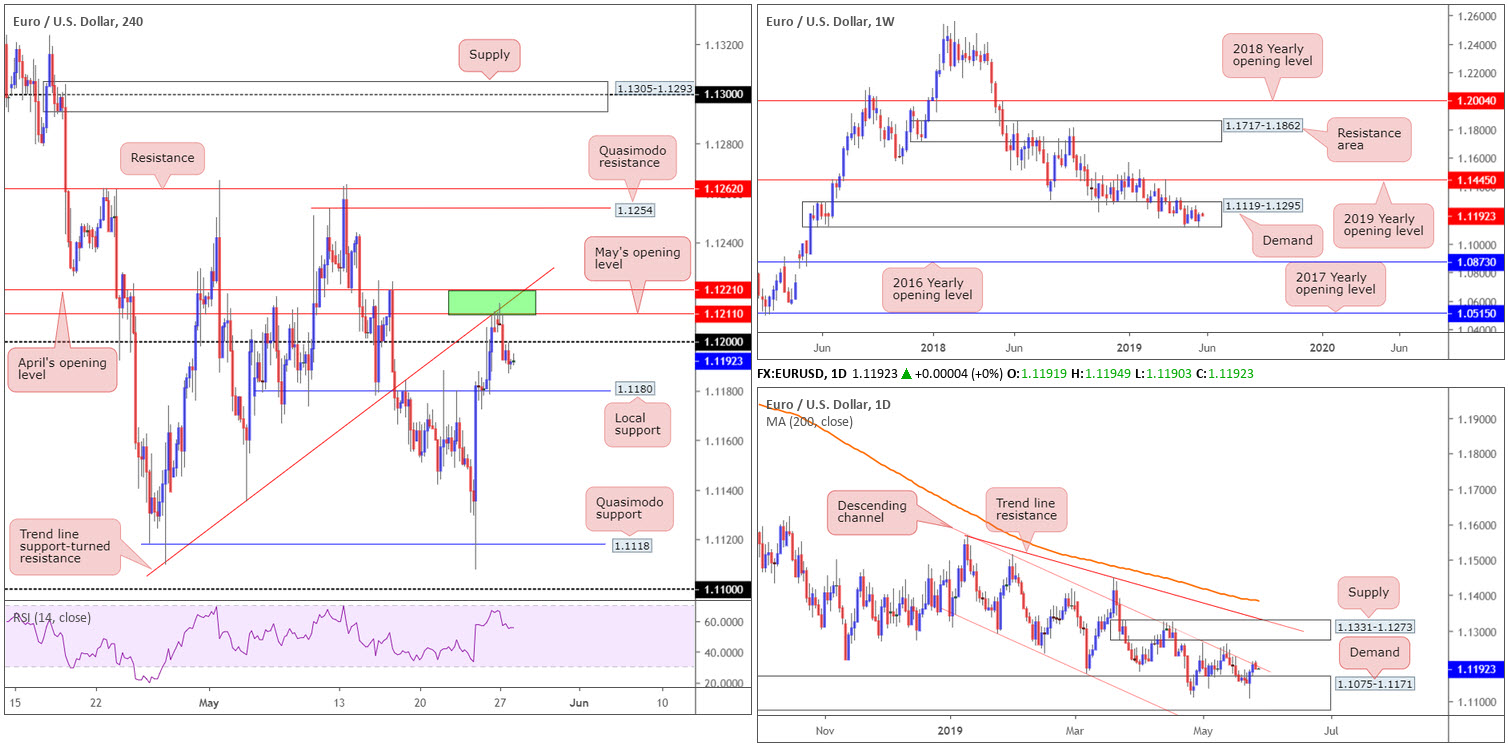
Monday’s session witnessed the EUR/USD tick higher to 1.1215 in early trading, though failed to capitalise on the move, slipping back below the 1.12 handle amid holiday-thinned conditions. The absence of macroeconomic releases exacerbated the lack of volatility, although the greenback finished the day modestly up against most rivals. European Elections had only a modest impact on financial markets.
For those who read Monday’s report you may recall the piece highlighted the green zone marked on the H4 timeframe between 1.1221/1.1211 as a potential sell zone (comprised of May’s opening level at 1.1211, a H4 trend line support-turned resistance taken from the low 1.1109, a H4 shooting star formation, April’s opening level at 1.1221 and a daily channel resistance extended from the high 1.1569). Well done to any of our readers who managed to take advantage of the move.
With 1.12 likely to serve as resistance, local support on the H4 timeframe resides around 1.1180. The space beneath this boundary could call for a move to H4 Quasimodo support at 1.1118. However, on the daily scale here traders almost immediately have to compete with the top edge of daily demand at 1.1075-1.1171 (the next downside target on the daily scale).
In terms of the weekly timeframe’s setting, the buyers and sellers remain warring for position within the lower limits of a long-standing demand at 1.1119-1.1295. Upside from this point shows room for extension to as far north as the 2019 yearly opening level at 1.1445, whereas a move lower has the 2016 yearly opening level at 1.0873 in the firing range. According to the overall trend facing a southerly bearing since topping in early 2018, a break of the aforesaid demand is the more likely event.
Areas of consideration:
Aside from the sell out of 1.1221/1.1211, the research team sees little to hang their hat on in regards to high-probability moves today.
As highlighted in Monday’s piece, sellers could consider waiting for a break of H4 support at 1.1180 for a short towards 1.1118, though the threat of daily buyers entering the fray from demand at 1.1075-1.1171 may be too much for many traders.
Today’s data points: US CB Consumer Confidence.
GBP/USD:
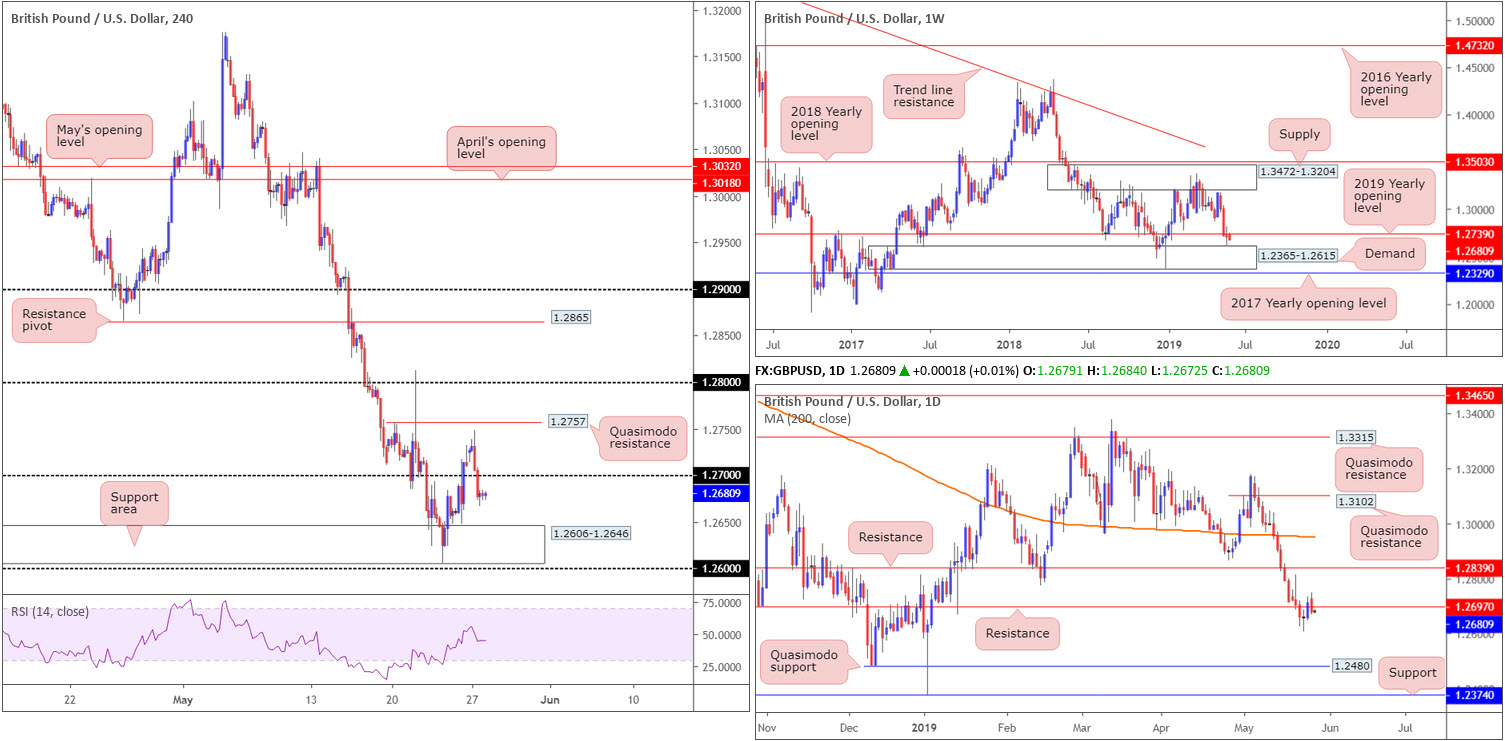
Despite an optimistic start to the week, reaching highs of 1.2747, sterling traded softer against its US counterpart Monday (-0.25%), following the Brexit party snatching the Lion’s share at the European Elections in the UK. Although both US and UK banks were closed, 1.27 on the H4 timeframe was defeated, potentially setting the stage for a move towards a nearby support area at 1.2606-1.2646, shadowed closely by the 1.26 handle.
On a wider setting, weekly price is holding firm beneath its 2019 yearly opening level at 1.2739 and has eyes on demand seen close by at 1.2365-1.2615. Daily flow, however, recently crossed back beneath support at 1.2697 (now acting resistance) and appears poised to make a run for Quasimodo support priced in at 1.2480.
Areas of consideration:
Although some traders are likely looking to buy the H4 demand mentioned above at 1.2606-1.2646, given its connection with the top edge of weekly demand at 1.2365-1.2615, a fakeout through this area to the nearby 1.26 handle is also a possibility.
Therefore, conservative traders may wish to adopt a patient approach and see if the candles are drawn to 1.26 before pulling the trigger. An ideal scenario would be for H4 price to print a hammer formation off 1.26, thus confirming buyer intent and simultaneously providing traders a structure to base entry and risk levels from.
Today’s data points: US CB Consumer Confidence.
AUD/USD:
Outlook unchanged.
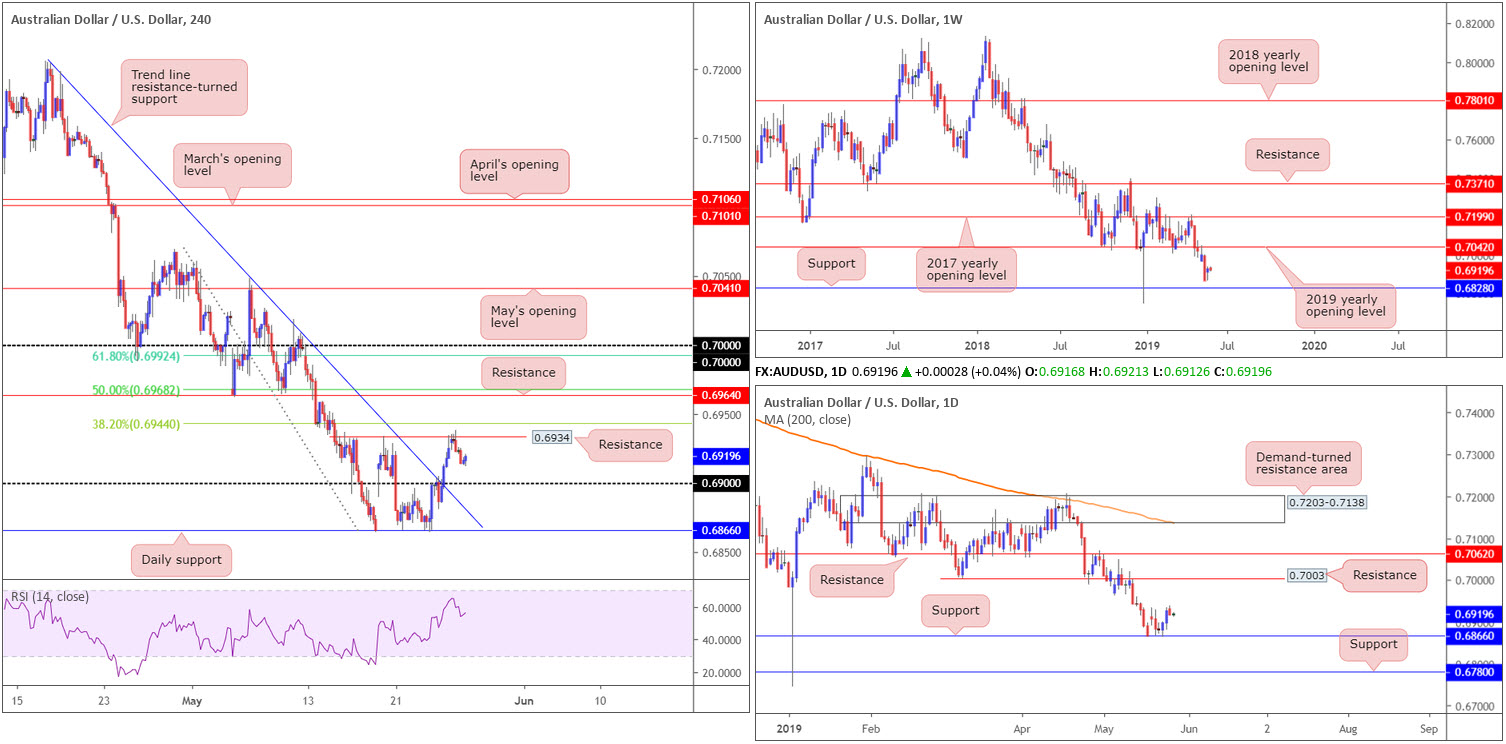
Pessimism surrounding global trade and politics, an absence of macroeconomic data and US banks closing in observance of Memorial Day, kept the AUD/USD within a thin range between 0.6938/0.6913 Monday.
Technically, the H4 candles found a ceiling off resistance at 0.6934, with the next downside target on this scale set to emerge around the 0.69 handle. Above 0.6934, the H4 scale has a number of resistances worthy of note:
- The 38.2% Fibonacci resistance at 0.6944.
- The 50.0% resistance value at 0.6968, which happens to align with resistance at 0.6964.
- The 61.8% Fibonacci resistance value at 0.6992 – lines up nicely with the key figure 0.70. Note also we have daily resistance offering a potential ceiling close by at 0.7003.
Structure on the higher timeframes show weekly price has eyes on 0.6828 as possible support this week, and resistance by way of the 2019 yearly opening level at 0.7042.
Focus on the daily timeframe has now shifted to support establishing from the 0.6866 neighbourhood, with little in the way of resistance seen until connecting with 0.7003 (highlighted above). Beyond the two said levels, we have another layer of support residing around 0.6780 and an additional film of resistance at 0.7062.
Areas of consideration:
On account of the overall technical picture, the key figure 0.70 on the H4 timeframe remains of interest this week as potential resistance. Due to its neighbouring confluence (see above), active sellers likely inhabit this region. However, waiting for additional confirmation (traders then have the option of using the selected confirmation technique to structure entry/risk levels) is recommended before pulling the trigger, since there’s a chance weekly action may attempt an approach towards the 2019 yearly opening level set 40 points above 0.70 at 0.7042.
Shorter-term traders, nonetheless, may find use in the 0.69 handle as support, owing to the clear run north visible on the bigger picture. Traders interested in 0.69 as a buy are advised not to overlook the noted H4 resistances. In fact, the levels can be used to trail market action towards 0.70. Similarly, it is also advisable to wait and see how H4 action behaves off 0.69 before entering long as round numbers are prone to fakeouts (a H4 or H1 bullish candlestick formation would likely suffice).
Today’s data points: US CB Consumer Confidence.
USD/JPY:
Outlook unchanged.
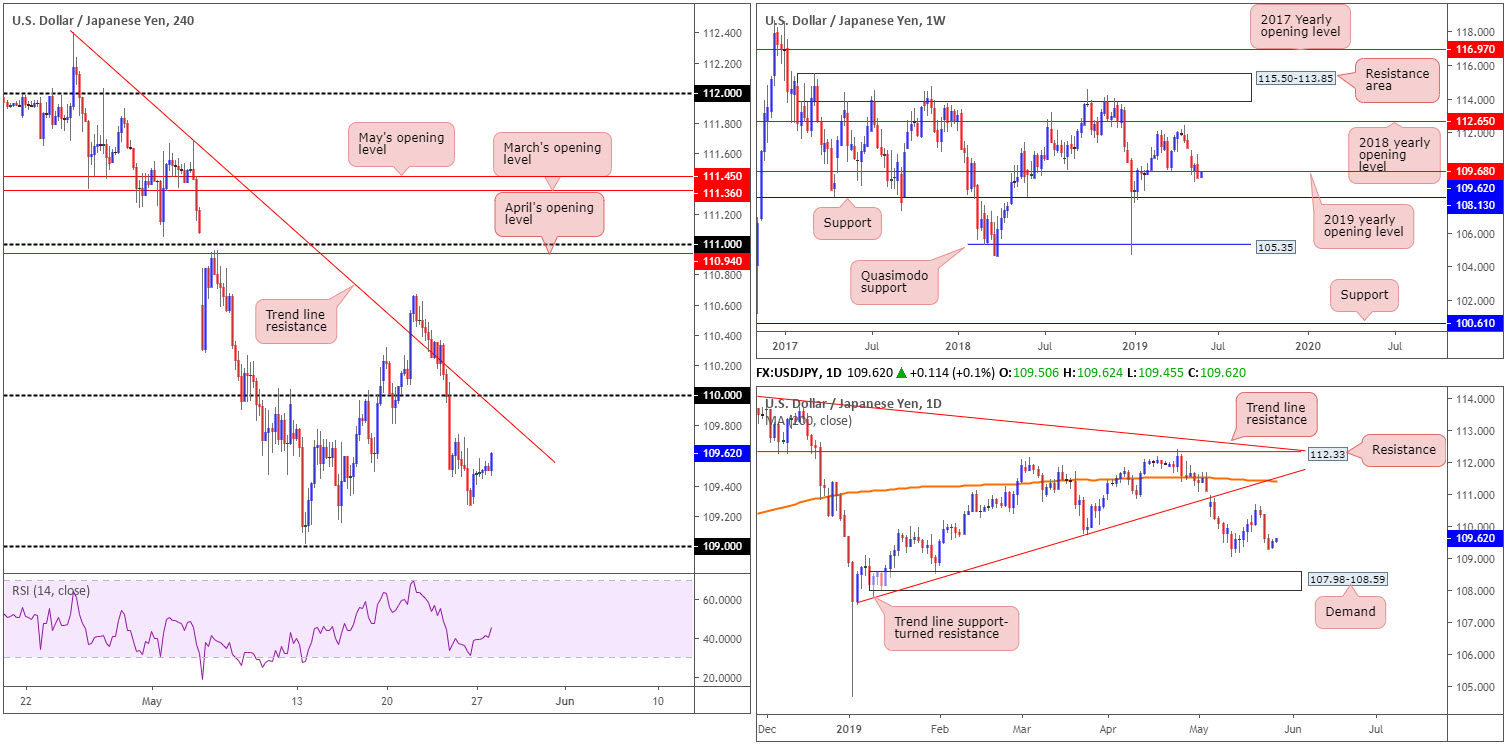
Monday, as you can see, began the session on relatively stable footing, grinding to a high of 109.58 into early European trading hours. Trading volume diminished considerably from this point amid holiday-thinned trading conditions.
In light of yesterday’s lacklustre movement, much of the following piece will echo thoughts put forward in Monday’s briefing.
Kicking things off from the weekly timeframe, the 2019 yearly opening level at 109.68 suffered a break to the downside last week. This could, assuming sellers remain in the driving seat, drive interest towards support at 108.13.
In terms of daily flow, price action appears poised to approach the 109.01 May 13 low, shadowed by a particularly interesting area of demand at 107.98-108.59. To the upside, nevertheless, traders may be interested in the trend line support-turned resistance (taken from the low 107.77) and merging 200-day SMA (orange). That is, of course, assuming the unit can overthrow last week’s high 110.67.
With 110 now a distant memory on the H4 timeframe, which happens to converge closely with a trend line resistance (extended from the high 112.40), the next calling in terms of downside targets falls in around the 109 handle.
Areas of consideration:
109 based on the H4 timeframe may offer traders a floor to buy from this week, likely to be supported by RSI oversold conditions and the 109.01 May 13 low mentioned above on the daily timeframe. However, with a daily support area seen at 107.98-108.59 likely acting as a magnet for traders on that timeframe, which holds weekly support at 108.13 within (the next downside target on the weekly timeframe), 109 is potentially a fragile support.
Shorts beneath 109, therefore, are certainly an option worth exploring should we travel this far south, targeting the top edge of the daily support area at 108.59 as the initial port of call. As always, though, a retest of the broken level is considered the higher-probability move, given fakeouts are common around psychological numbers.
Aside from the above, the research team sees limited technical structure to base high-probability setups from at this time.
Today’s data points: US CB Consumer Confidence.
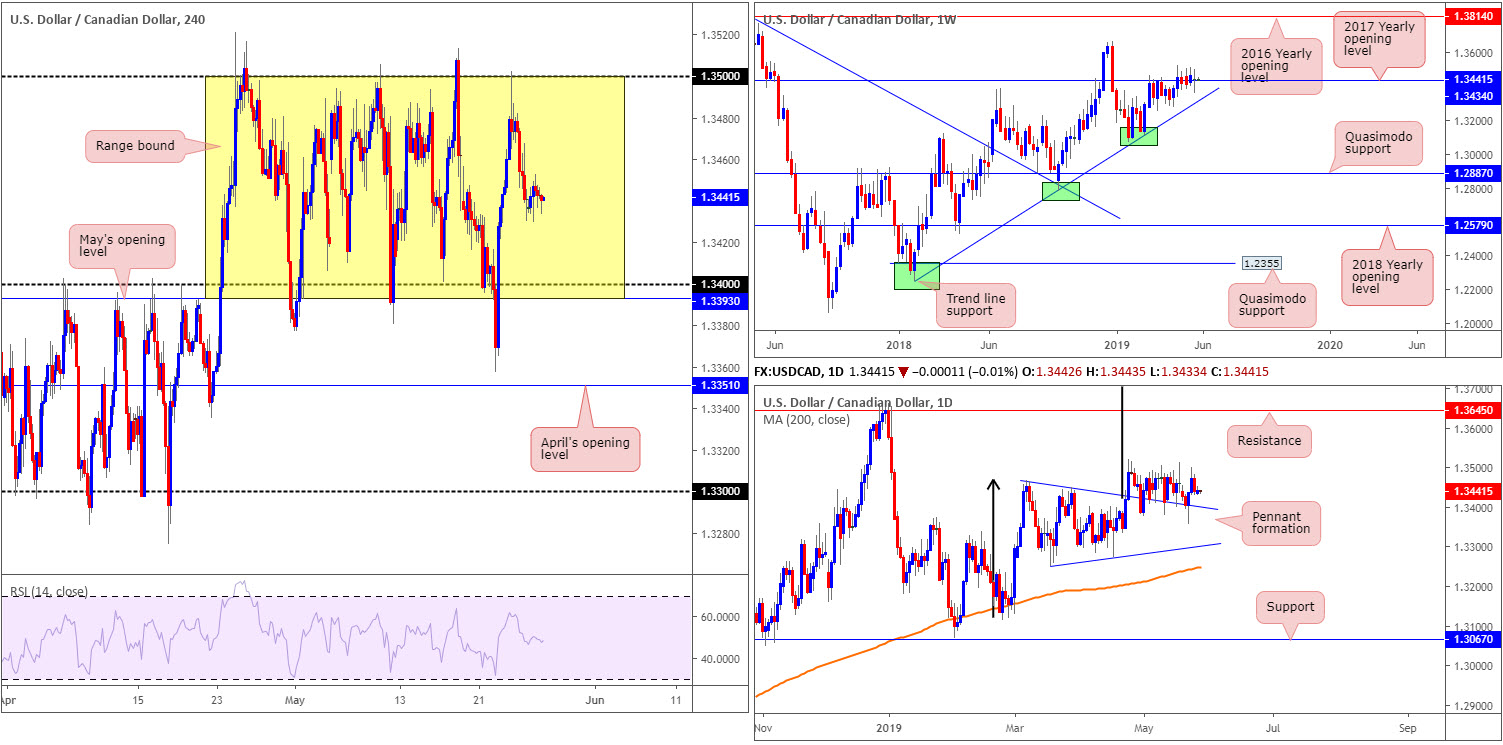
USD/CAD:
Outlook unchanged.
Price action on the USD/CAD struggled to pin down any form of short-term direction Monday, as trade remained subdued amid US banks closing in observance of Memorial Day.
With little change observed, higher-timeframe flow continues to fluctuate around the 2017 yearly opening level at 1.3434 on the weekly timeframe. Areas outside of this level to be aware of remain around the 2018 yearly high of 1.3664, and a trend line support etched from the low 1.2247.
Daily action, similar to the weekly timeframe, has experienced limited change over the past month or so. Price action shows the daily candles continue to feed off support drawn from the top edge of a pennant pattern (1.3467). Although the traditional price target (calculated by taking the distance from the beginning of the preceding move and adding it to the breakout price) remains on the chart at 1.3768 (black arrows), the next upside target from a structural standpoint falls in around resistance at 1.3645.
Overall, the H4 candles, since the latter part of April, have been busy carving out a 100-point+ range between May’s opening level at 1.3393/1.34 and the round number 1.35. Note the lower edge of this area also converges with the daily pennant support highlighted above.
Areas of consideration:
1.34/May’s opening level at 1.3393 is an area of interest on the H4 timeframe for possible longs this week. Not only does the base represent the lower edge of the current H4 range, it is also reinforced by the top edge of the daily pennant formation. For conservative traders, waiting for a H4 bullish candlestick to print from this region will help identify buyer intent and also serve as a structure to base entry and risk levels from.
In the event we continue to push higher, prior to testing 1.34ish, however, the market may observe a H4 close form above the 1.35 figure. Should a close higher occur, traders have the choice of either buying the breakout candle and placing stop-loss orders beneath its tail, or waiting and seeing if a retest scenario takes shape and entering on the back of the rejection candle’s structure. The next upside target on the H4 scale can be seen around 1.3570 (not seen on the screen), though according to the higher timeframes we could be heading much higher.
Today’s data points: US CB Consumer Confidence.
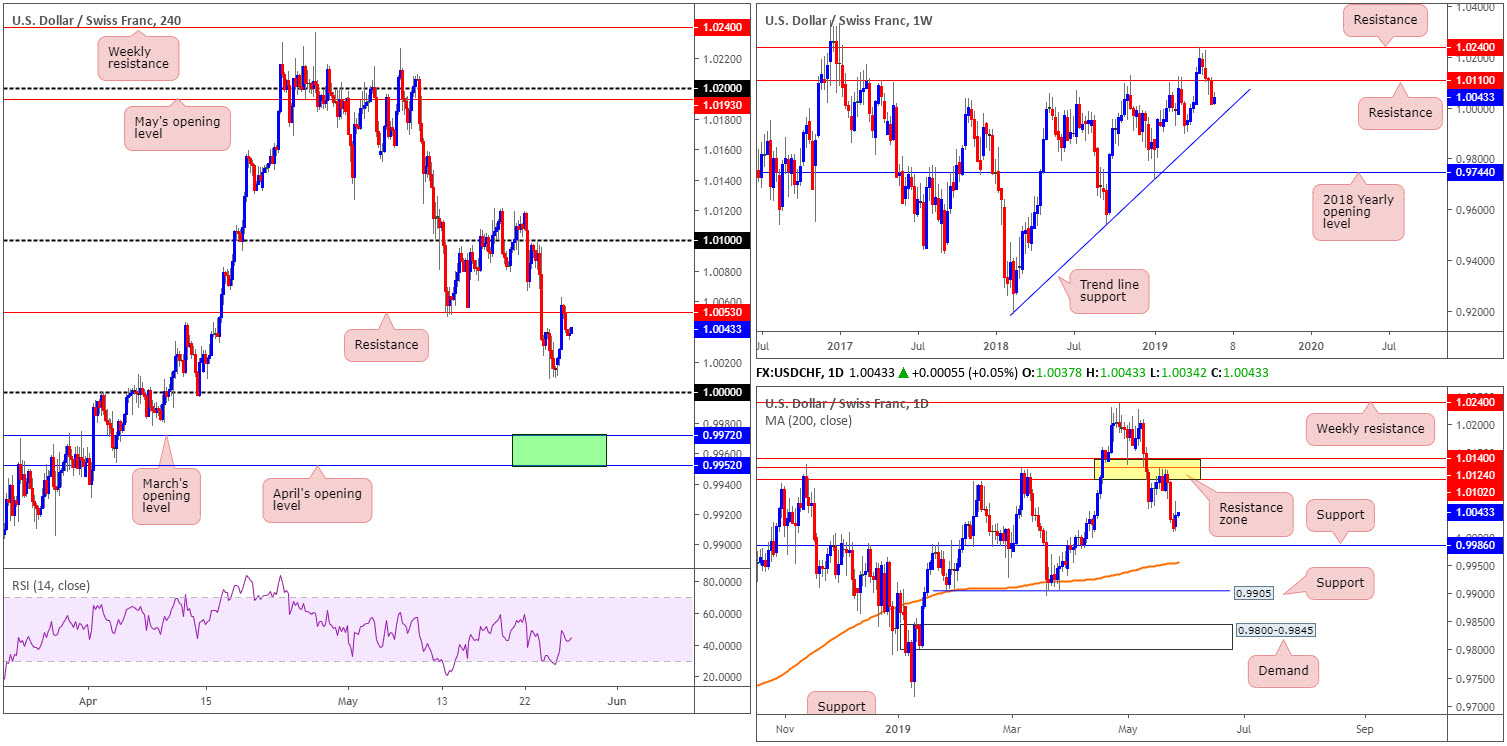
USD/CHF:
Leaving 1.0000 (parity) unchallenged, Monday’s sessions brought with it a round of buying, consequently dragging the USD/CHF towards H4 resistance coming in at 1.0053. So far this barrier has held ground, which could prompt a revisit of yesterday’s lows at 1.0010, and maybe even a test of 1.0000. In the event we continue to press northbound, nonetheless, keep eyes on the 1.01 handle as the next viable resistance point.
Branching out and exploring the higher timeframes, the research team notes weekly price continues to extend its retreat from the 2019 high 1.0236 set towards the end of May. The next downside target on this scale can be seen around trend line support (etched from the low 0.9187).
A closer analysis of price action on the daily timeframe reveals the USD/CHF rotated lower from a robust resistance zone between 1.0102/1.0140. The next area of interest can be seen around 0.9986, closely followed by the 200-day SMA (orange).
Areas of consideration:
The 1.01 handle is a point of resistance worth watching for possible shorting opportunities, having seen the number fuse with the lower edge of the current daily resistance area at 1.0140/1.0102.
1.0000 is also likely an area on many traders’ watchlist today. The number boasts additional backing from daily support at 0.9986.
In the event 1.0000 fails to offer a floor, all eyes will then likely turn to the green area marked on the H4 timeframe at 0.9952/0.9972. Comprised of two monthly opening levels (April and March), a merging 200-day SMA and potential convergence from the weekly trend line support underlined above, the research team feels active buyers likely reside here.
Regardless of the buy/sell zone selected, traders are urged to consider waiting for additional candlestick confirmation to take shape before taking action. Not only will this help limit unnecessary losses, it’ll help identify buyer/seller intent and provide traders a structure to work with for entry and risk levels.
Today’s data points: US CB Consumer Confidence.
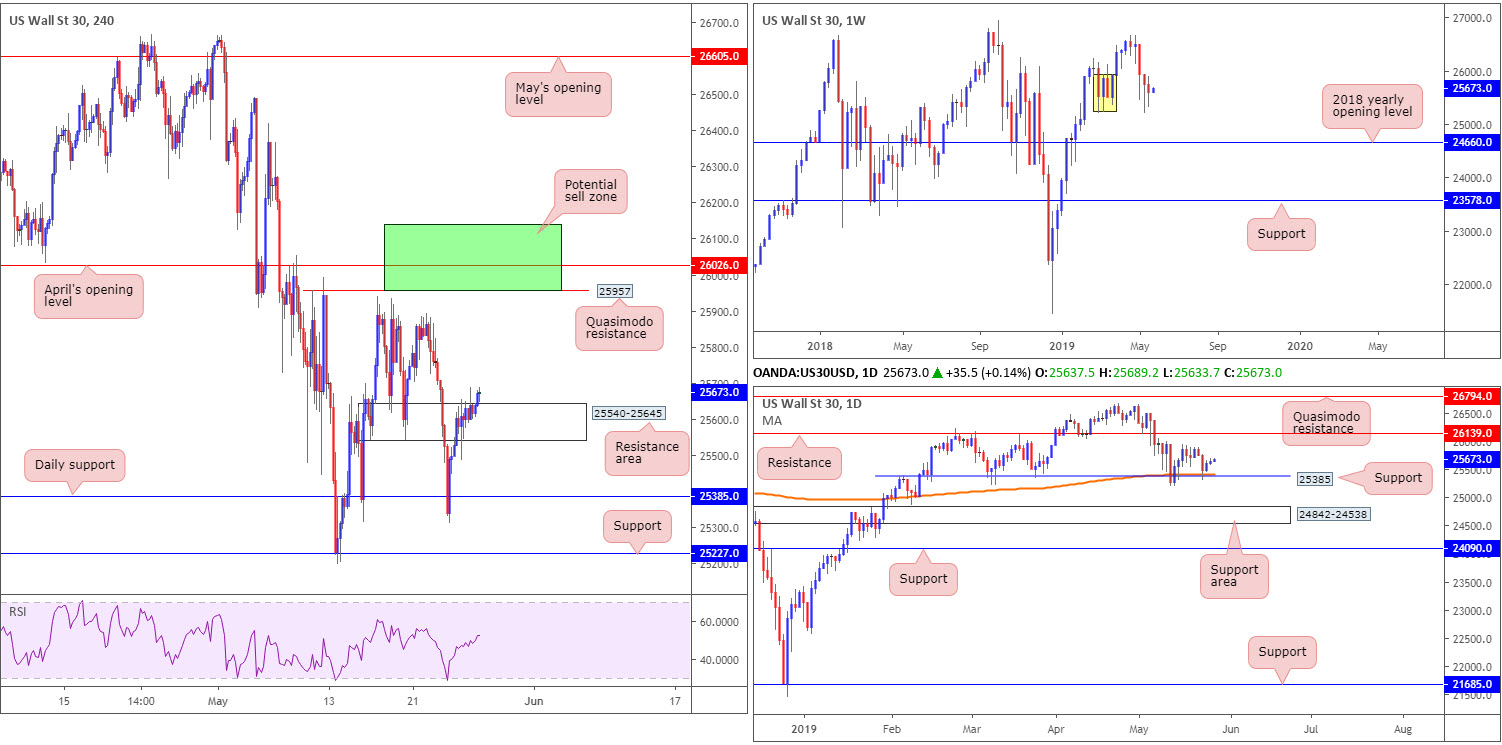
Dow Jones Industrial Average:
Outlook unchanged.
US equities, as expected, entered a subdued state Monday as US banks closed in observance of Memorial Day. In recent hours, though, we have seen the H4 candles grind their way through a resistance area coming in at 25540-25645. With this area potentially out of the picture, upside is likely to be confirmed at least until the candles touch gloves with H4 Quasimodo resistance at 25957. Note beyond this Quasimodo formation we also have April’s opening level at 26026.
From a weekly perspective, demand marked in yellow at 25217-25927, although unlikely to be considered a strong area on this timeframe owing to limited momentum produced from the base, remains in the fold. Should this entice buyers into the market, we could be looking at a run towards the 26668 April 22 high, while a move to the downside has the 2018 yearly opening level to target at 24660.
In conjunction with weekly activity, daily movement recently shook hands with notable support at 25385, which happens to intersect with the 200-day SMA. Technically, this may provide a platform for buyers to enter the market, with the next upside point of interest falling in at resistance fixed from 26139. Failure of 25385, nonetheless, has a support area at 24842-24538 in view.
Areas of consideration:
In light of the current technical picture, the research team notes a retest play could materialise from the H4 resistance area-turned support. The H4 close above this area that’s followed up with a retest (preferably in the shape of a H4 bullish candlestick configuration – entry/risk can be determined according to this structure) would, given higher-timeframe direction, likely be enough to draw in buyers.
Another area the research team are particularly fond of is the green zone plotted on the H4 timeframe between 26139 (the daily resistance level) and 25957 (H4 Quasimodo resistance).
Today’s data points: US CB Consumer Confidence.
XAU/USD (GOLD):
Outlook unchanged.
Although bullion concluded Monday’s segment unchanged (+0.02%), recent hours has seen the metal explore lower ground vs. the US dollar.
H4 supply at 1288.9-1284.8, as is evident from the chart, held price action lower and is forcing a test of May’s opening level at 1282.6. A violation of this monthly band could eventually drag the candles as far south as demand plotted at 1268.1-1272.8, shadowed closely by support pencilled in at 1266.1.
The story on the bigger picture has seen weekly price fluctuate around its 2019 yearly opening level at 1282.2 for the past six weeks. A push higher from here has the 2018 yearly opening level at 1302.5 to target, whereas a push lower has support at 1260.8 in sight.
The daily support area at 1272.5-1261.5 – boasts a reasonably solid history and merges with a trend line support taken from the low 1160.3 – held things higher last week, most notably on Thursday registering +0.79%. Continued buying from this point has the 1303.4 May 14 high as the next possible resistance.
Areas of consideration:
Although the current H4 supply boasts notable strength to the downside from its base, the technical strength behind the area likely lies behind the 2019 yearly opening level in motion on the weekly timeframe at 1282.2. Those short from this zone, however, are facing opposition from both May’s opening level at 1282.6 and daily players attempting to extend gains from the aforesaid support area/trend line support combination.
Swing traders considering the current H4 supply as a base to short from this week might want to allow sellers to prove their worth before pulling the trigger. A decisive H4 close beneath 1282.6, followed up with a successful retest of the level, should suffice, therefore clearing the pathway south towards H4 demand plotted at 1268.1-1272.8 (seen around the top edge of the current daily support area).
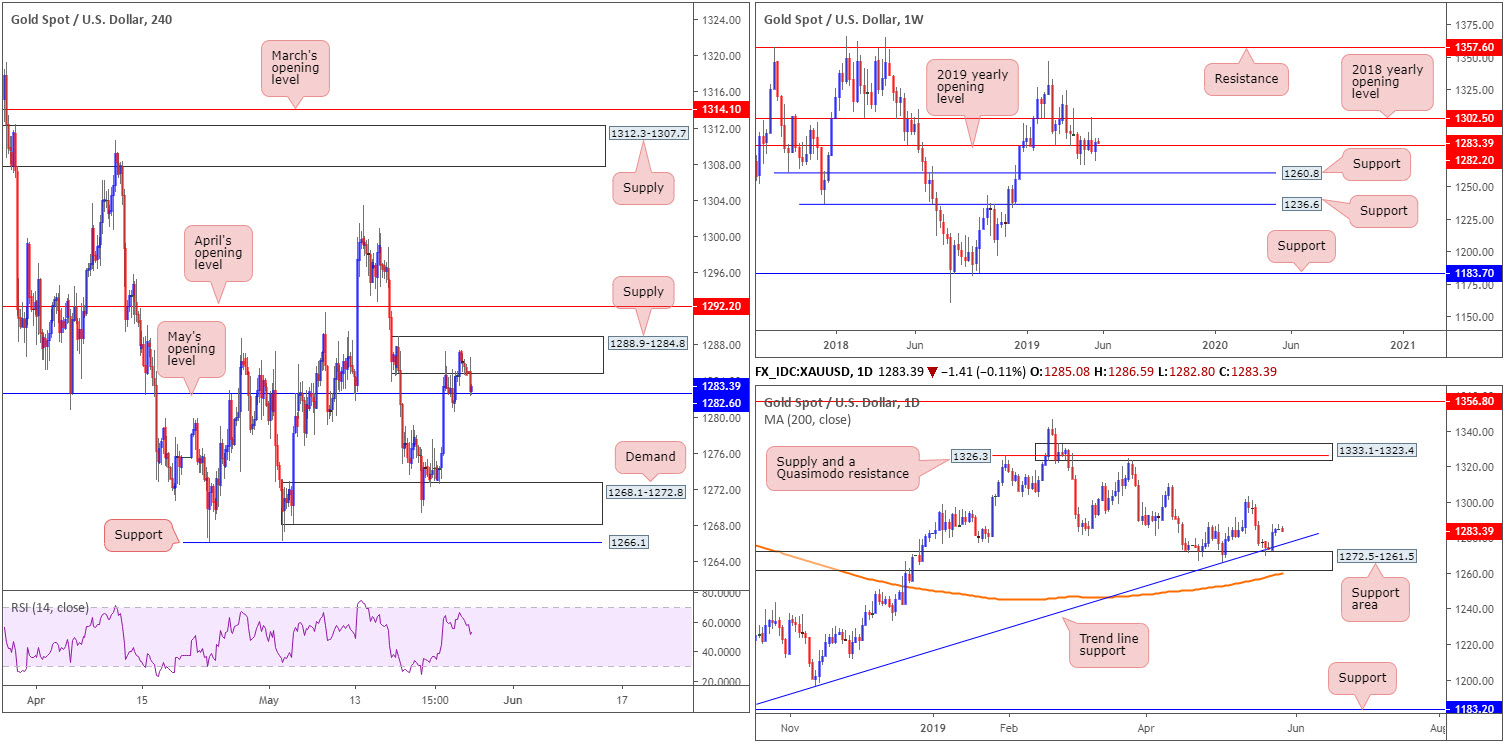
The accuracy, completeness and timeliness of the information contained on this site cannot be guaranteed. IC Markets does not warranty, guarantee or make any representations, or assume any liability with regard to financial results based on the use of the information in the site.
News, views, opinions, recommendations and other information obtained from sources outside of www.icmarkets.com.au, used in this site are believed to be reliable, but we cannot guarantee their accuracy or completeness. All such information is subject to change at any time without notice. IC Markets assumes no responsibility for the content of any linked site. The fact that such links may exist does not indicate approval or endorsement of any material contained on any linked site.
IC Markets is not liable for any harm caused by the transmission, through accessing the services or information on this site, of a computer virus, or other computer code or programming device that might be used to access, delete, damage, disable, disrupt or otherwise impede in any manner, the operation of the site or of any user’s software, hardware, data or property.


