
Key risk events today:
Spanish Unemployment Rate; US CB Consumer Confidence.
(Previous analysis as well as outside sources – italics).
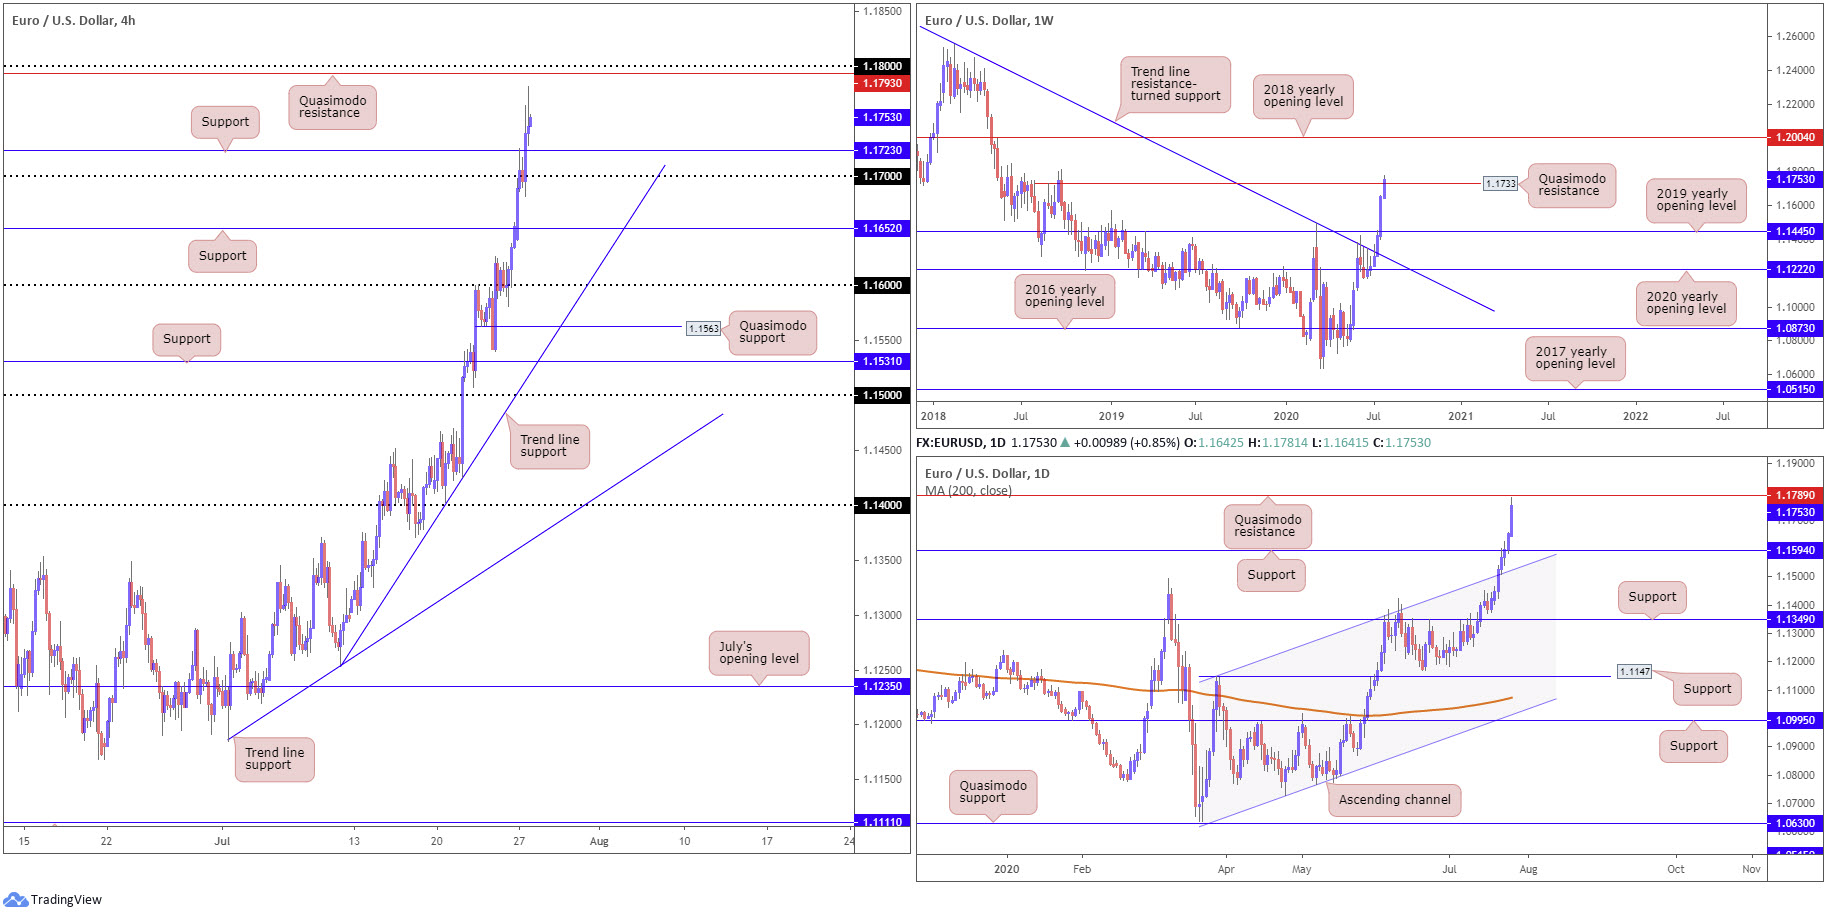
EUR/USD:
Marginally better-than-expected US durable goods data failed to offer the US dollar index much respite Monday, dipping through 93.50 and recording a seventh consecutive losing session. EUR/USD, based on the H4 timeframe, powered above 1.17 and took over resistance at 1.1723 (now serves as support), consequently shining the spotlight on Quasimodo resistance parked at 1.1793 and the 1.18 handle.
Assembling a fifth consecutive weekly gain last week, longer-term activity on the weekly timeframe recently shook hands with Quasimodo resistance at 1.1733. A breach here shifts focus to the 2018 yearly opening level as far north as 1.2004, while a rejection could send things back to the 2019 yearly opening level at 1.1445.
In the shape of seven consecutive bullish candles, price action on the daily timeframe Monday extended space north of support at 1.1594 by more than 100 pips and is now within touching distance of Quasimodo resistance at 1.1789.
Areas of consideration:
According to chart studies, buyers continue to play with a strong hand. Weekly price shows signs of engulfing Quasimodo resistance at 1.1733, while daily is not expected to meet resistance until 1.1789. This leaves trade free on the H4 timeframe to perhaps retest support at 1.1723 and make a run for Quasimodo resistance at 1.1793/1.18 handle. However, traders are urged to pencil in the possibility of a fakeout through 1.1723 to 1.17 before buyers perhaps make an appearance.
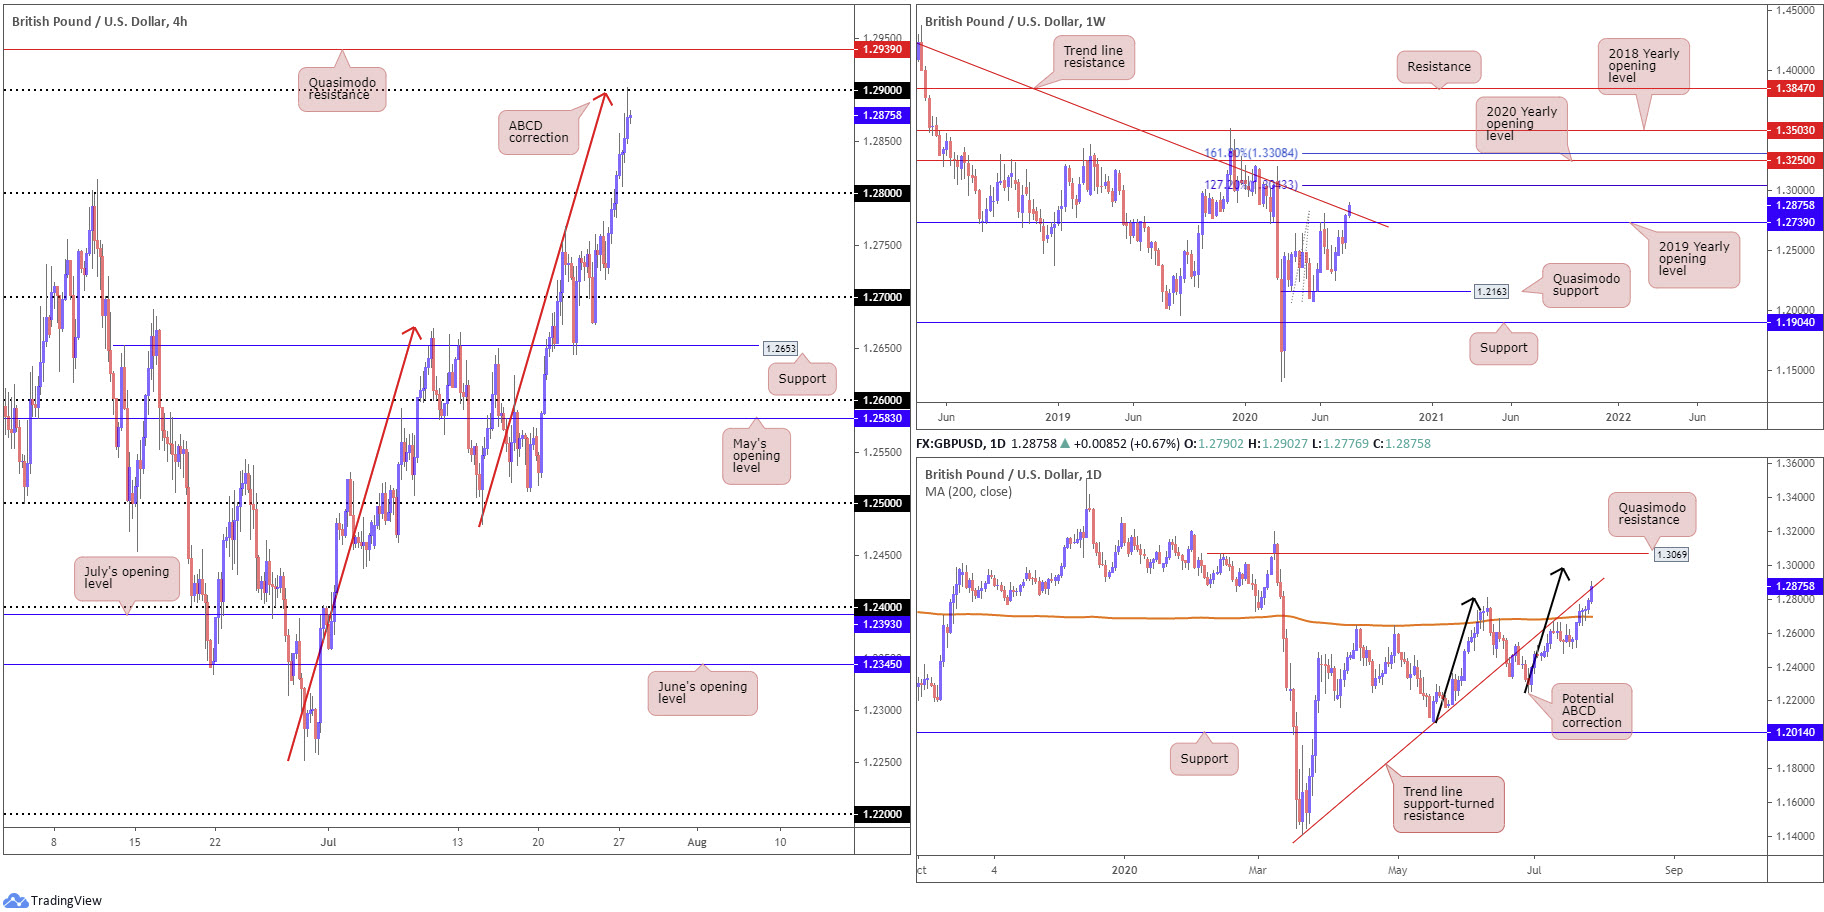
GBP/USD:
The persistent downbeat tone across dollar markets Monday amid concerns regarding the resurgence of COVID-19 cases and its impact on the economy elevated GBP/USD to highs at 1.2902, near five-month peaks.
H4 technical action witnessed price occupy 1.29, along with an ABCD completion at 1.2896 (red arrows). 1.29 holds for the time being, though whether the aforementioned technical components forces a retreat to 1.28 is difficult to estimate. Climbing above 1.29 leans things towards Quasimodo resistance at 1.2939.
Further afield, weekly flow is confronting long-term trend line resistance, extended from the high 1.5930, with a break exposing the 127.2% Fibonacci extension point at 1.3043. This comes after a decisive breach of the 2019 yearly opening level at 1.2739 last week. Readers will also want to acknowledge daily movement crossed into trend line support-turned resistance, taken from the low 1.1409. Failure to cap upside here will have some traders looking for ABCD (black arrows) completion around 1.2982ish, closely plotted south of Quasimodo resistance at 1.3069.
Areas of consideration:
The recent trend line (resistance) break on the weekly timeframe threatens sellers off 1.29/H4 ABCD completion, and daily trend line support-turned resistance, taken from the low 1.1409. In the event a dip lower occurs, nonetheless, 1.28 psychological support is in the firing range on the H4.
H4 closing above 1.29 could stimulate buying activity, targeting H4 Quasimodo resistance at 1.2939 as an initial take-profit zone, followed by the daily ABCD pattern at 1.2982.
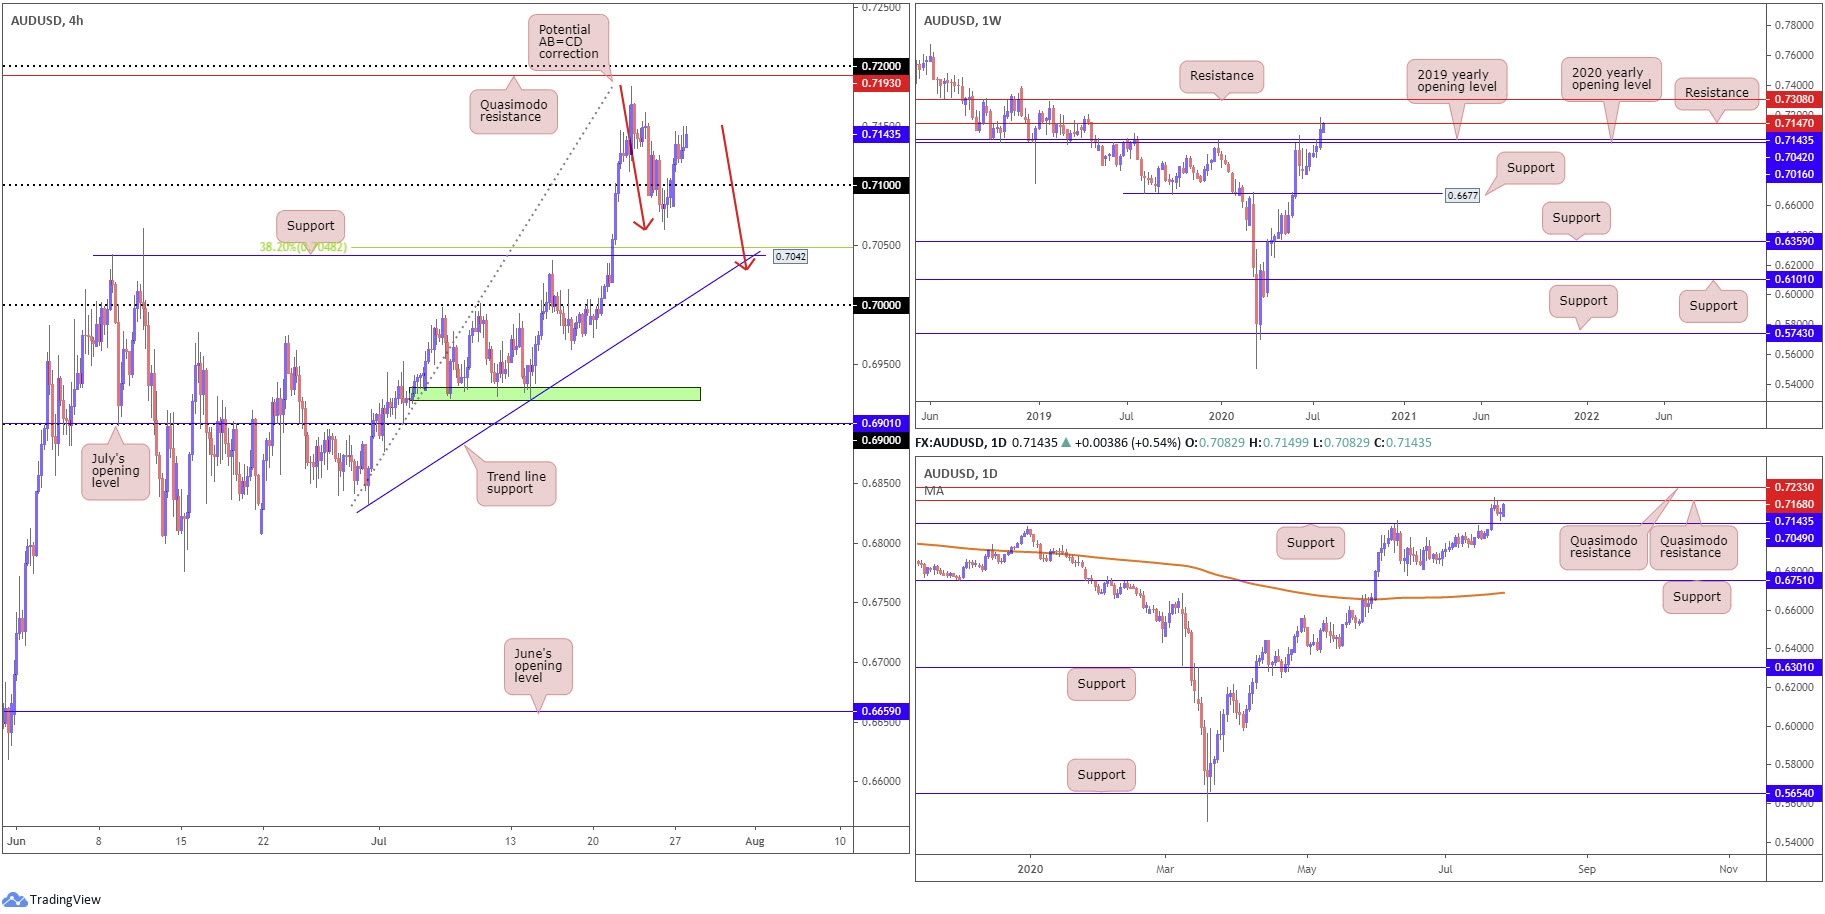
AUD/USD:
The Australian dollar continued to gather impetus via the demise of its US counterpart Monday, taking the currency pair back above 0.71. H4 bulls now have eyes on Quasimodo resistance at 0.7193, followed by the 0.72 handle. South of 0.71, however, its still worth highlighting nearby support at 0.7042 (a prior Quasimodo resistance) and the 38.2% Fibonacci retracement ratio at 0.7048.
Higher up on the curve, traders will acknowledge weekly price crossing swords with resistance at 0.7147, after chiselling through the 2020 and 2019 yearly opening levels at 0.7016 and 0.7042, respectively, last week. A violation of 0.7147 could see a play for resistance parked at 0.7308.
A closer reading of price action on the daily timeframe reveals the unit to be fading Quasimodo resistance at 0.7168, sited south of another Quasimodo resistance at 0.7233. Note 0.7168 forms a reasonably close connection with weekly resistance mentioned above at 0.7147.
Areas of consideration:
H4 longs north of 0.71, in hope of continued buying, face weekly and daily resistances right now at 0.7147 and 0.7168, respectively. The downside pressure may even squeeze out another break through 0.71 to H4 support at 0.7042 and produce an attractive AB=CD bullish construction at around 0.7029ish (red arrows).
Interestingly, north of 0.72, buyers have room to manoeuvre on the weekly timeframe to 0.7308, though remains hindered on the daily timeframe at resistance from 0.7233.
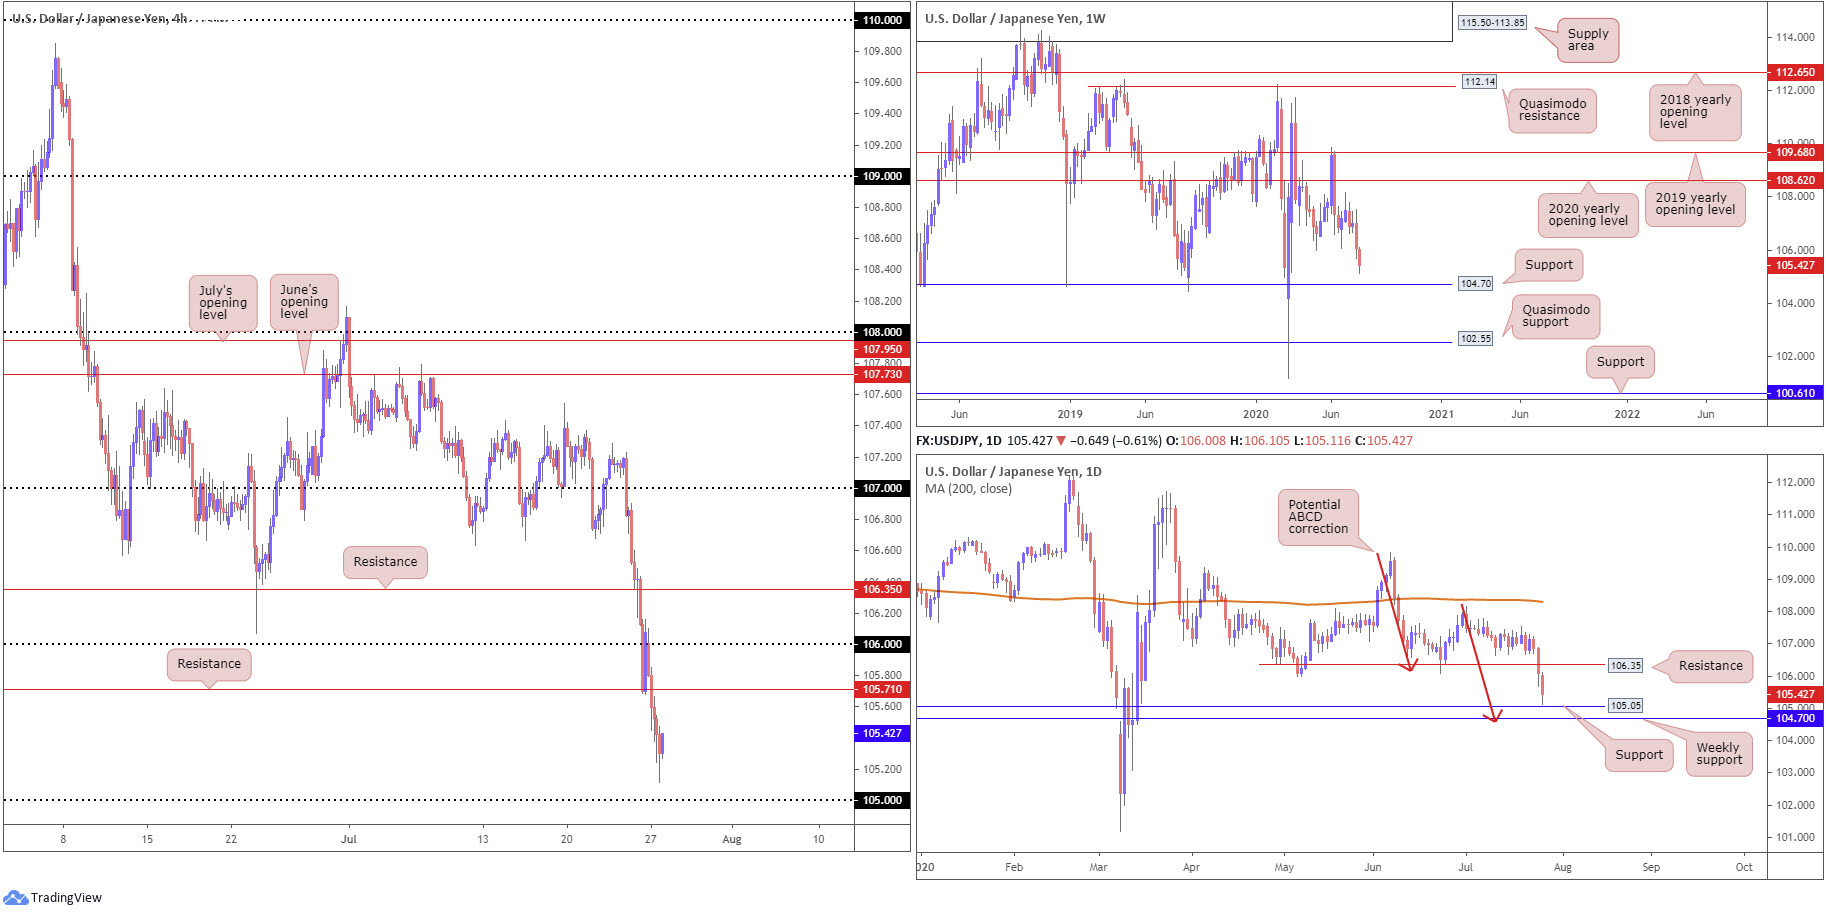
USD/JPY:
The ongoing selling pressure surrounding the US dollar Monday guided USD/JPY south of 106 and H4 Quasimodo support at 105.71 (now serves as resistance), bringing light to the 105 handle as the next possible support.
Friday, as evident from the daily chart, tunnelled through Quasimodo support at 106.35 (now serving as resistance), likely running sell-stops. This, coupled with Monday’s decline, draws attention to support at 105.05, located just ahead of weekly support at 104.70, the next downside target based on the weekly chart. What’s also notable from a technical perspective on the daily timeframe is a potential ABCD bullish correction (red arrows) that completes around the aforementioned weekly support level.
Areas of consideration:
For those who read Monday’s technical briefing you may recall the following (italics):
Traders are unlikely to put much weight into the recovery off Quasimodo support (105.71) on the H4, having seen both weekly and daily timeframes recently clearing support. While retaking 106 to the upside could excite buyers, the upper limit here is likely to be fixed at daily resistance from 106.35.
With the above in mind, 106.35 is perhaps a watched resistance this week, with sellers from here to potentially try and join moves to daily support plotted at 105.05. Conservative traders, of course, may still seek additional confirmation before engaging.
As you can see, buyers failed to even make it past 106 before nosediving to waters north of daily support at 105.05.
Going forward, technicians are likely watching for a recovery attempt to form between 104.70/105.05, the weekly support at 104.70, daily support at 105.05 and the 105 handle on the H4. Should a retest at H4 resistance from 105.71 take shape before connecting with the aforementioned support zone, this may encourage sellers into the fight.
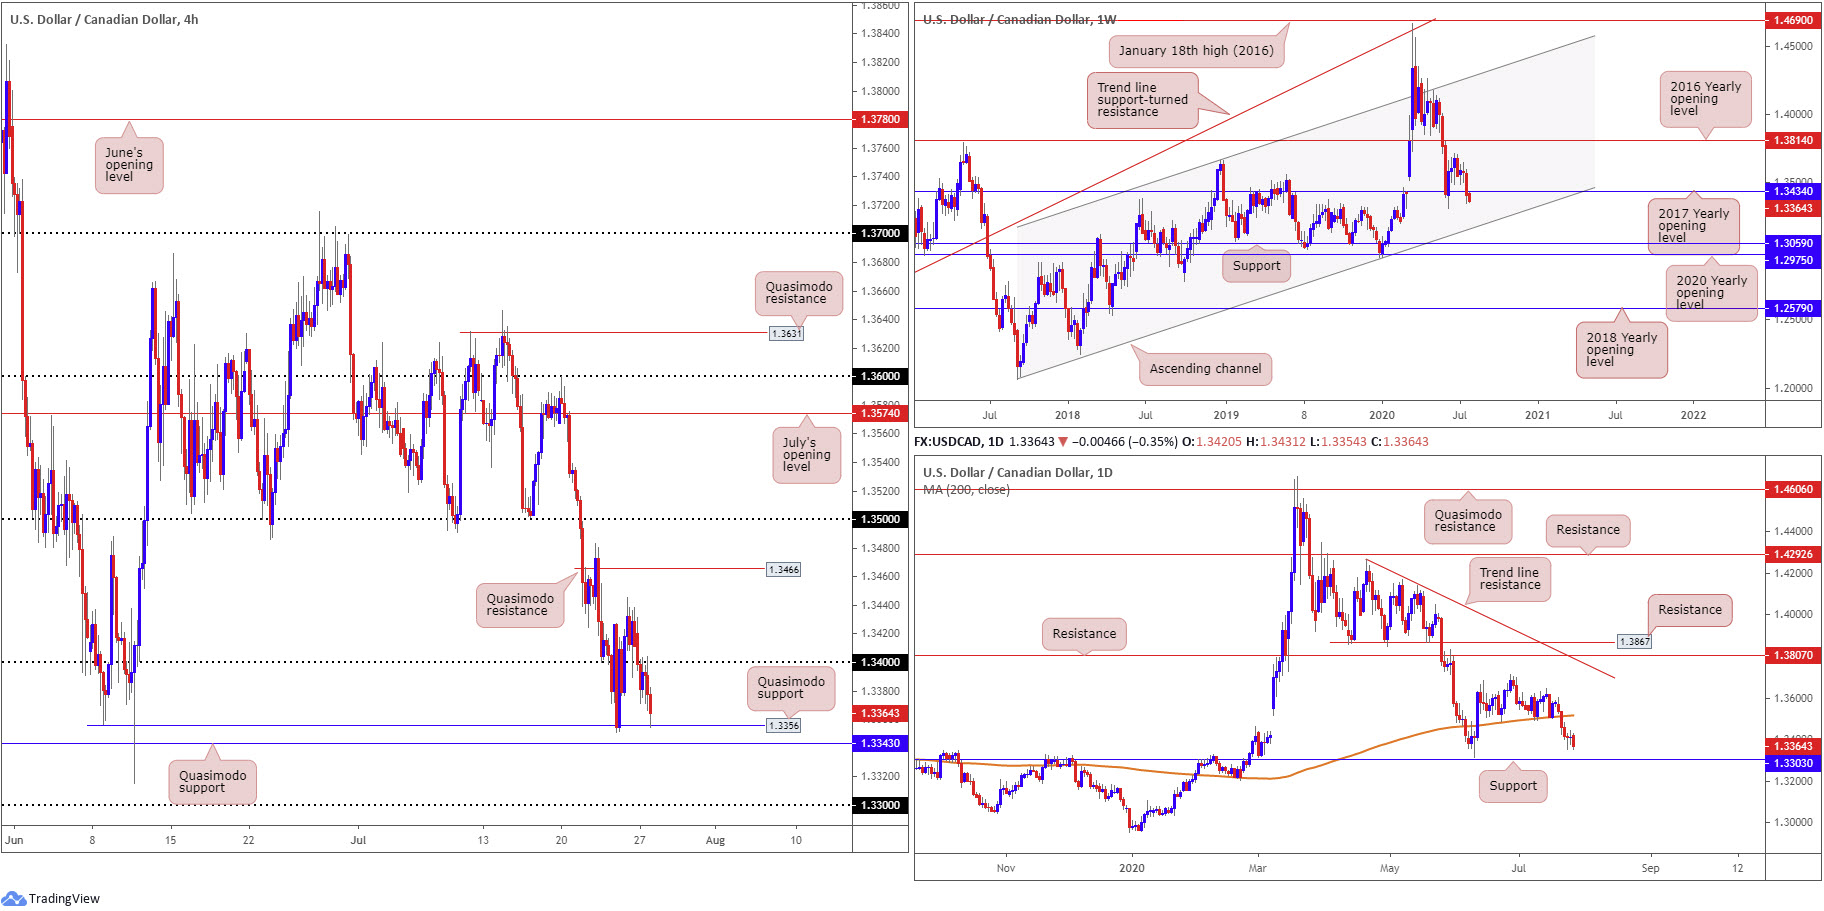
USD/CAD:
Following end-of-week indecision (see daily candles), the US dollar nudged lower against the Canadian dollar Monday and dipped back through 1.34, retesting the latter as resistance and bringing in H4 Quasimodo support at 1.3356 by the close.
Traders will also acknowledge just south of the current Quasimodo support we have another layer of Quasimodo support at 1.3343, with a break likely to have candles drive towards 1.33. Multi-timeframe analysis reveals structural action on the daily timeframe also has support positioned at 1.3303, bringing forward an interesting history as support/resistance since early 2016.
Support, by way of the 2017 yearly opening level, from 1.3434 on the weekly timeframe exhibits signs of breakability. Below 1.3434, channel support, taken from the low 1.2061, can be viewed as the next potential floor. A USD/CAD bid, nevertheless, carries light to the 2016 yearly opening level at 1.3814 as resistance, with follow-through buying to try and tackle a dense block of supply between 1.4190/1.3912.
Areas of consideration:
Exploring territory beneath 1.3434 on the weekly timeframe reflects a bearish tone in this market. Against the backdrop of higher timeframe movement, though, a bullish reaction from daily support at 1.3303 could still be in the offing, joined with the 1.33 handle on the H4.
On the basis of a break through 1.3343 on the H4 today, therefore, intraday sellers may also try and take advantage of the space between the aforementioned level and 1.33.
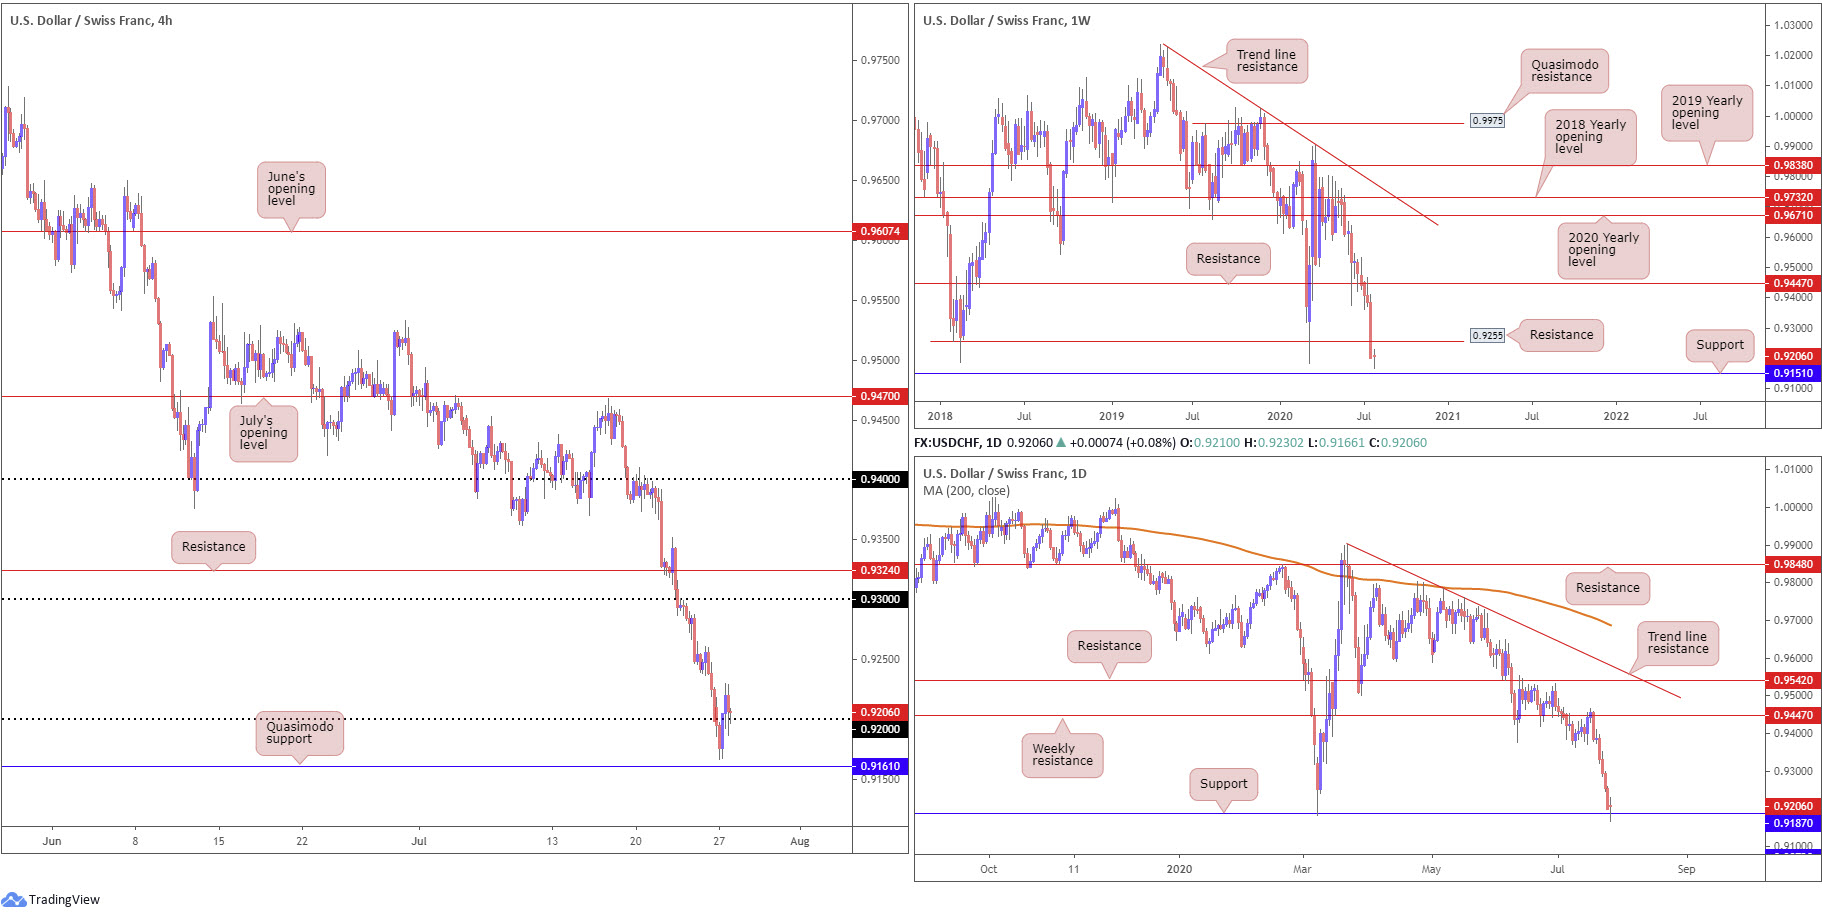
USD/CHF:
For those who read Monday’s technical briefing you may recall the following (italics):
Owing to the extremely oversold conditions right now, a fakeout through 0.92 could come to life today/early week and test daily support at 0.9187. A H4 close back above 0.92 may stimulate buying. Alternatively, a break of 0.92 and daily support at 0.9187 could steer intraday breakout sellers into weekly support at 0.9151, and by extension the H4 Quasimodo support at 0.9161.
As evident from the H4 chart this morning, price surpassed 0.92 and shook hands with daily support at 0.9187, resulting in a H4 close back above 0.92. What’s also interesting is H4 price is currently retesting 0.92 as support, as we write. Despite buyers establishing some presence yesterday, the threat of a dip to weekly support at 0.9151 is still present.
Areas of consideration:
Keeping things simple this morning, should H4 hold the 0.92 retest by way of a bullish candlestick formation, this could be enough to pull in buyers and at least make a play for 0.9250ish, which happens to join closely with weekly resistance coming in from 0.9255 (a prior Quasimodo support recently breached).
Failure to hold 0.92 signals weekly support at 0.9151 is perhaps next on the hit list.
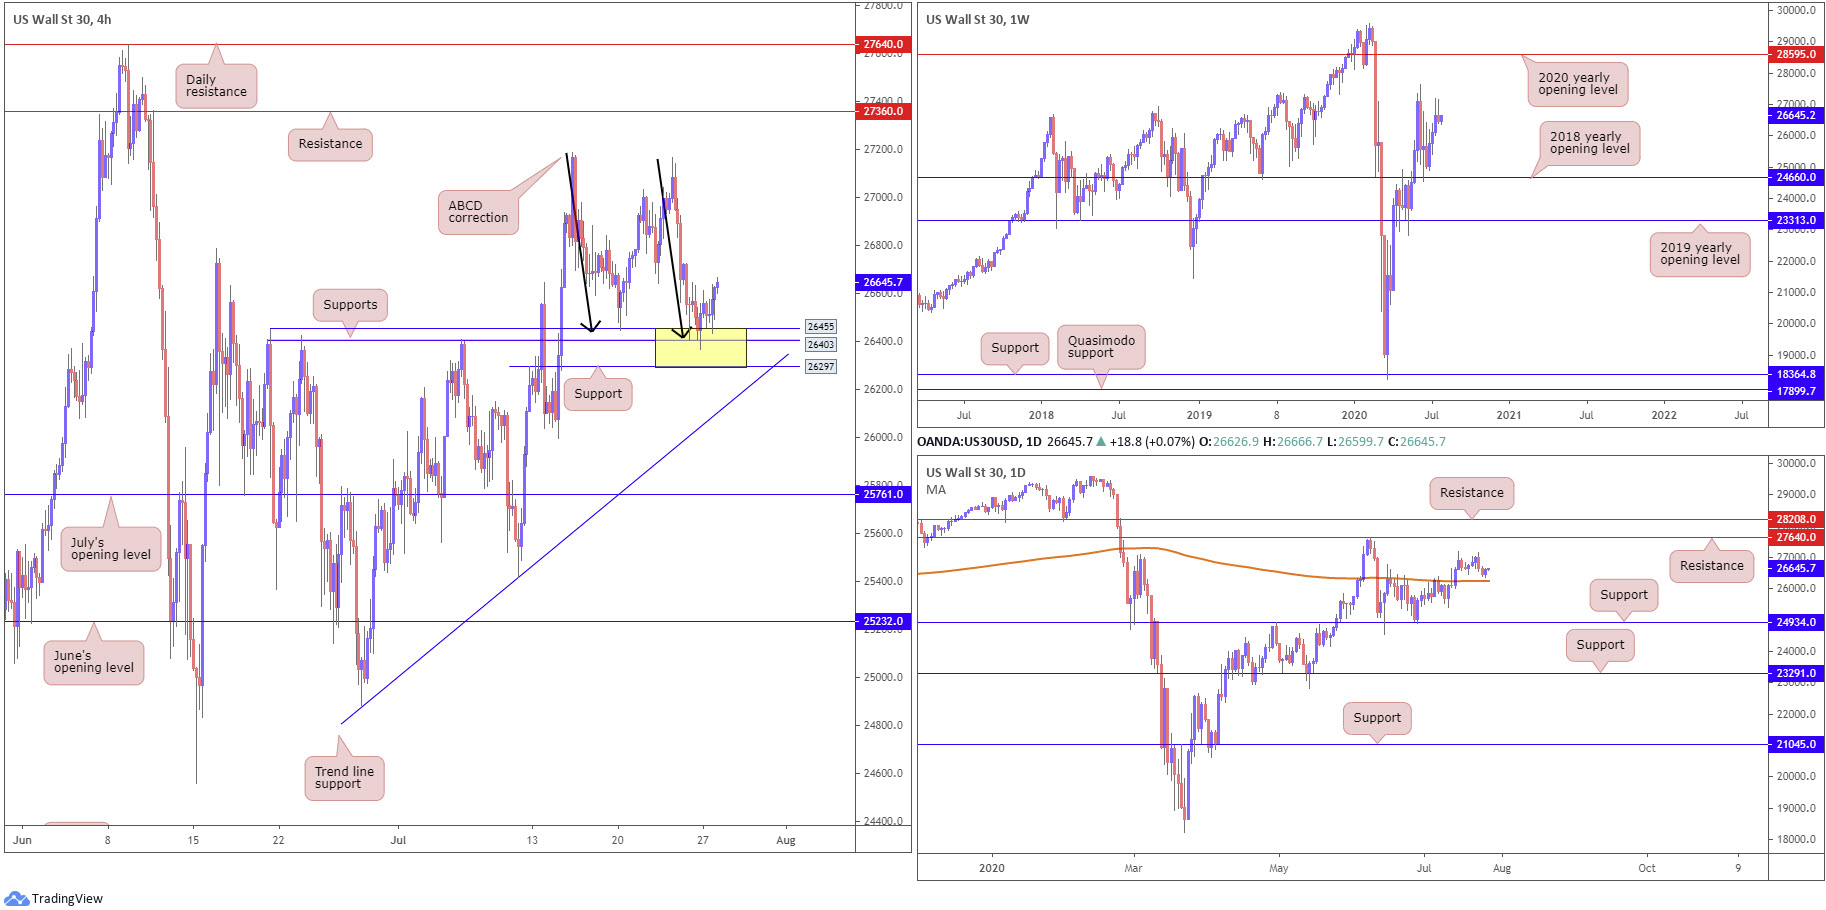
Dow Jones Industrial Average:
Major US equity benchmarks finished higher across the board Monday, as investors brace for a busy week of earnings. The Dow Jones Industrial Average advanced 114.88 points, or 0.43%; the S&P 500 rallied 23.78 points, or 0.74%, and the tech-heavy Nasdaq 100 concluded lower by 191.24 points, or 1.82%.
As can be seen from the H4 timeframe, the candles are establishing a modest bottom out of 26297/26455, joined with a H4 ABCD bullish correction (black arrows) at 26417 (this was a noted zone to watch in previous analysis). Areas of resistance to the upside can be seen at 27360, assuming we pass 27167 peaks.
The 2018 yearly opening level at 24660 remains intact on the weekly timeframe and is an important base of support to keep eyes on. Traders are likely to eventually pull in the 27638 high, despite last week’s modest pullback snapping a three-week bullish phase, followed by a possible run to the 2020 yearly opening level at 28595.
Since climbing above the 200-day SMA (orange – 26248) on July 14, daily price has been attempting to gain a foothold and approach resistance at 27640.
Areas of consideration:
With 26297/26455 making an appearance on the H4, this area, as expected, is beginning to gather some interest. Intraday, buyers will likely be watching for 26730 to be taken before targeting 27167 peaks.
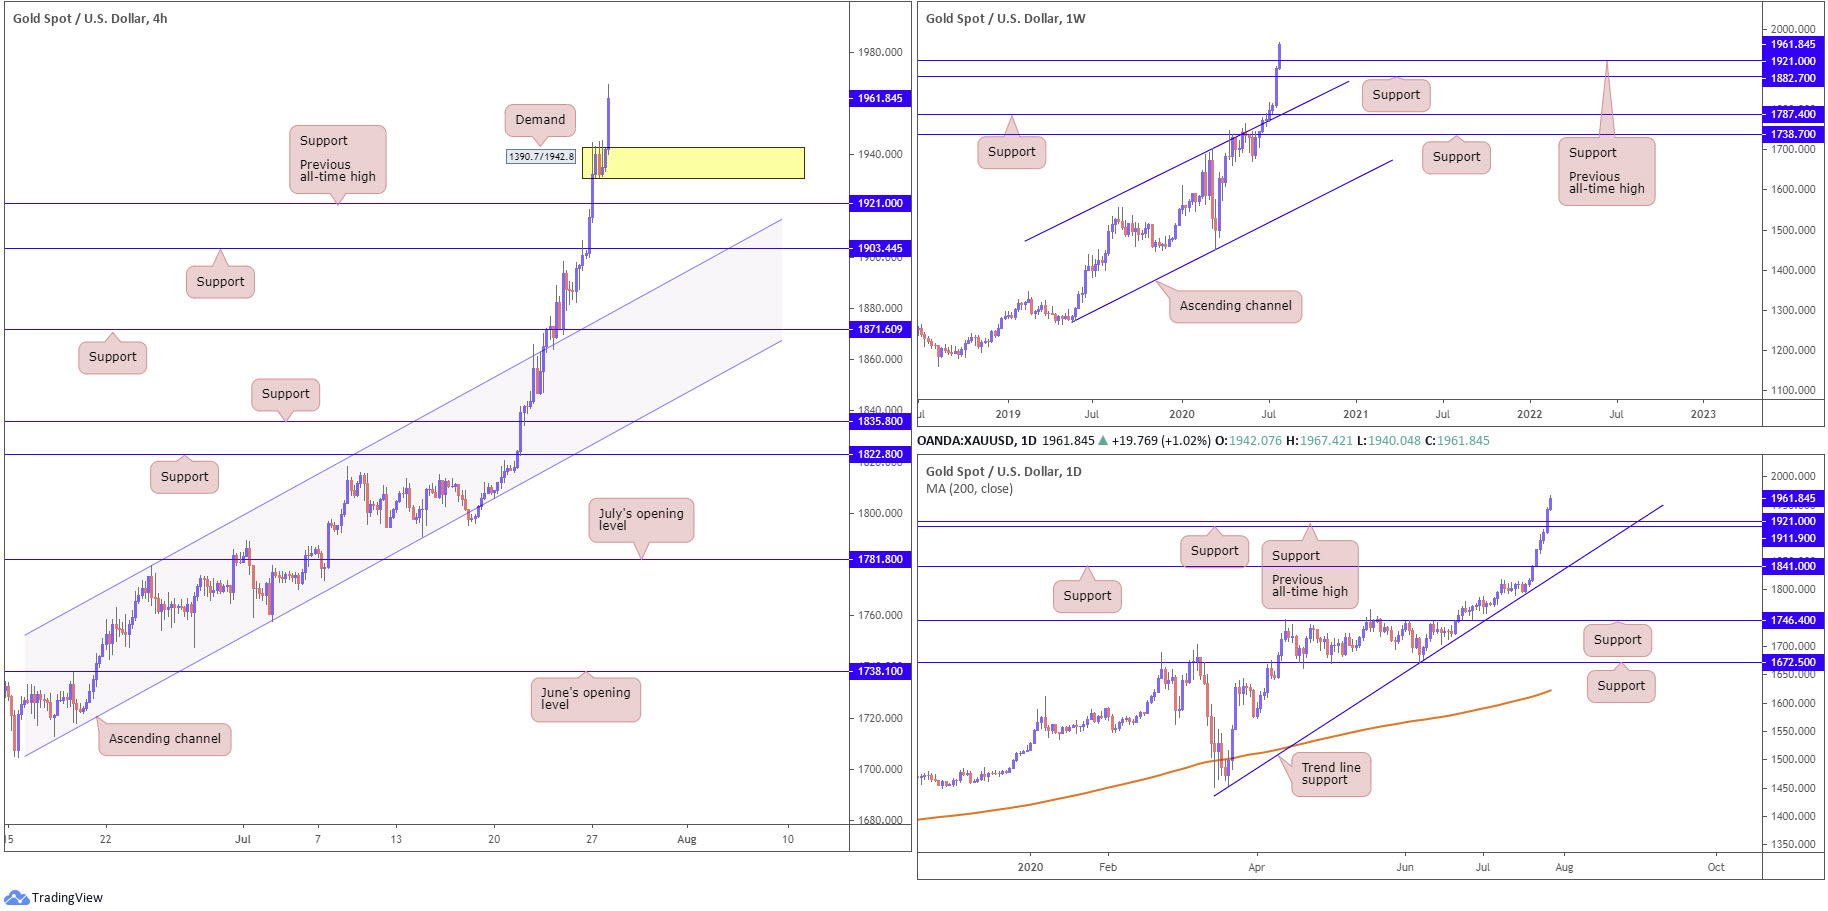
XAU/USD (GOLD):
The yellow metal kicked off the week in fine form, benefitting from a soft USD as well as deteriorating US/China relations.
Monday witnessed bullion jump to fresh all-time highs at 1967.4.
With price trading in unchartered territory, H4 demand at 1390.7/1942.8 could welcome a pullback today. However, traders will also be watching the recently penetrated all-time high at 1921.0 as a potential area of support. As things stand, this could result in the aforementioned demand ceding ground.
Areas of consideration:
In light of recent optimism, buyers are likely seeking bullish scenarios going forward.
A dip to H4 demand at 1390.7/1942.8, supported by a H4 bullish candlestick configuration, may encourage moves higher.
Another setup, as briefly underlined above, is a dip through noted H4 demand to support at 1921.0 (previous all-time high). The whipsaw through demand would also fill any sell-stop-liquidity, essentially providing some fuel for a potential lift higher.
The accuracy, completeness and timeliness of the information contained on this site cannot be guaranteed. IC Markets does not warranty, guarantee or make any representations, or assume any liability regarding financial results based on the use of the information in the site.
News, views, opinions, recommendations and other information obtained from sources outside of www.icmarkets.com.au, used in this site are believed to be reliable, but we cannot guarantee their accuracy or completeness. All such information is subject to change at any time without notice. IC Markets assumes no responsibility for the content of any linked site.
The fact that such links may exist does not indicate approval or endorsement of any material contained on any linked site. IC Markets is not liable for any harm caused by the transmission, through accessing the services or information on this site, of a computer virus, or other computer code or programming device that might be used to access, delete, damage, disable, disrupt or otherwise impede in any manner, the operation of the site or of any user’s software, hardware, data or property.


