
EUR/USD:
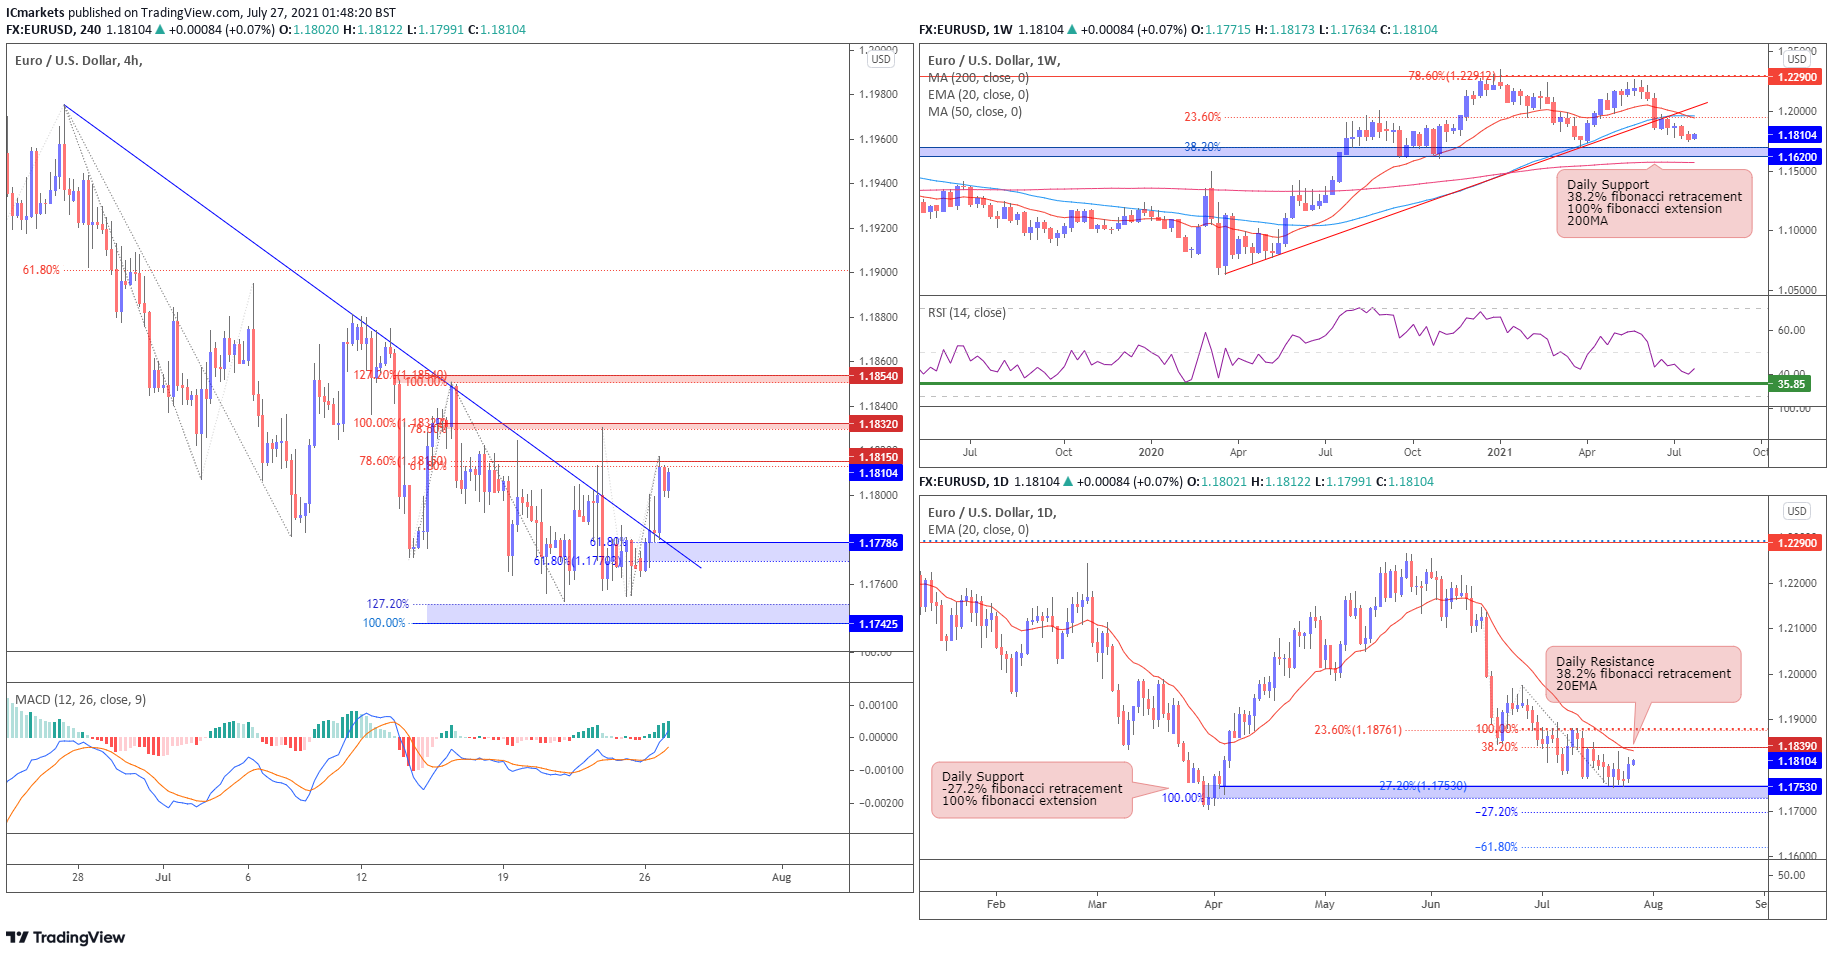
Looking at the weekly chart we can see that prices are facing bearish pressure below 20EMA and 50MA, where we are expecting the price to swing towards support at 1.16200, in-line with 38.2% Fibonacci retracement, 100% Fibonacci extension and 200MA. RSI is also indicating further bearish pressure before coming into the level where previous bounces occured. On the daily chart prices rebounded and we expect the prices to continue its bullish momentum to daily resistance at 1.18390, in-line with 38.2% Fibonacci retracement and 20EMA.
On the H4 timeframe, prices broke above the upper wedge trendline and swung towards resistance at 1.18150, in-line with 61.8% Fibonacci retracement and 78.6% Fibonacci extension. We expect the prices to continue its bullish momentum to resistance at 1.18320, in-line with 78.6% Fibonacci retracement and 78.6% extension. MACD is also indicating bullish momentum for further upside. The next resistance at 1.18540, in-line with 100% Fibonacci retracement and 127.2% Fibonacci extension.
If the price drops, it will find support at 1.17786, in-line with 61.8% Fibonacci retracement, 61.8% Fibonacci extension and descending trendline resistance-turned-support. The next support is at 1.17425, in-line with 127.2% Fibonacci retracement and 100% Fibonacci extension.
Areas of consideration:
- H4 time frame, support level at 1.17786 and 1.17425
- H4 time frame, resistance level at 1.18320 and 1.18540
GBP/USD:
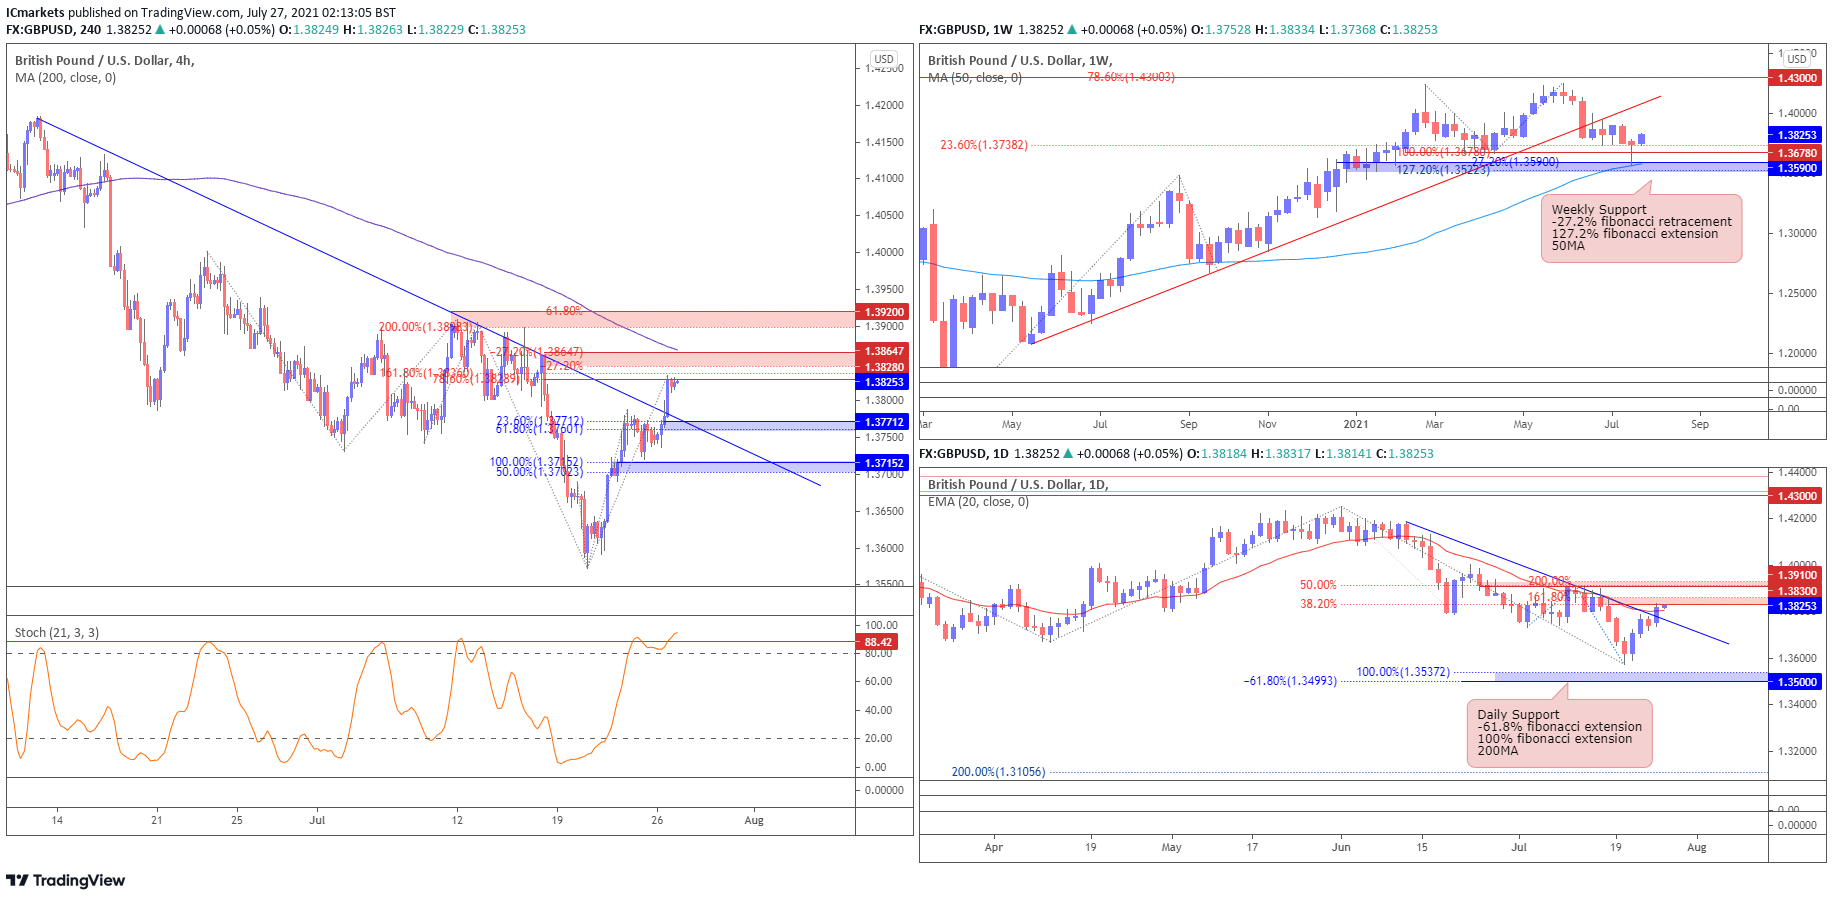
Looking at the weekly chart, prices bounced from support at 1.35900, in-line with -27.2% Fibonacci retracement, 127.2% Fibonacci extension and 50MA. On the daily time frame, price broke above the descending trendline and 20EMA towards resistance at 1.3830, in-line with 38.2% Fibonacci retracement and 127.2% Fibonacci extension. We expect the price to face bearish pressure at this level. If it continues to bounce, it will swing towards resistance at 1.39100, in-line with 50% Fibonacci retracement and 200% Fibonacci extension.
On the H4 timeframe, prices broke out of the descending trendline towards resistance at 1.38340, in-line with 78.6% Fibonacci retracement and 161.8% Fibonacci extension. There is limited upside for the price as there will be strong resistance at 1.38647, in-line with -27.2%, -27.2% Fibonacci retracement, 200MA and daily resistance. The next resistance is at 1.39200, in-line with -61.8% Fibonacci retracement and 200% Fibonacci extension.
We expect the price to pull-back support at 1.37712, in-line with 23.6% Fibonacci retracement, 61.8% Fibonacci extension and descending trendline resistance-turned-support. Stochastic is also at resistance where previous drops occurred. The next support will be at 1.37152, in-line with 50% Fibonacci retracement and 100% Fibonacci extension.
Areas of consideration:
- H4 time frame, 37712 and 1.37152 support level
- H4 time frame, 1.38647 and 1.39200 resistance level
AUD/USD:
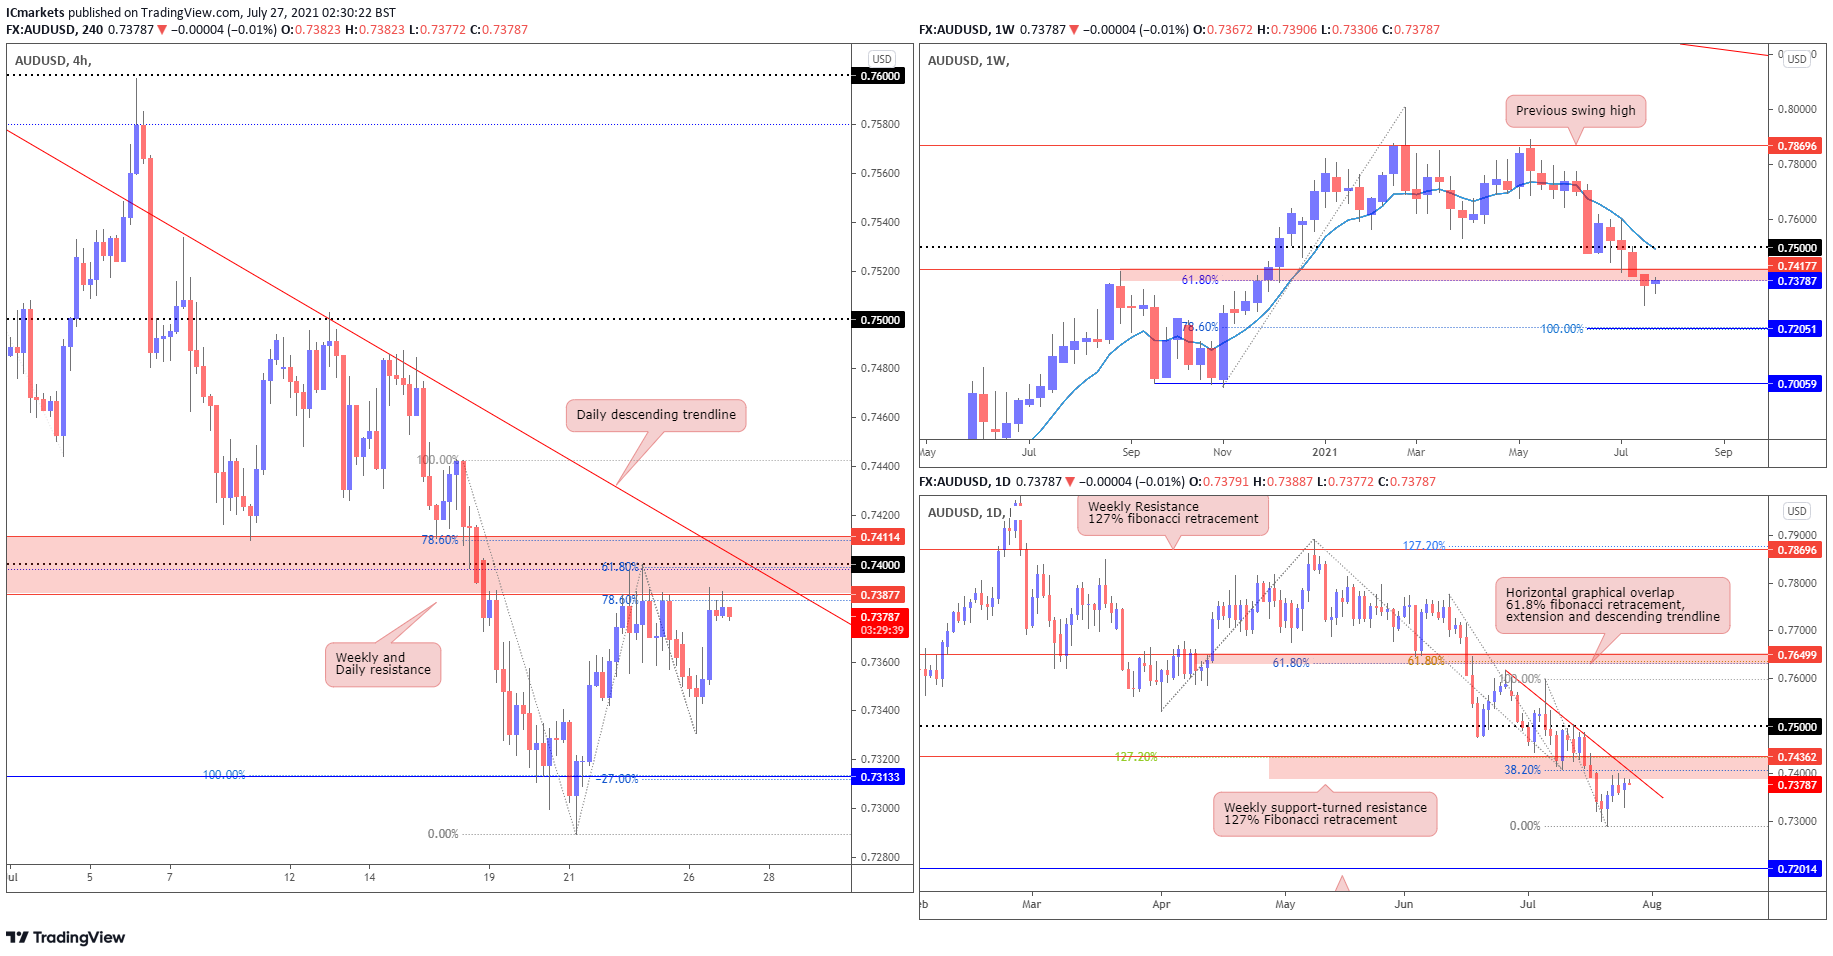
Looking at the weekly chart, price has broken beneath the 0.74177 support-turned-resistance level in line with 61.8% fibonacci retracement, where we may see a retreat in this area before price pushes down further. This is supported by price trending under the moving average. On the Daily timeframe, we are seeing a similar picture with further confirmation as price is trending under the descending trendline and Weekly resistance area in line with 127% and 38.2% fibonacci retracement level.
On the H4 timeframe, we may see a push down from here as price is testing the Weekly and Daily resistance in line with 78.6% fibonacci retracement, 61.8% fibonacci extension, and target being 0.73133 in line with -27% fibonacci retracement, 100% fibonacci extension and Horizontal graphical overlap.
Areas of consideration:
- H4 time frame, showing strong resistance area
- Weekly and Daily time frame showing bearish momentum
USD/JPY
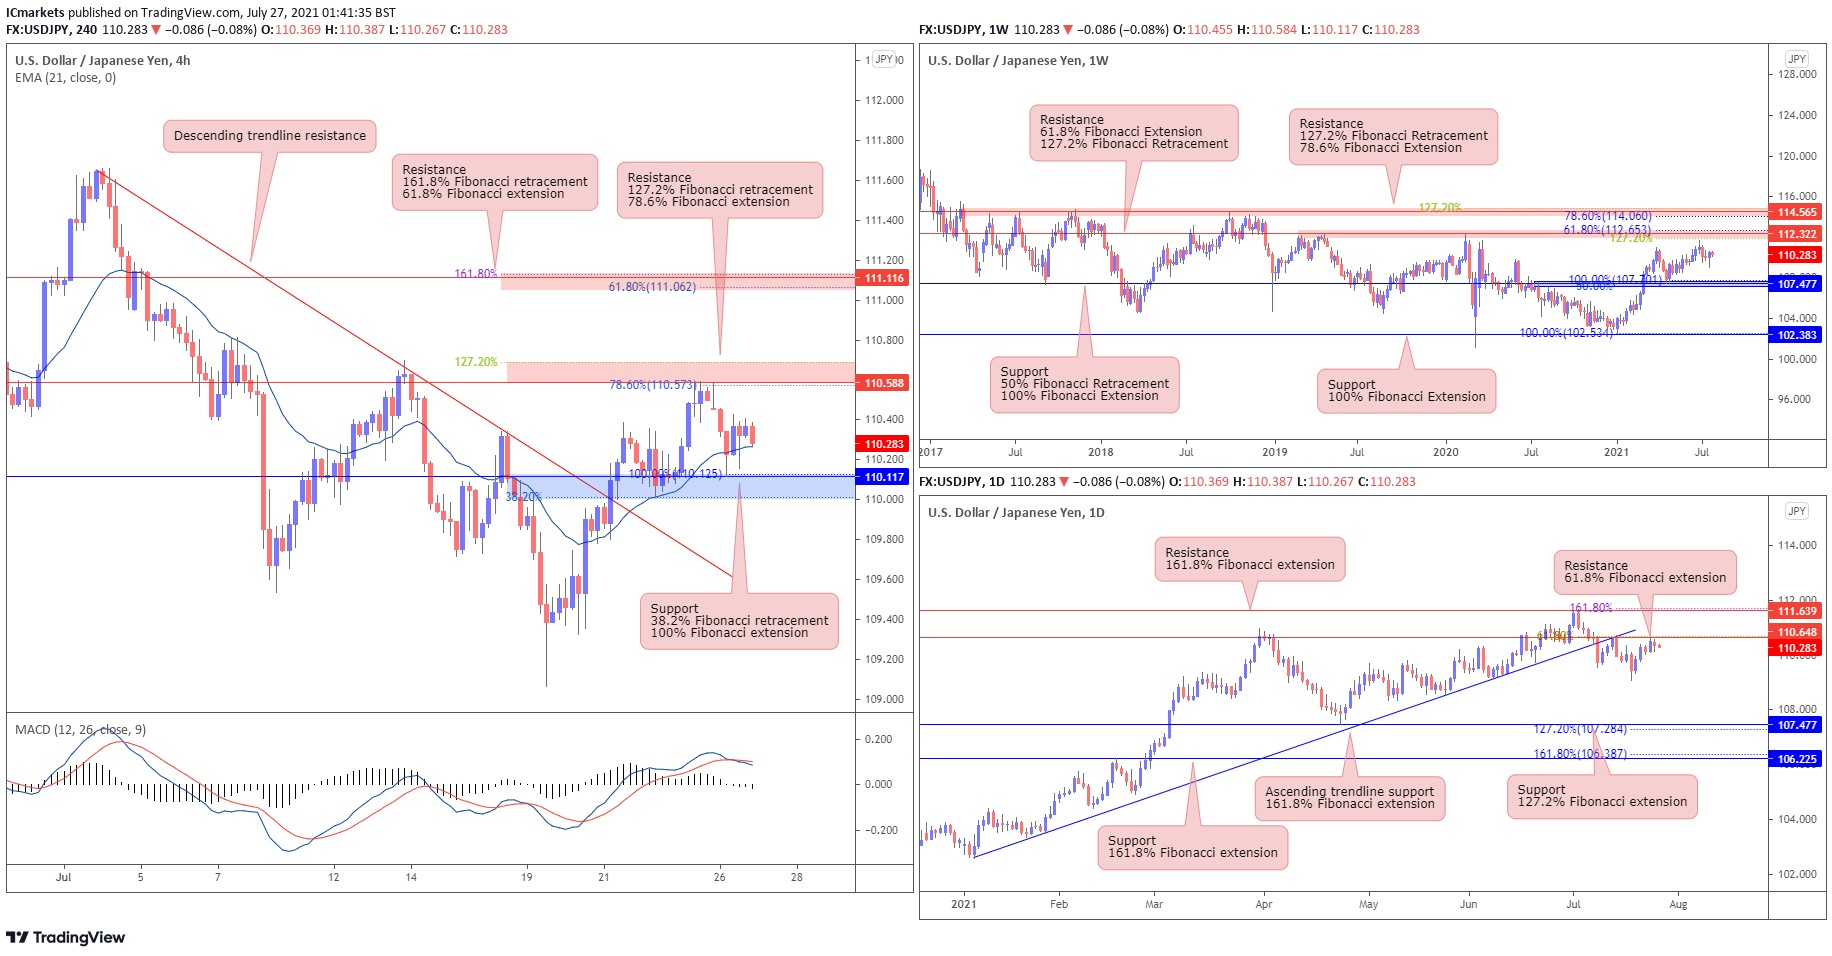
From the weekly timeframe, prices are pushing up towards the horizontal swing high resistance of 112.322, in line with 127.2% Fibonacci Retracement and 61.8% Fibonacci Extension, where we might see a breakout from this level. In the case that price pushes up, prices may face resistance at horizontal swing high resistance of 114.565, in line with 78.6% Fibonacci extension and 127.2% Fibonacci retracement. On the daily timeframe, prices have broken the ascending trendline support, and resisted the 110.648 level, which is in line with 61.8% Fibonacci retracement and 127.2% Fibonacci extension. Prices might push down towards 107.477, in line with 127.2% Fibonacci extension.
On the H4 timeframe, prices have broken above the descending trendline resistance and approaching horizontal swing high resistance of 110.588 , in line with 127.2% Fibonacci retracement and 78.6% Fibonacci extension. Prices are likely to rally towards horizontal swing high resistance, in line with 161.8% Fibonacci retracement and 61.8% Fibonacci extension. Prices may reverse to horizontal swing low support, in line with 38.2% Fibonacci retracement and 100% Fibonacci extension. Moreover, EMA is holding below prices and in line with horizontal swing low support. MACD signal lines just cross above the 0 line.
Areas of consideration:
- 588 resistance level on the H4 timeframe
- 16 resistance level on the H4 timeframe
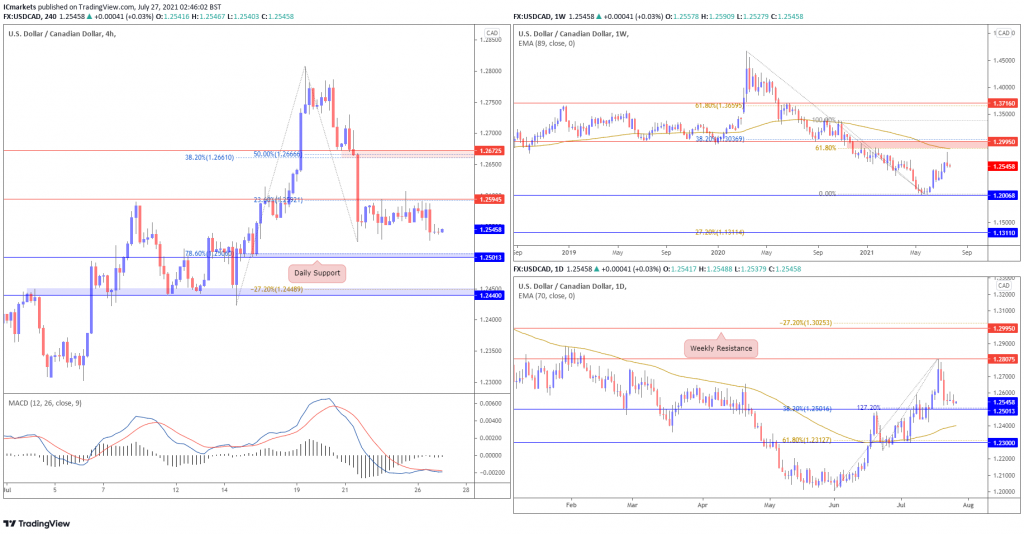
USD/CAD:
On the Weekly timeframe, price is holding below long term moving average and also 38.2% Fibonacci retracement level at 1.29950. As long as the price is holding below this level, we see price facing further bearish pressure in the long term. On the Daily, price is approaching graphical overlap support at 1.25013. With price holding above daily moving average, a short term bounce towards graphical swing high resistance at 1.28075 could be possible.
On the H4, we see price trading sideways, holding below 1.25945 resistance. With technical indicators showing room for further bearish momentum, we see a low probability bearish scenario for price to drop towards daily support at 1.25013. Otherwise, breaking above 1.25945 will see price swing the other way towards the next resistance at 1.26725.
Areas of consideration:
- H4 shows price trending sideways within consolidation, waiting for bullish breakout.
USD/CHF:
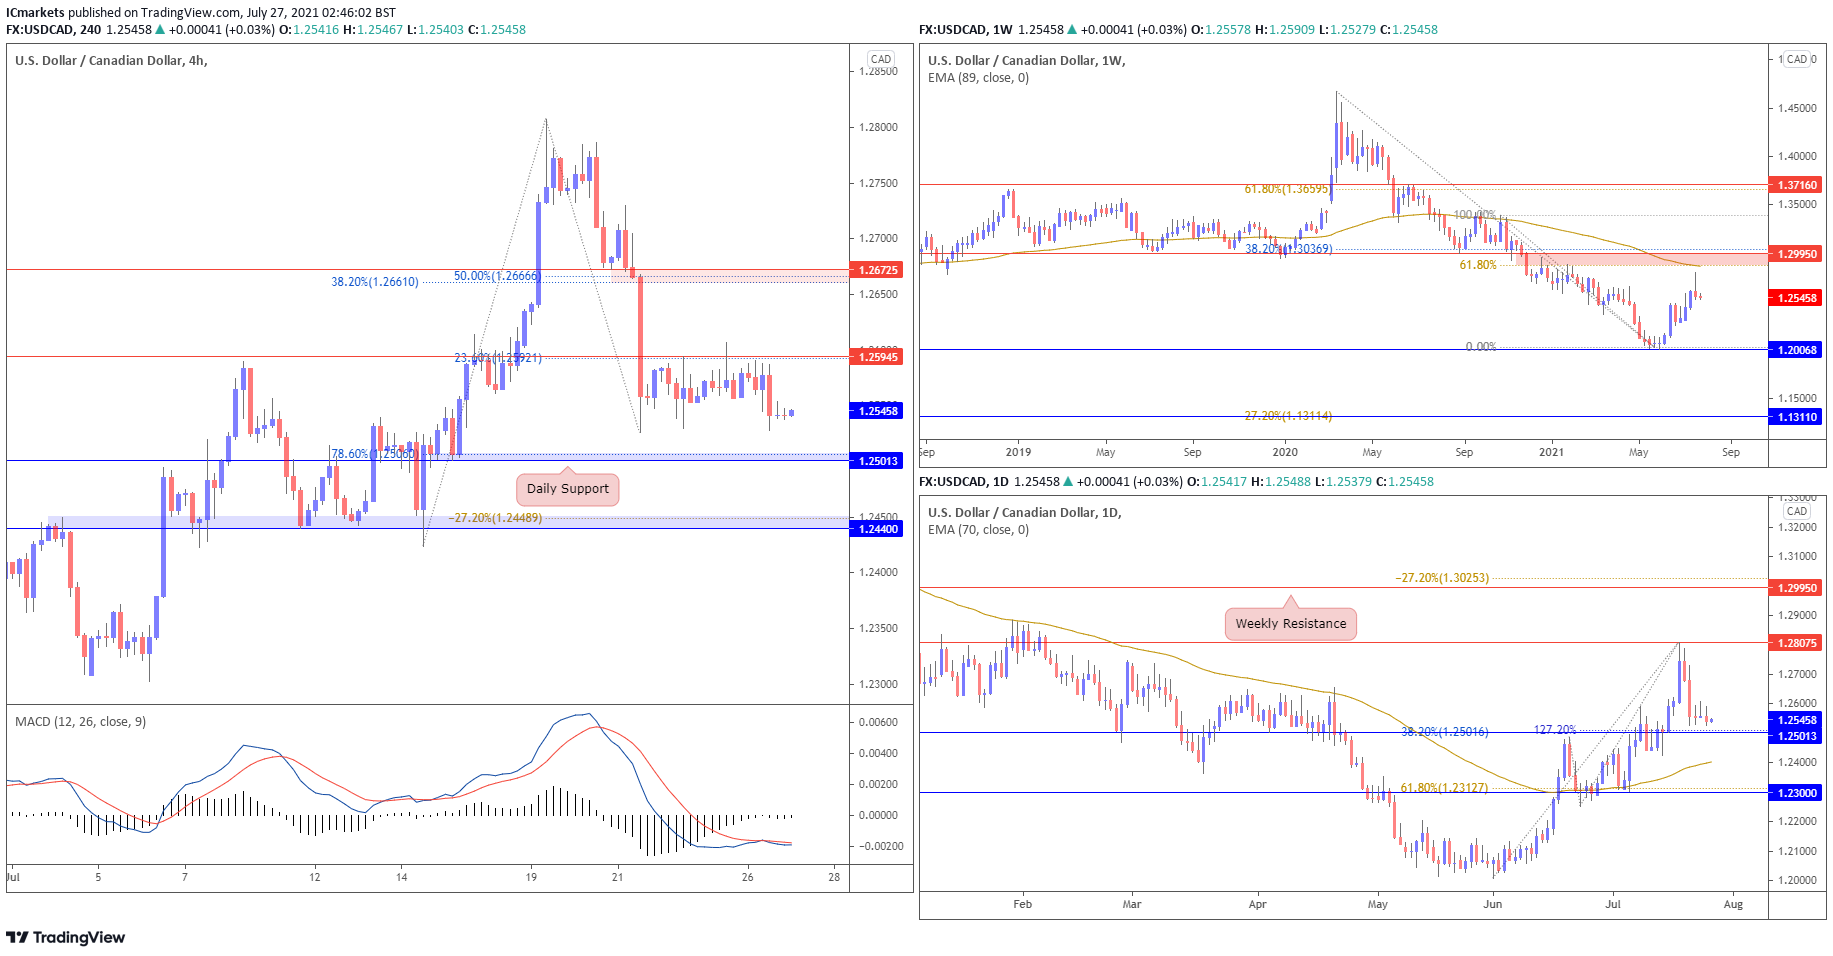
USD/CHF has shown a strong bounce from the weekly 0.89146 support, in line with 78.6% Fibonacci retracement, and price is now holding below the descending trendline resistance. The daily chart shows that price is now reversing below the key daily resistance of 0.92735. We could potentially see further downside towards the 0.90462 support.
On the H4 chart, price appears to be approaching the H4 support at 0.91176 which is in line with a horizontal swing low, 161.8% Fibonacci extension and 127.2% Fibonacci retracement. We can expect price to bounce and rise to a possible horizontal pullback resistance at 0.91634 which is also in line with the 23.6% FIbonacci retracement level. Alternatively, we may see price break the support to plunge further to the 0.90496 level which is a potential horizontal pullback support in line with the 61.8% Fibonacci retracement and the 100% Fibonacci extension.
Areas of consideration:
- Price could bounce up from the 0.91176 level and rise to the 0.91634 level
- Price could make a bearish breakout of the 91176 level and plunge further to the 0.90496 level
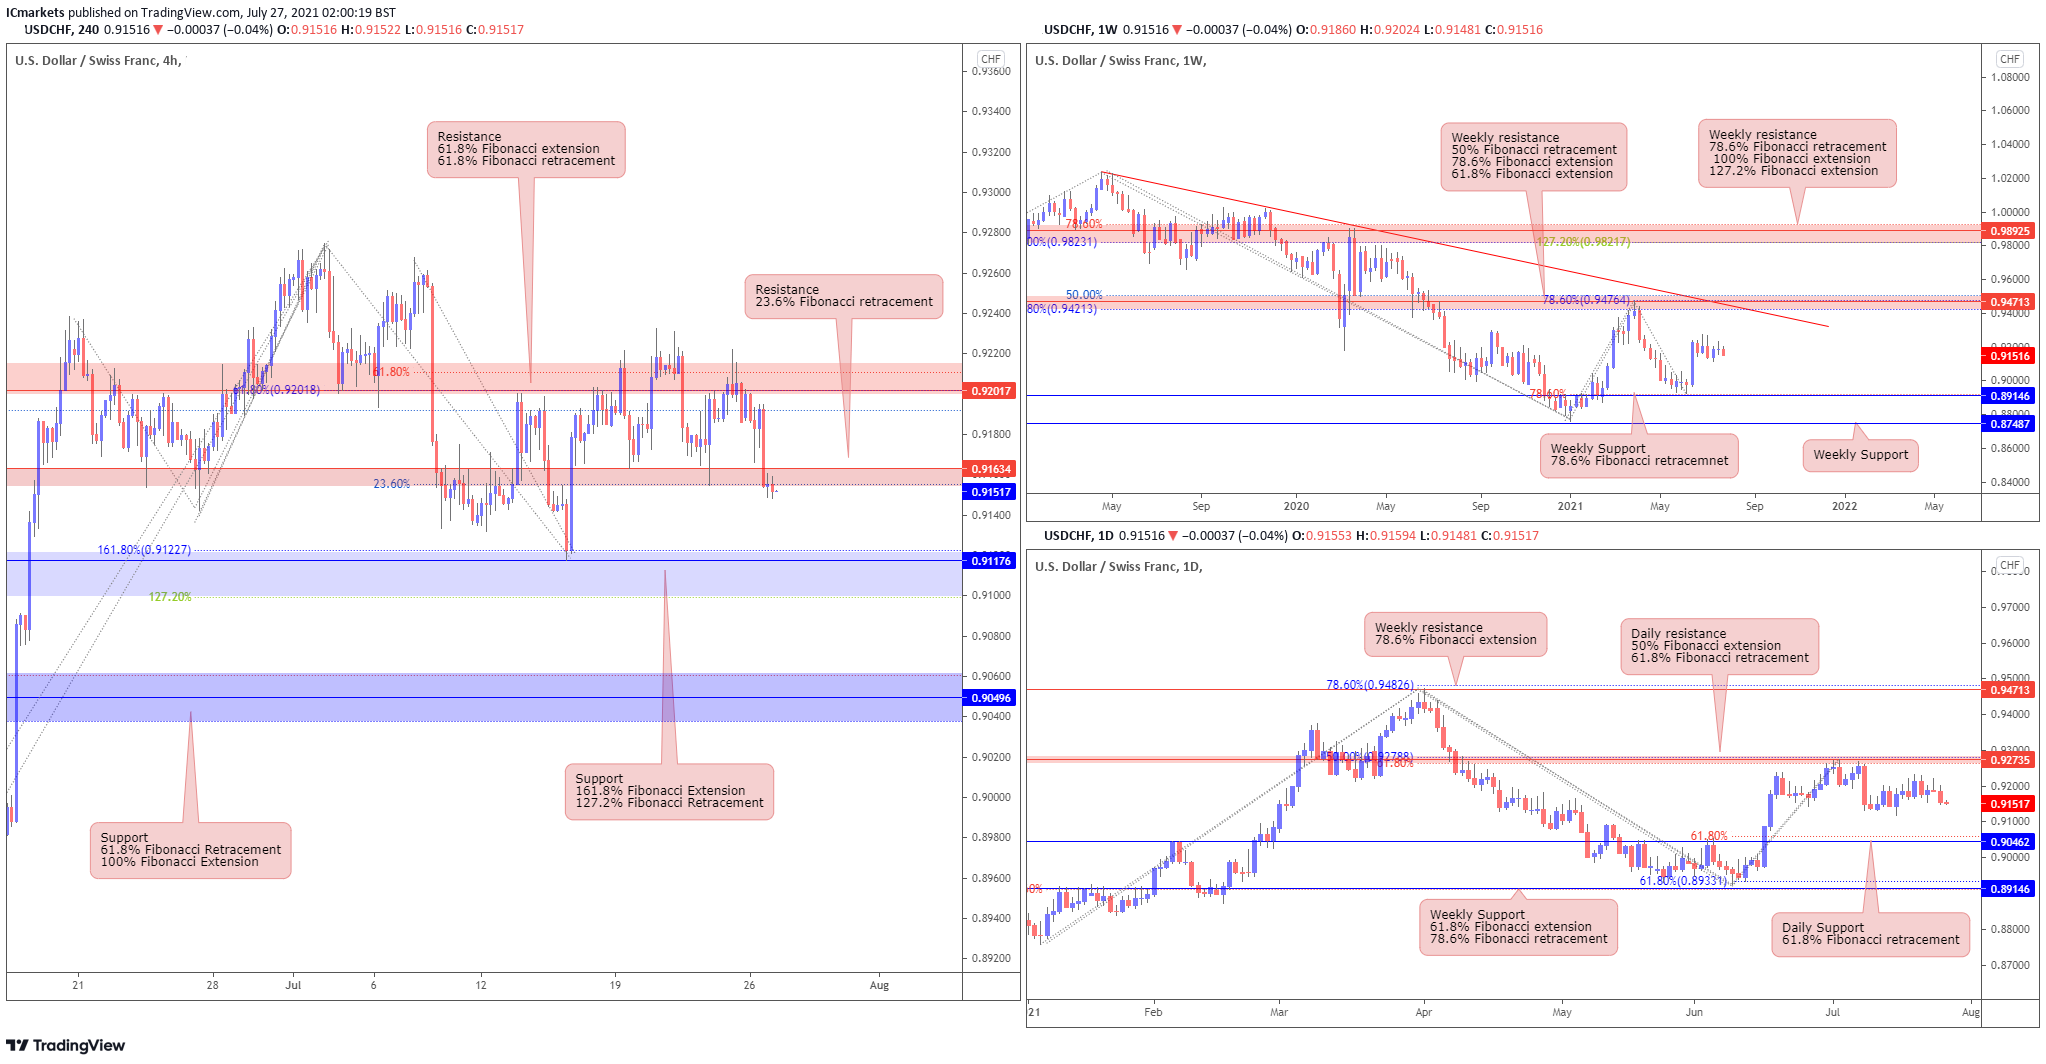
Dow Jones Industrial Average:
On the weekly chart, price is trading sideways holding between 32765 support and 37525 resistance. With price holding above long term moving average, we see price facing further bullish pressure. On the daily chart, price is currently trading sideways and holding below resistance at 35090. With stochastic still holding below resistance where price dropped in the past, we see price facing possible bearish pressure.
On the H4, the picture remains the same as price drifted higher last Friday and is now testing and holding below daily resistance at 35090 level. Bearish divergence still remains valid on RSI indicator. We see a low probability scenario where sellers might add to their shorts to push price lower towards 33741 support. Otherwise failure to hold below 35090 resistance should see price swing the other way towards 35485 resistance instead.
Areas of consideration:
- 35090 daily resistance is key level to watch
- Bearish divergence on H4
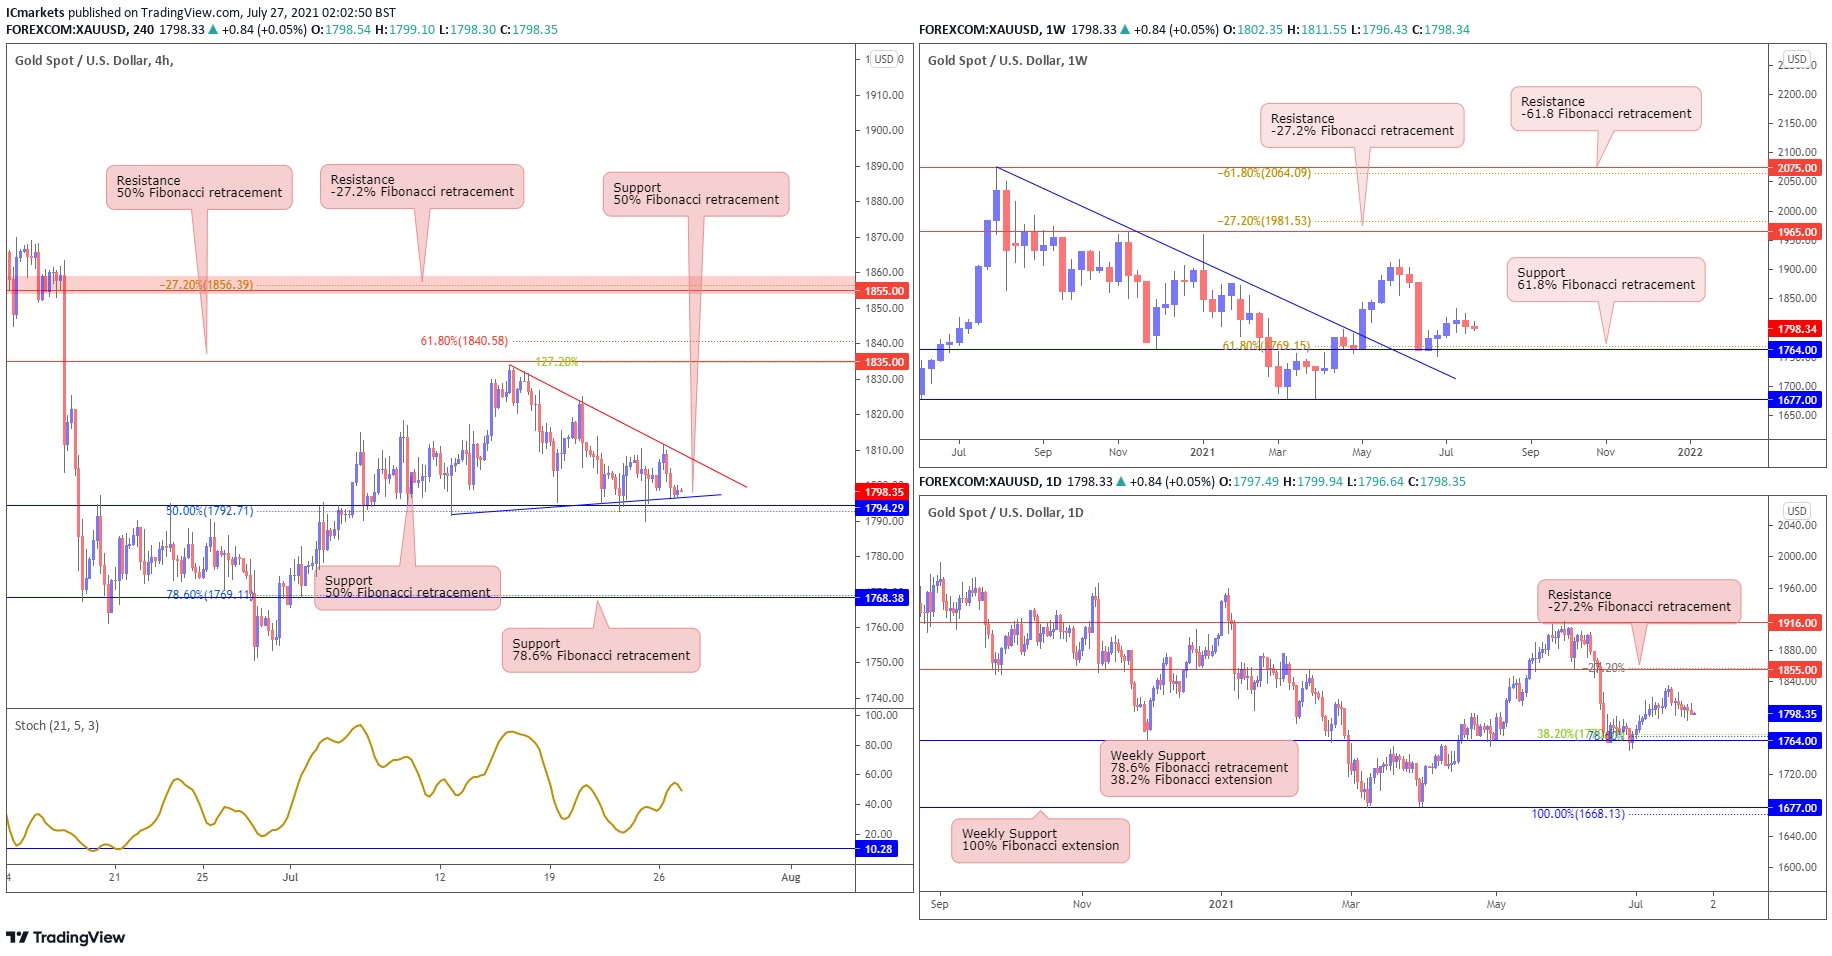
XAU/USD (GOLD):
On the weekly timeframe, price tested and bounced above key trendline pullback support at 1764. On the daily, price is now trading sideways, holding between 1855 resistance and 1764 weekly support. With no clear levels for entry that provides a good risk to reward ratio, we prefer to keep a neutral stance for now. Breaking above resistance at 1855 will see price push higher towards 1916 resistance. Otherwise, a break below 1764 support will see price drop lower towards 1677 support instead.
On the H4, price tested and bounced above 1794 support. With stochastic testing support where price bounced in the past, we still see a low probability bounce scenario where buyers may look to enter and push price towards recent swing high at 1835 resistance. Otherwise, failure to hold above 1794 support, will see price possibly drop towards next support at 1768 or even 1764 weekly support zone.
Areas of consideration:
- 1794 H4 support level is the key level to watch.
The accuracy, completeness and timeliness of the information contained on this site cannot be guaranteed. IC Markets does not warranty, guarantee or make any representations, or assume any liability regarding financial results based on the use of the information in the site.
News, views, opinions, recommendations and other information obtained from sources outside of www.icmarkets.com.au, used in this site are believed to be reliable, but we cannot guarantee their accuracy or completeness. All such information is subject to change at any time without notice. IC Markets assumes no responsibility for the content of any linked site.
The fact that such links may exist does not indicate approval or endorsement of any material contained on any linked site. IC Markets is not liable for any harm caused by the transmission, through accessing the services or information on this site, of a computer virus, or other computer code or programming device that might be used to access, delete, damage, disable, disrupt or otherwise impede in any manner, the operation of the site or of any user’s software, hardware, data or property.


