
Key risk events today:
US CB Consumer Confidence.
(Previous analysis as well as outside sources – italics).
EUR/USD:
Areas of consideration:
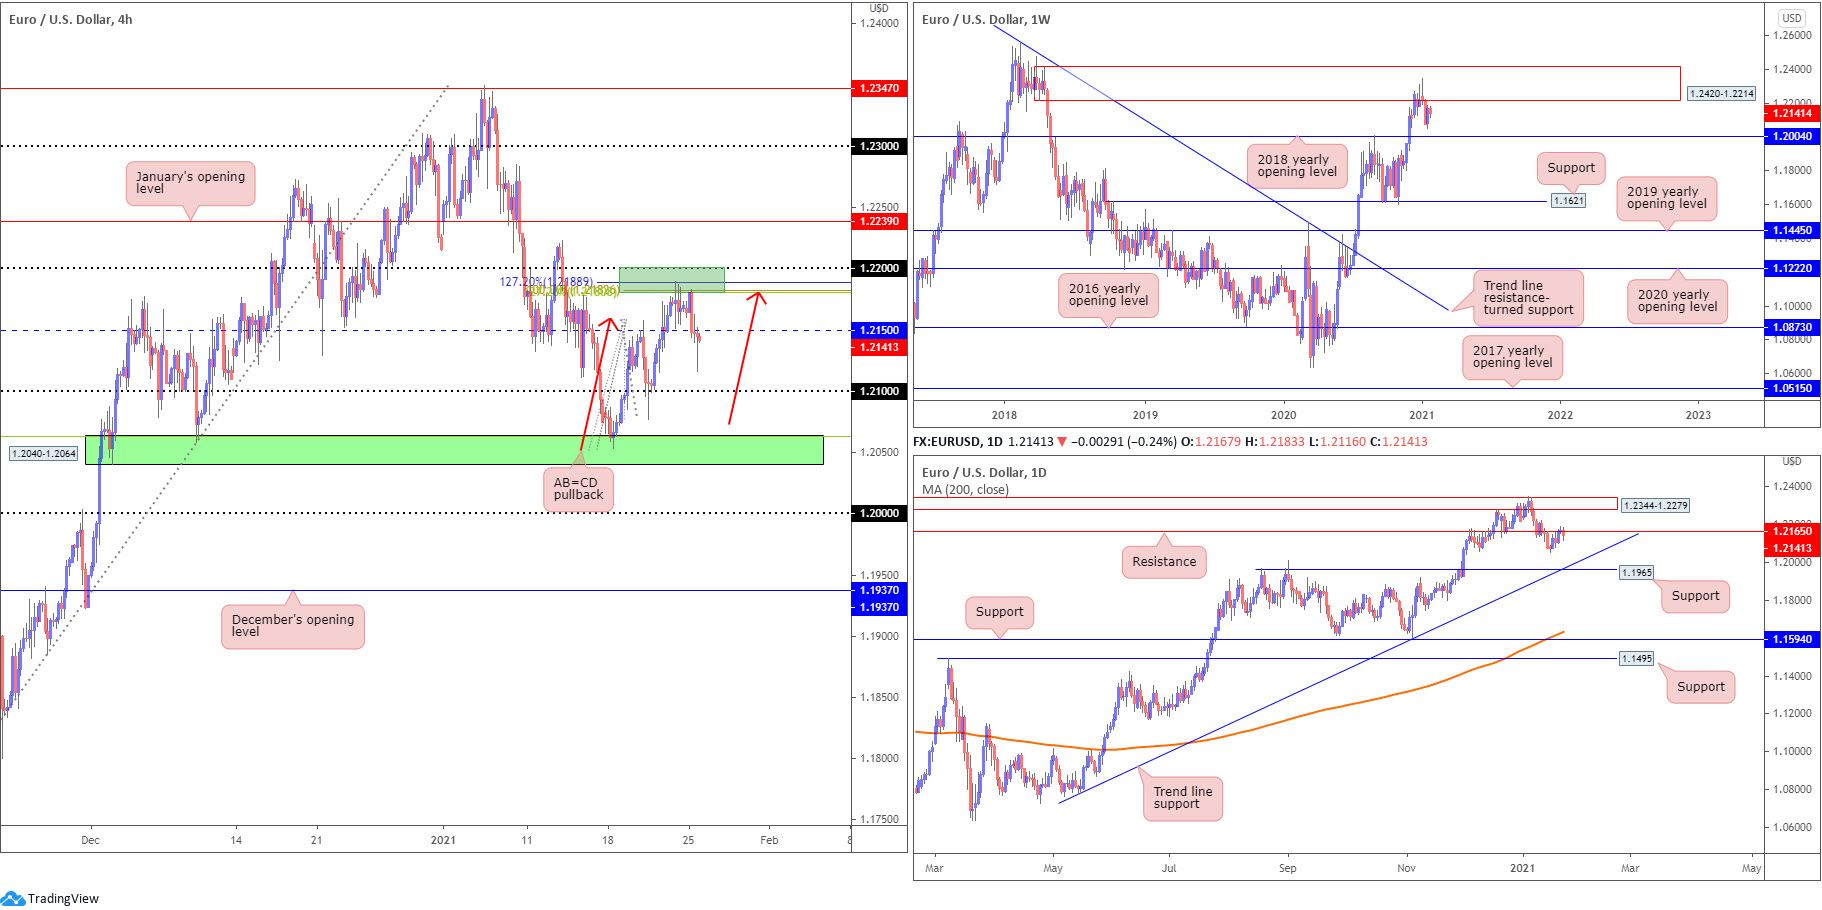
- H4 resistance at 1.22/1.2180 (composed of the 1.22 figure, a collection of Fibonacci ratios and an AB=CD bearish formation [red arrows]) provided sufficient oomph to overpower buying and take the currency pair under 1.2150 into European hours on Monday. Therefore, 1.22/1.2180 and 1.2150 are noted as immediate resistances to be mindful of on the H4 scale, targeting at least 1.21.
- The 1.22 level is also noteworthy resistance on the H4, fixed just south of the lower side of weekly supply at 1.2420-1.2214. Consequently, 1.2214/1.22 is an area to be watchful of should buyers find some grip to push higher.
- Daily resistance at 1.2165—an active S/R level since June 2010—is a base currently in the spotlight. Downside targets on the daily timeframe are seen at trend line support, taken from the low 1.0774, plotted just north of support at 1.1965, a previous Quasimodo resistance level. North of 1.2165, supply drawn from 1.2344-1.2279 (nestled within the walls of weekly supply mentioned above at 1.2420-1.2214) could work its way back in sight.
GBP/USD:
Areas of consideration:
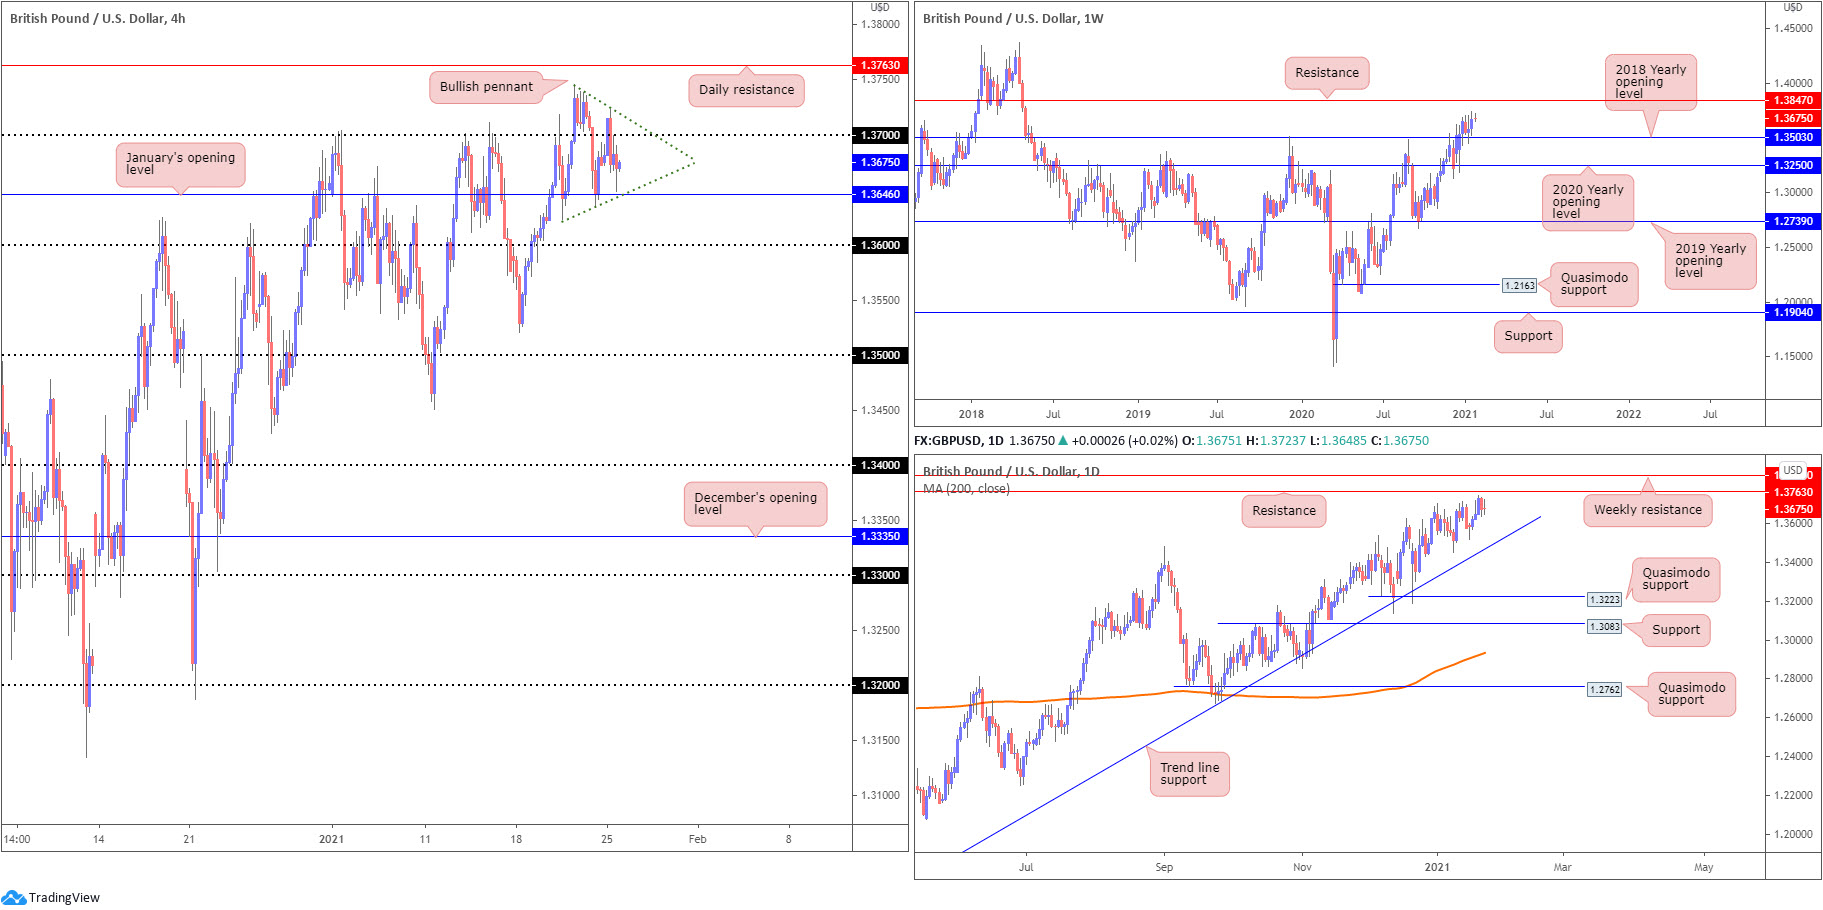
- Weekly support at 1.3503 holding (2018 yearly opening value) and price recently registering fresh 2021 highs, in a market clearly trending higher, places long-term buyers in a favourable position. With reference to resistance, the daily timeframe shows price may have trouble at 1.3763, though a break signals weekly resistance at 1.3847 is likely on the radar.
- A bullish pennant pattern is seen taking shape on the H4 scale between the 2021 peak at 1.3745 and a low at 1.3623. Additional S/R levels to remain cognisant of is January’s opening value at 1.3646 and the 1.37 figure.
- Analysis suggests that a breakout above the H4 bullish pennant pattern could see price attempt to conquer daily resistance mentioned at 1.3763 and target weekly resistance at 1.3847.
AUD/USD:
Areas of consideration:
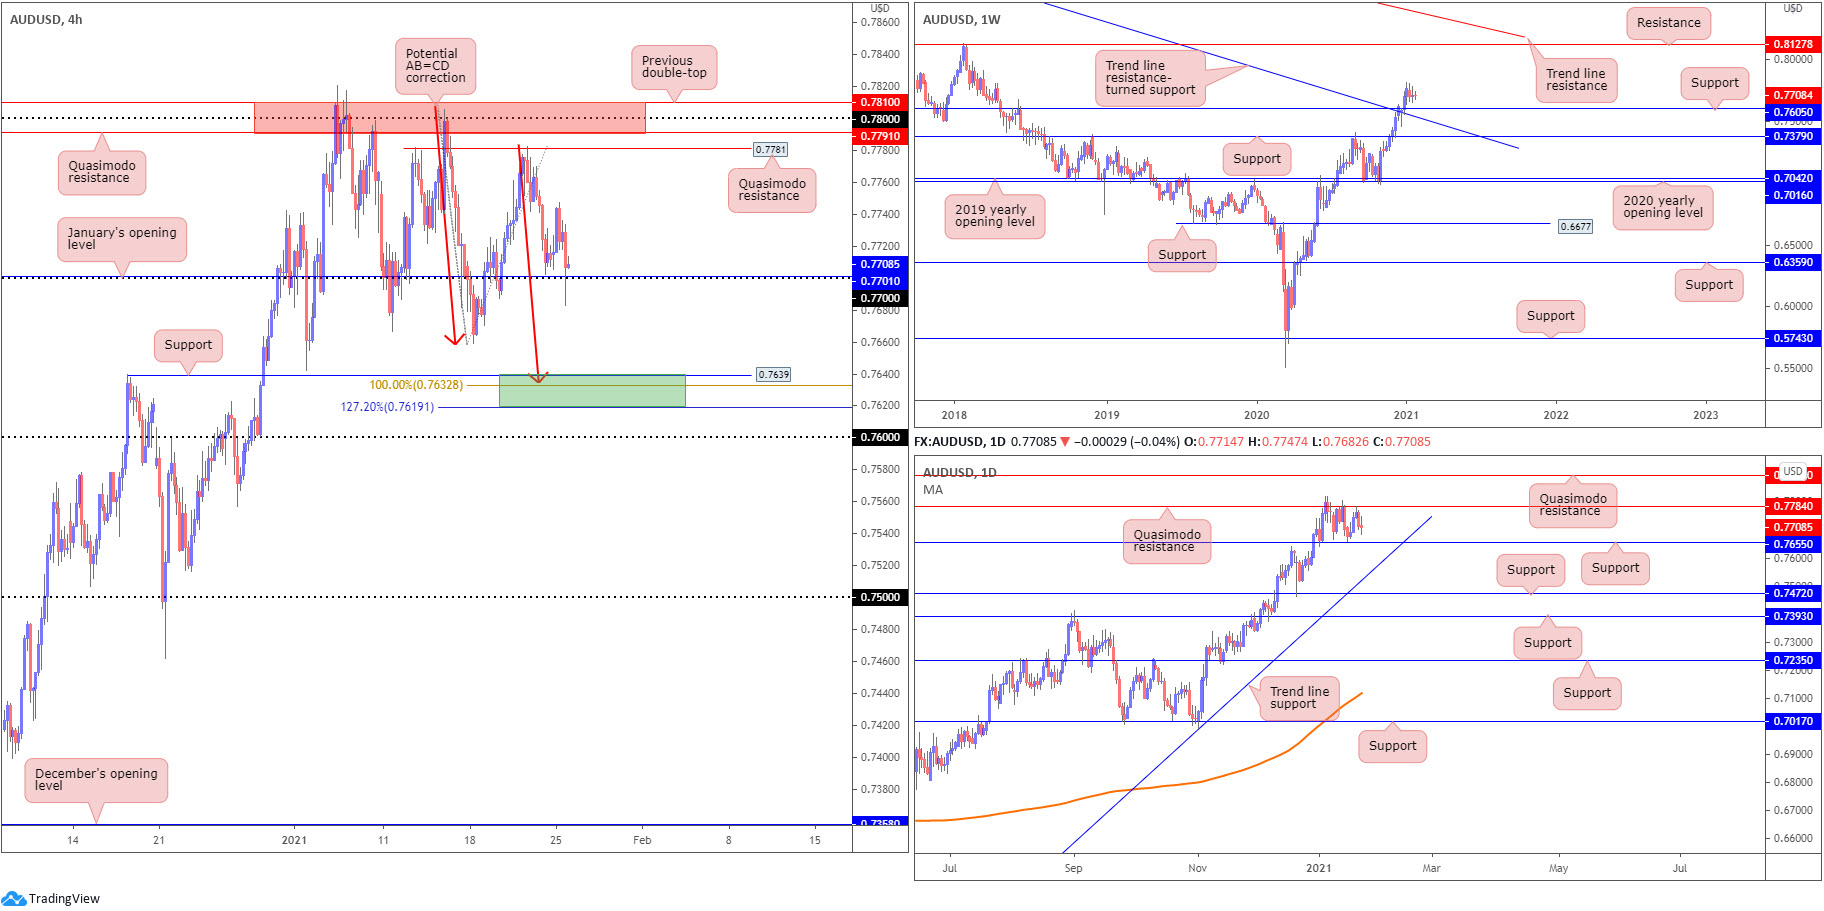
- The trend has remained firmly higher since early 2020.
- Despite price recently consolidating gains, the weekly timeframe shows AUD/USD has room to reach as far north as resistance at 0.8127 (and the daily timeframe, beyond Quasimodo resistance at 0.7784, to around 0.7893 [another Quasimodo resistance]).
- Higher timeframe support levels to consider taking into account are weekly support at 0.7605, a previous Quasimodo resistance. Also close by is trend line resistance-turned support, taken from the high at 1.1080. Daily support at 0.7655 is also a level currently in the light.
- January’s opening value at 0.7701 on the H4 and the 0.77 figure (an area now in play) has limited technical confluence, therefore could be fragile.
- H4 support at 0.7619-0.7639 (an area made up of support and Fibonacci support) might interest buyers, having seen daily support positioned just north of the base at 0.7655.
- 0.76 is also a featured level on the H4, owing to weekly support at 0.7605.
USD/JPY:
Areas of consideration:
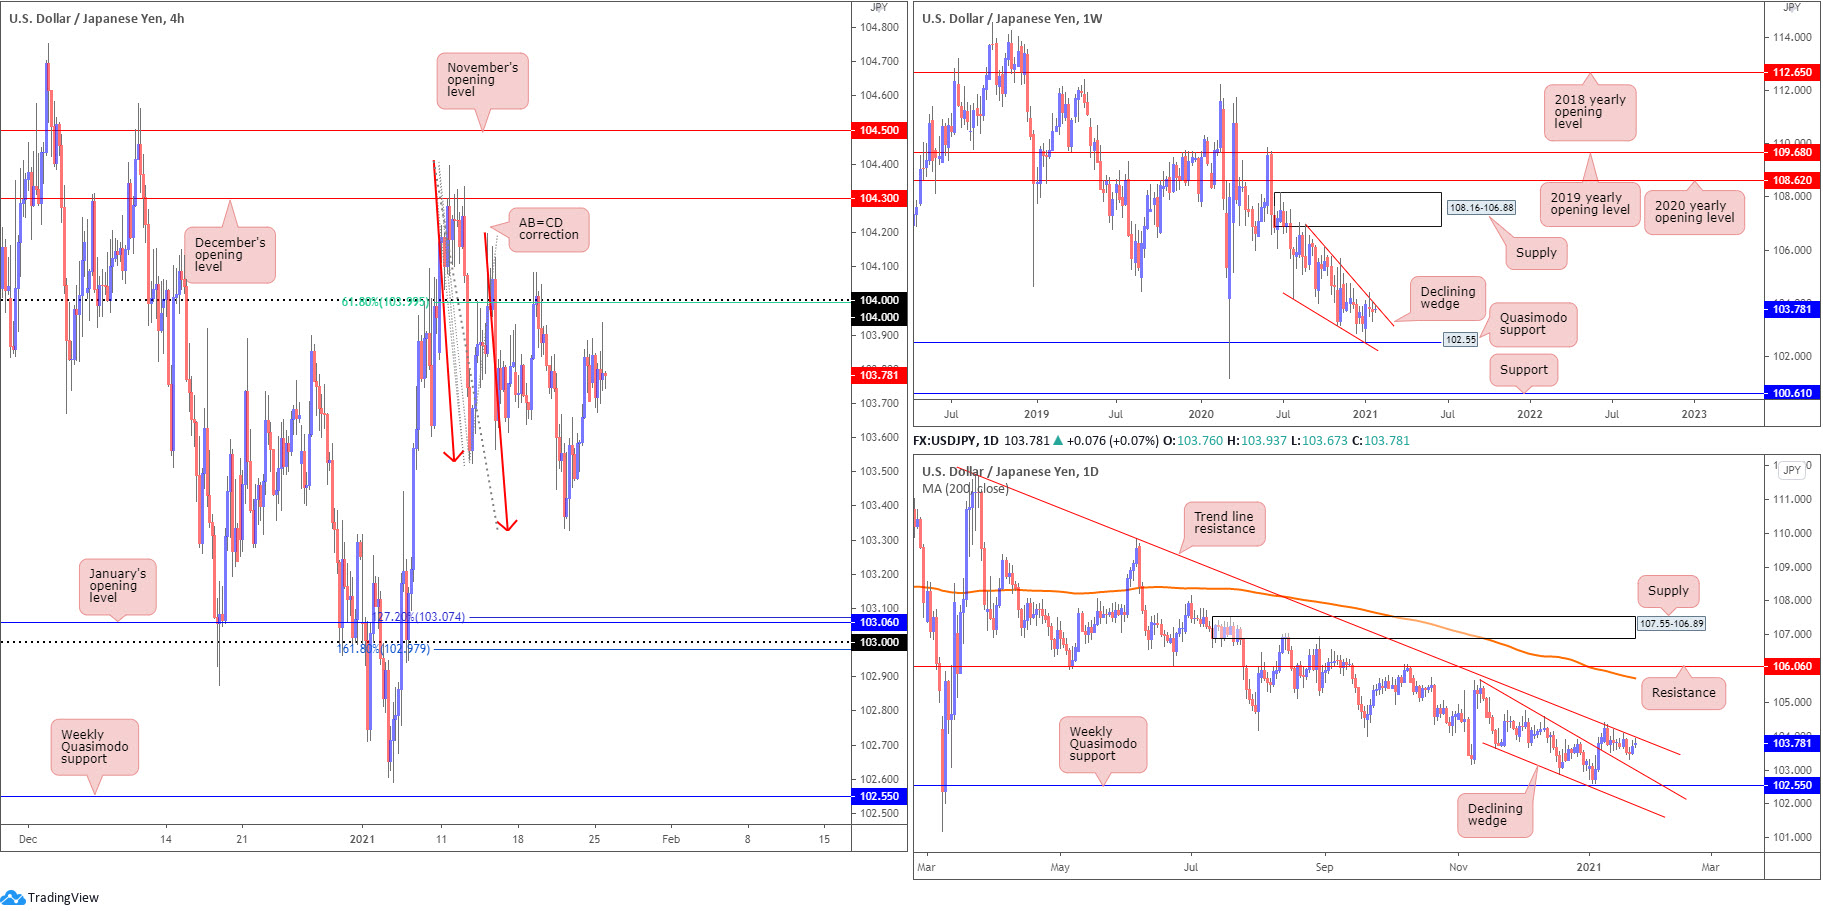
Marginally off session highs, USD/JPY prices remain unchanged on Monday, consolidating between 103.93 and 103.67.
- The upper edge of the weekly declining wedge (106.94/104.18) fusing with daily trend line resistance, extended from the high 111.71, is an interesting combination. A breakout beyond these two barriers could be meaningful.
- Based on the H4, 104 is likely to be on the watchlists for sellers, particularly as the level merges with a 61.8% Fibonacci retracement ratio and the higher timeframes are seen circling trend line resistances.
- The upper boundary of the penetrated declining wedge on the daily timeframe, extended from the high 105.67, along with January’s opening value at 103.06, the 103 figure (H4) and nearby Fibonacci studies at 102.97 and 103.07, remains an area to be mindful of should sellers make a show south of 104.
USD/CAD:
Areas of consideration:
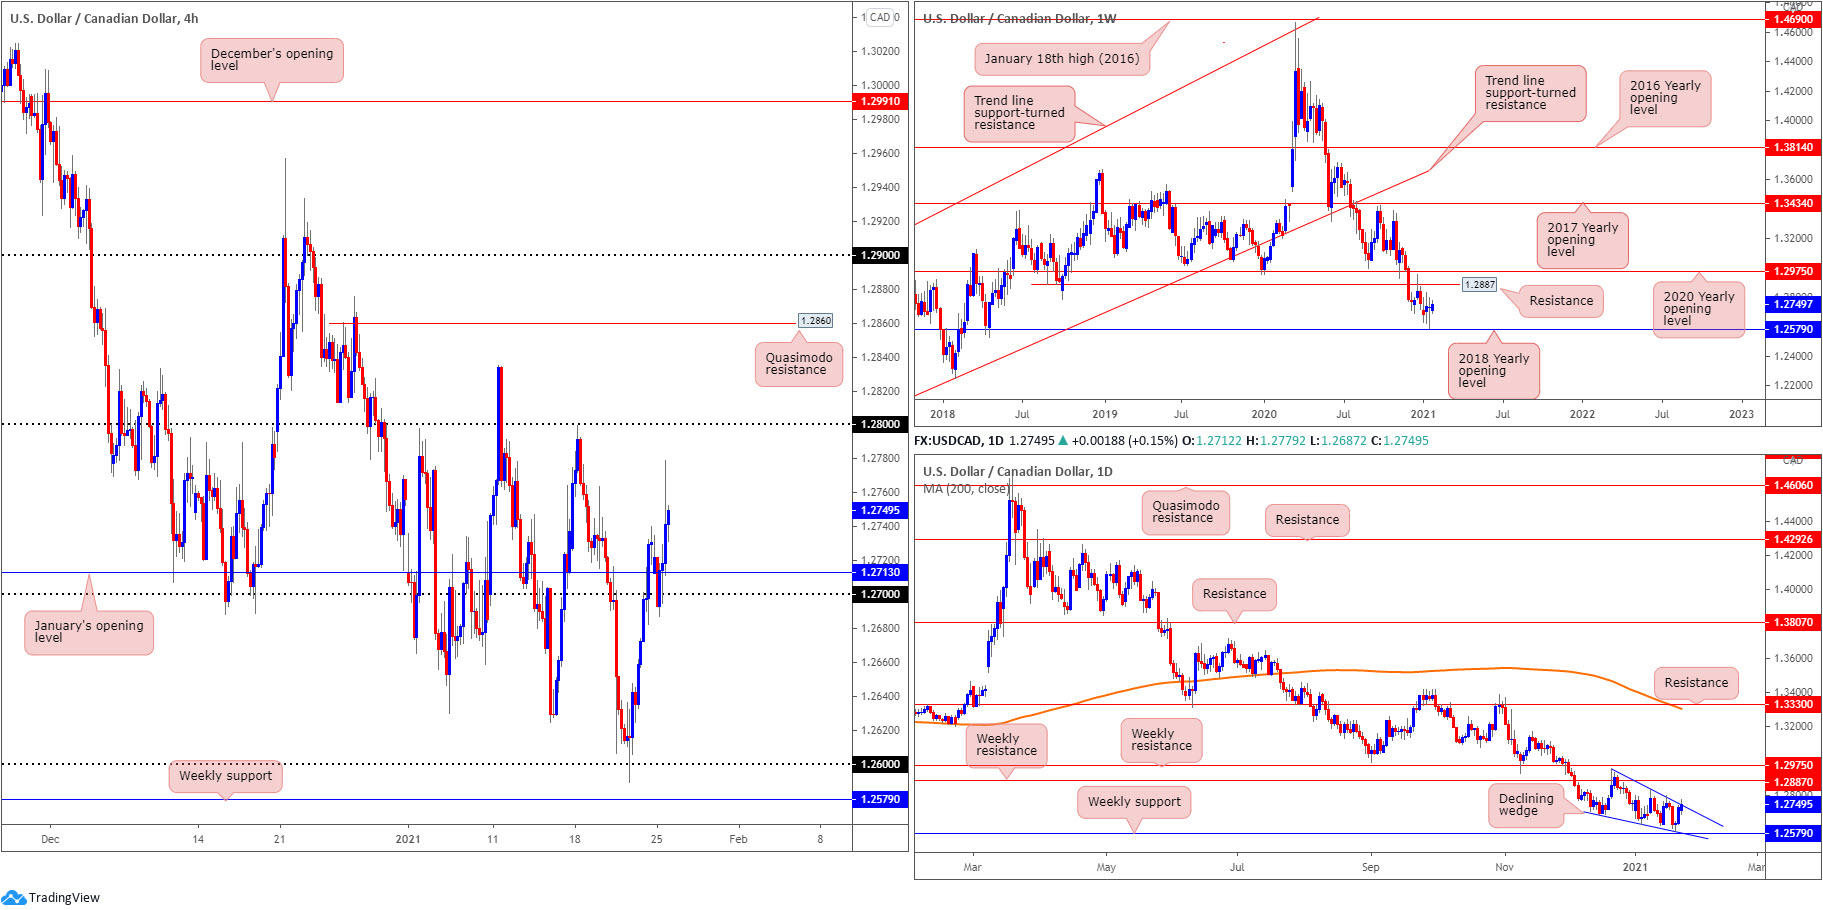
- From the weekly timeframe, three back-to-back long-legged doji candles recently took shape just north of the 2018 yearly opening value at 1.2579, shortly after the retest of resistance at 1.2887 in late December (a previous Quasimodo support level). It is important to note long-term flow (trend) has been pointing lower since topping in March (2020).
- On the daily timeframe, the upper edge of the declining wedge (1.2957/1.2688) is in play, between weekly support and resistance levels mentioned above. A breakout higher, according to the pattern’s rules of engagement, is considered a reversal signal, given it forming within a downtrend.
- 27 and January’s opening value at 1.2713 on the H4 (a noted support area to watch in Monday’s weekly technical briefing), despite a mild breach, delivered reasonable support on Monday, boosted on the back of the DXY discovering a bid. Extending recovery gains today sees the 1.28 figure as potential resistance, yet to reach 1.28, a break of the daily timeframe’s declining wedge must be seen.
- Those long the 1.27-1.2713 retest on Monday have likely reduced risk to breakeven and liquidated partial profits. A daily close forming above the daily timeframe’s declining wedge resistance could fuel further upside to reach 1.28, with a break here exposing H4 Quasimodo resistance at 1.2860 and weekly resistance at 1.2887.
USD/CHF:
Areas of consideration:
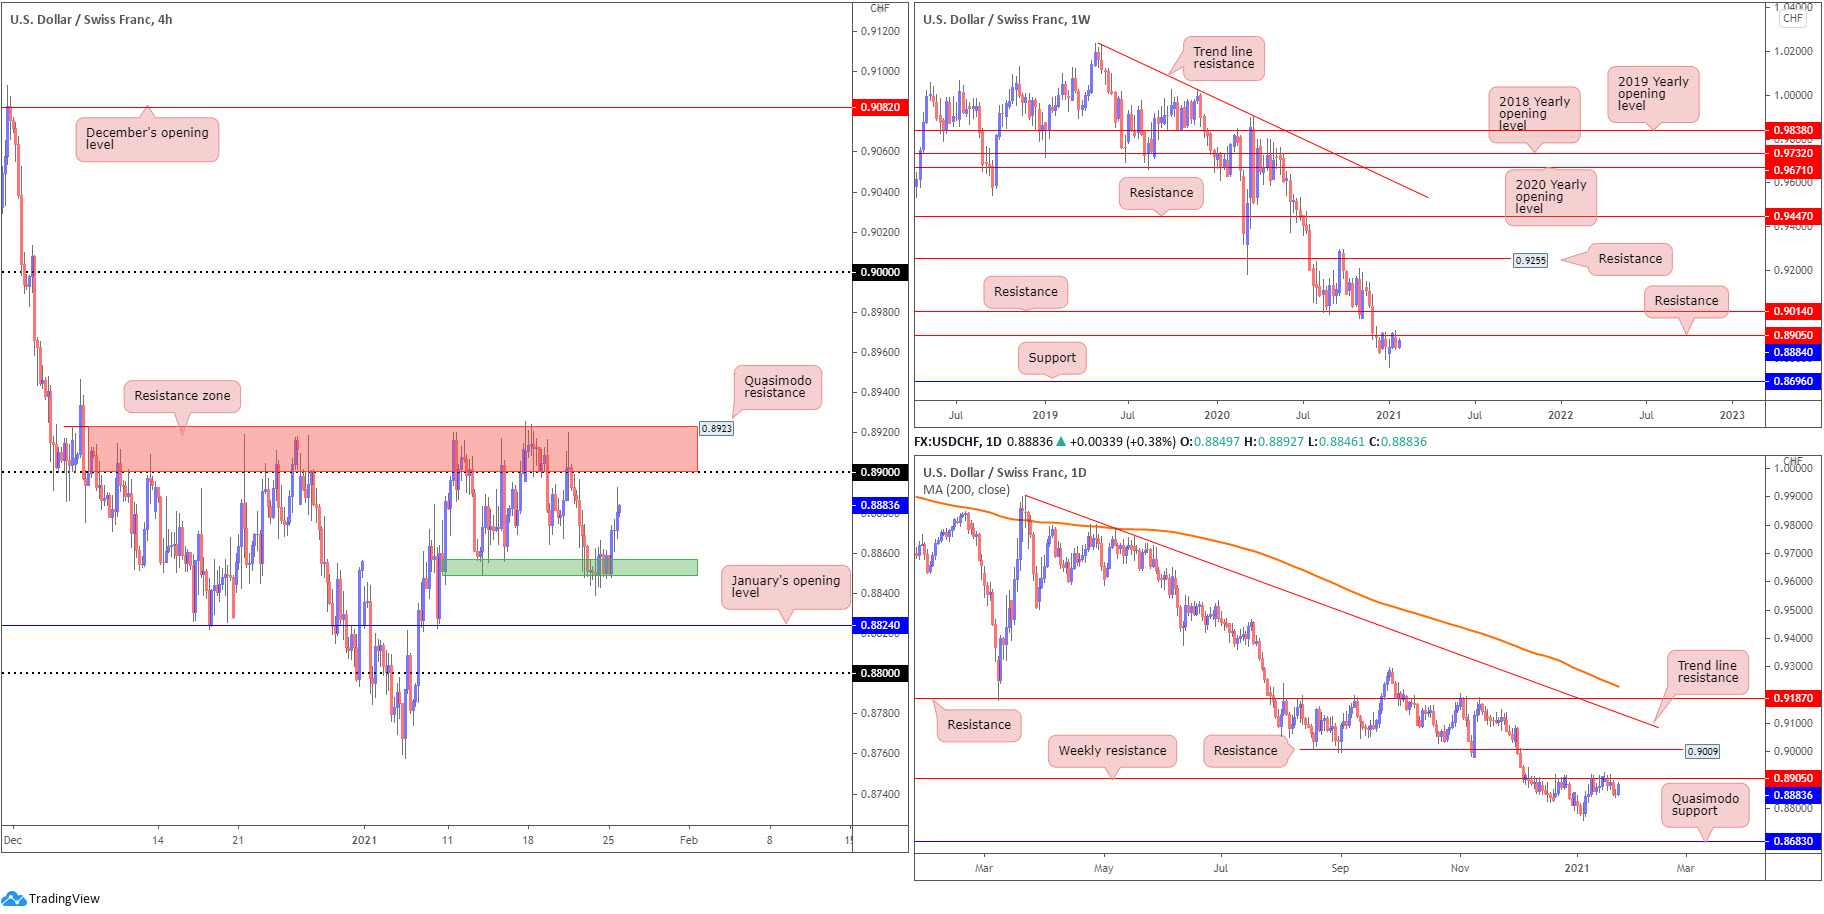
- The 0.8850 region (green) on the H4 provided support on Monday, a surprising move having noted the higher timeframes trade from resistance at 0.8905 (weekly timeframe), in a market trending lower since April 2019.
- Yesterday threw H4 resistance at 0.8923-0.89 (Quasimodo resistance and psychological resistance) back in the mix—note this base converges with weekly resistance mentioned above at 0.8905. The H4 zone is also an area that has capped upside since early December. Above here, the technical landscape is relatively clear on the H4 timeframe until reaching the key figure 0.90, which happens to merge with daily resistance at 0.9009.
- Bearish scenarios may form should H4 close south of 0.8850. Although short-term downside targets rest between 0.8824 (January’s opening value) and the 0.88 figure, longer-term targets to be aware of are the multi-month troughs around 0.8757 (formed early January), with further selling to possibly take aim at weekly support drawn from 0.8696 and daily Quasimodo support at 0.8683.
Dow Jones Industrial Average:
The Dow Jones Industrial Average fell 36.98 points, or 0.12%; the S&P 500 advanced 13.89 points, or 0.36% and the Nasdaq rallied 92.93 points, or 0.69%.
Areas of consideration:
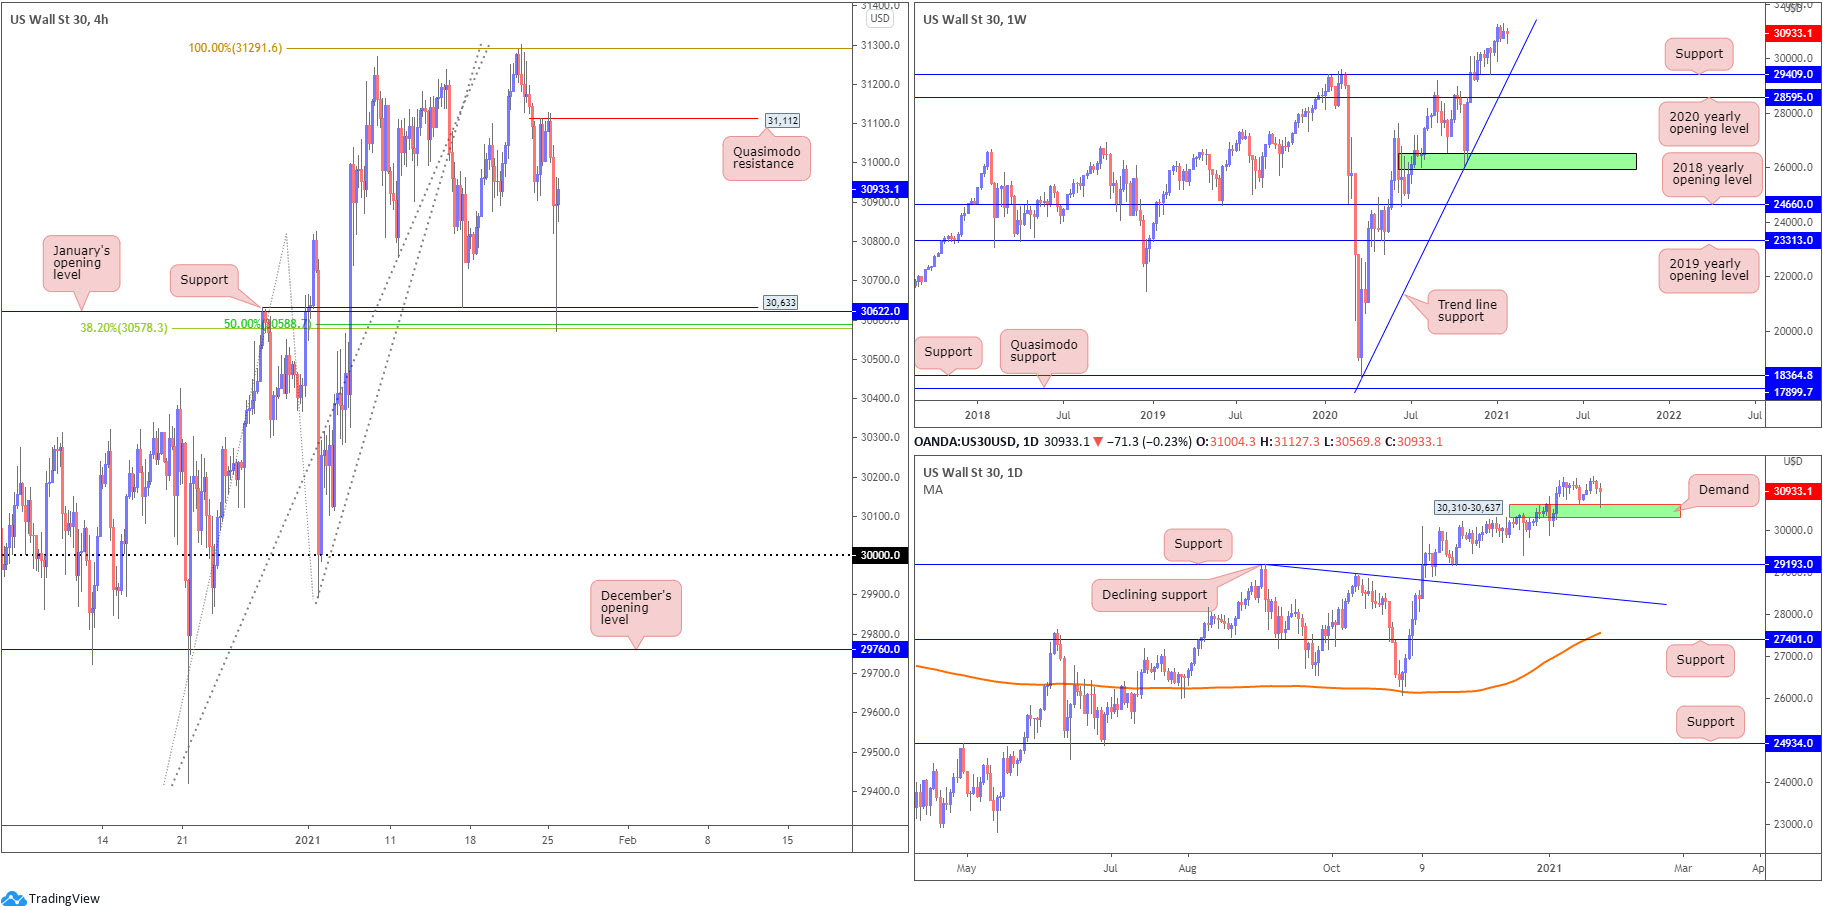
- Price action forged fresh all-time peaks at 31,301 last week, in a market trending decisively higher since the beginning of 2020.
- The weekly timeframe’s trend line support, extended from the low 18,213, is worth noting, though do be aware support at 29,409 could also enter the fight.
- Daily demand at 30,310-30,637 re-entered the frame on Monday and, as you can see, did a superb job holding back sellers. Note this area also encases the H4 support zone between 30,578 and 30,633 (composed of support at 30,633 [a previous Quasimodo resistance level], January’s opening value at 30,622 as well as a 38.2% Fibonacci retracement ratio at 30,578 and a 50.0% retracement ratio at 30,588).
- Those long from daily demand at 30,310-30,637 or the H4 support zone at 30,578-30,633 (both areas were noted in Monday’s technical briefing) have likely reduced risk to breakeven, and perhaps liquidated a portion of their position. Further buying may target H4 Quasimodo resistance at 31,112. A subsequent H4 breakout above 31,291 could fuel a bullish breakout theme to refresh all-time peaks.
XAU/USD (GOLD):
Overall, the price of gold versus the US dollar concluded unmoved on Monday, consequently establishing a daily indecision candle.
Areas of consideration:
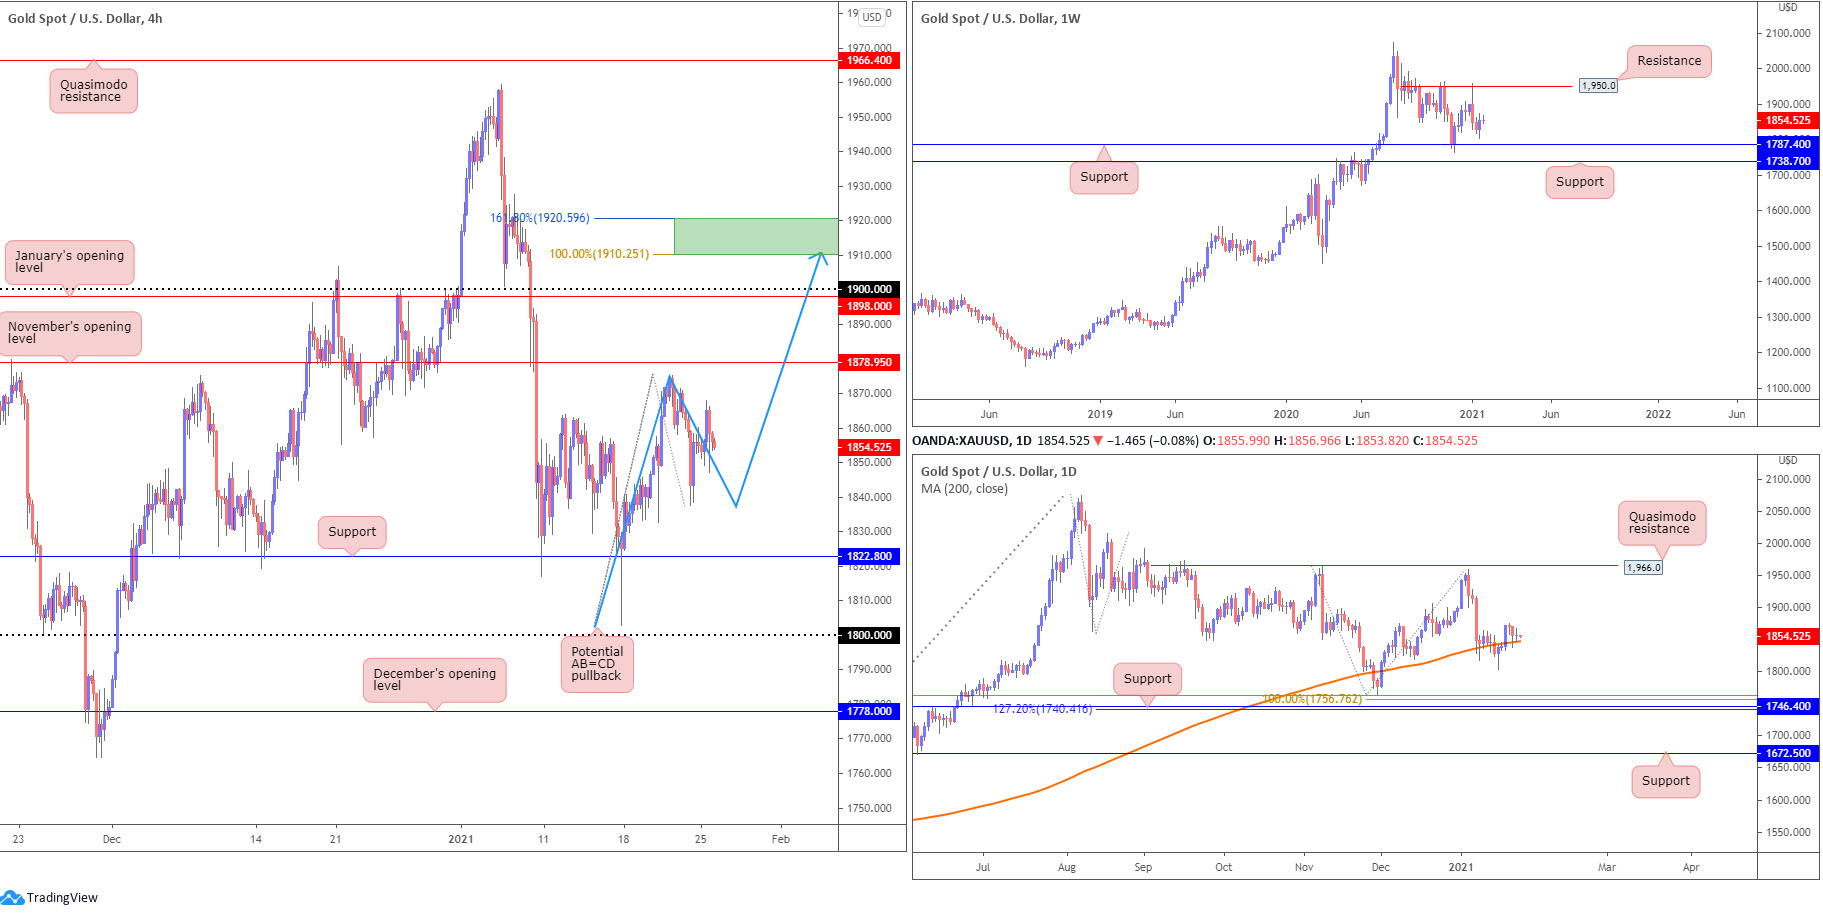
- The weekly timeframe, thanks to last week’s bullish outside reversal candle, could see additional buyers enter the frame this week. Traders may also want to acknowledge weekly support is present at $1,787, set just north of another support at $1,738. The next upside target is fixed at $1,950 resistance.
- In conjunction with the weekly timeframe’s bullish outside reversal candle, price action on the daily timeframe retested the upper edge of the 200-day SMA (orange – $1,847). Besides the $1,959 high formed in early January, buyers could zero in on Quasimodo resistance taken from $1,966. Beyond the noted SMA, support is arranged around $1,746, sited south of a 100% Fibonacci extension point at $1,756, a 50.0% retracement ratio at $1,762 and above a 127.2% Fibonacci extension point at $1,740.
- Based on higher timeframe flow, H4 buyers may approach November’s opening value at $1,878, though a dip to support at $1,822 is certainly not out of the question to collect fresh buyers.
- The H4 AB=CD pullback (blue arrows) around $1,920 and $1,910 (161.8% Fibonacci projection point/100% Fibonacci extension point) is an area sellers may also continue to watch. Although considered a high-probability pattern, the higher timeframes pointing north may limit selling pressure from the zone.
The accuracy, completeness and timeliness of the information contained on this site cannot be guaranteed. IC Markets does not warranty, guarantee or make any representations, or assume any liability regarding financial results based on the use of the information in the site.
News, views, opinions, recommendations and other information obtained from sources outside of www.icmarkets.com.au, used in this site are believed to be reliable, but we cannot guarantee their accuracy or completeness. All such information is subject to change at any time without notice. IC Markets assumes no responsibility for the content of any linked site.
The fact that such links may exist does not indicate approval or endorsement of any material contained on any linked site. IC Markets is not liable for any harm caused by the transmission, through accessing the services or information on this site, of a computer virus, or other computer code or programming device that might be used to access, delete, damage, disable, disrupt or otherwise impede in any manner, the operation of the site or of any user’s software, hardware, data or property.


