
A note on lower timeframe confirming price action…
Waiting for lower timeframe confirmation is our main tool to confirm strength within higher timeframe zones, and has really been the key to our trading success. It takes a little time to understand the subtle nuances, however, as each trade is never the same, but once you master the rhythm so to speak, you will be saved from countless unnecessary losing trades. The following is a list of what we look for:
- A break/retest of supply or demand dependent on which way you’re trading.
- A trendline break/retest.
- Buying/selling tails – essentially we look for a cluster of very obvious spikes off of lower timeframe support and resistance levels within the higher timeframe zone.
- Candlestick patterns. We tend to only stick with pin bars and engulfing bars as these have proven to be the most effective.
For us, lower timeframe confirmation starts on the M15 and finishes up on the H1, since most of our higher timeframe areas begin with the H4.
EUR/USD:
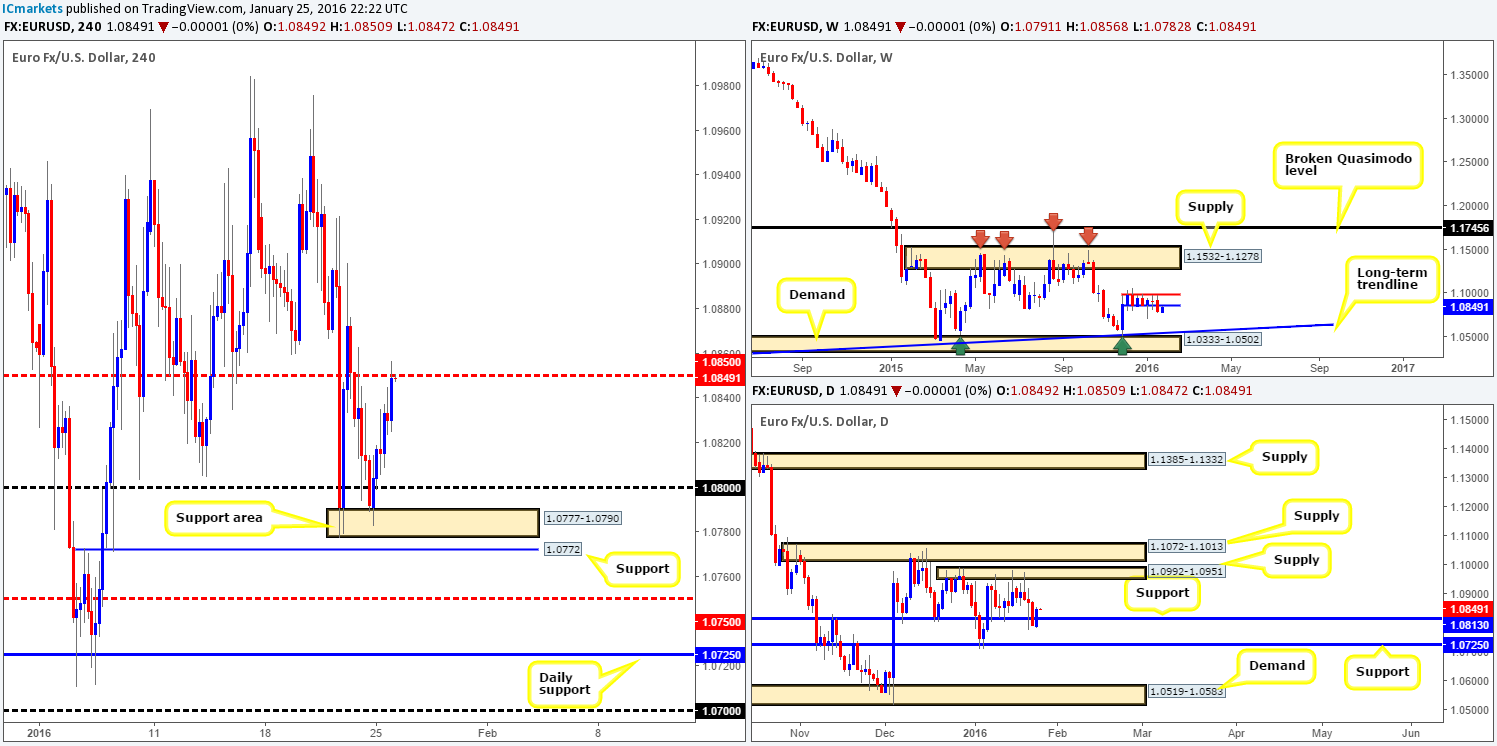
Kicking off our analysis with a quick look at the weekly chart this morning, it’s clear to see price now retesting the recently broken range support at 1.0851 as resistance. Down on the daily chart, nevertheless, the close below support at 1.0813 on Friday saw little follow-through selling during Monday’s session, as price whipsawed back above this hurdle to close the day positively at 1.0849.
Turning our attention to the H4 chart, the EUR found support around the 1.0777-1.0790 area at the open 1.0791, consequently punching through offers at psychological resistance 1.0800 and reaching highs of 1.0856 on the day. With the H4 kissing the underside of mid-level resistance 1.0850 right now as well as the weekly chart showing price trading at resistance around 1.0851, a sell-off may take place today. However, the whipsaw seen through daily support is a little concerning seeing that price could potentially rally back up to daily supply at 1.0992-1.0951.
Given the points made above, 1.0850 will play a key-role in our decision-making process today. If lower timeframe selling confirmation is seen at the underside of this barrier, it may be worth shorting this pair, targeting 1.0800. Alternatively, should the H4 close above 1.0850, this could open up the possibility to longs should price retest this barrier as support together with a lower timeframe buy signal.
Levels to watch/live orders:
- Buys: Watch for offers to be consumed around 1.0850 and look to trade any retest of this number thereafter (lower timeframe confirmation required).
- Sells: 1.0850 [Tentative – confirmation required] (Stop loss: dependent on where one confirms this level).
GBP/USD:
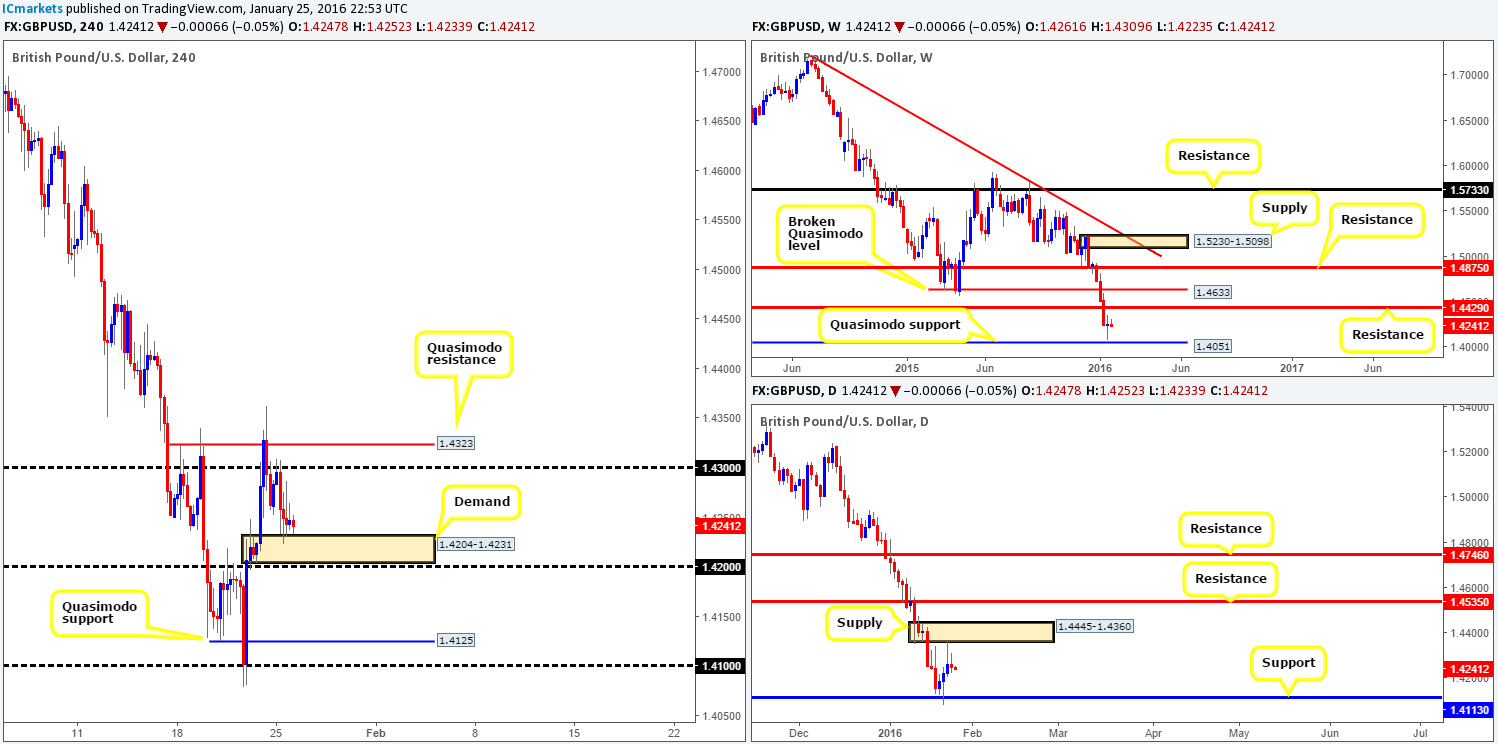
Shortly after the markets opened yesterday, Cable retested psychological resistance 1.4300 beautifully and tumbled lower to H4 demand drawn from 1.4204-1.4231, which held price for the remainder of the day. In all honesty, we did expect a sell-off yesterday (http://www.icmarkets.com/blog/monday-25th-january-weekly-technical-outlook-and-review/) but did not anticipate the above said demand holding quite so strongly.
Unfortunately, up on the bigger picture there’s not much to go on as far as we see. Weekly flow is capped between a weekly Quasimodo support at 1.4051 and weekly resistance hanging above at 1.4429. By the same token, daily action is also sandwiched by supply drawn from 1.4445-1.4360 and support coming in at 1.4113.
To that end, trading long from the current H4 demand is not something we’d stamp high probability. In fact, the only place that we’d consider longs from would be between the H4 Quasimodo support at 1.4125 and psychological support 1.4100. The reason for why is simply because it fuses together with the daily support mentioned above. Unless, price reaches this zone today or trades back up to the aforementioned daily supply, we’ll remain flat for now.
Levels to watch/live orders:
- Buys: 1.4125/1.4100 [Tentative – confirmation required] (Stop loss: dependent on where one confirms this area).
- Sells: Watching daily supply at 1.4445-1.4360.
AUD/USD:
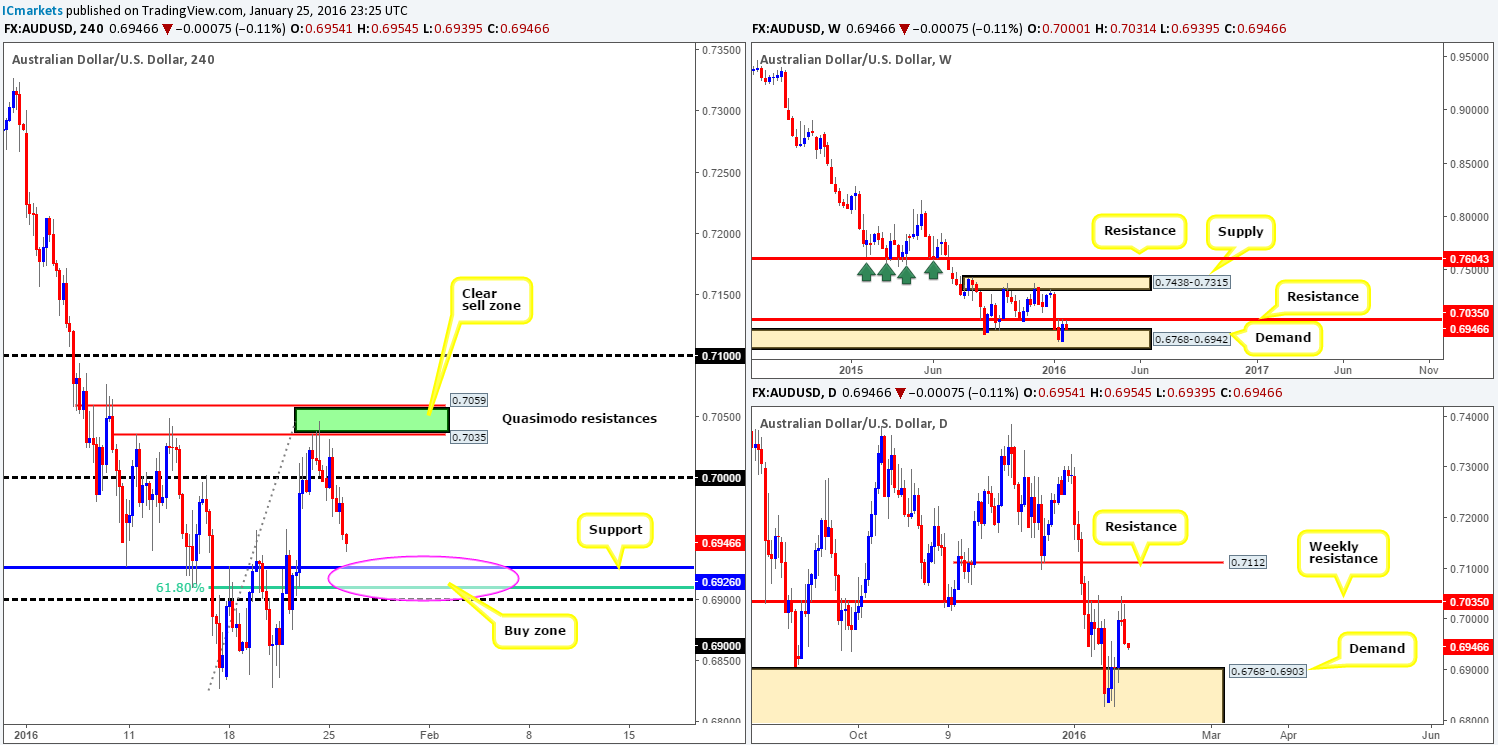
Following Sunday’s open 0.7001 the commodity currency saw a steady stream of bids flow into the market, pushing price to highs of 0.7031. For those who read our previous report (http://www.icmarkets.com/blog/monday-25th-january-weekly-technical-outlook-and-review/), you may recall that we took a short at 0.7034 on Thursday last week and moved our stop to breakeven once partial profits were taken at the large psychological support 0.7000 on Friday. As you can see, price came within two pips of taking us out at breakeven yesterday before collapsing back beneath 0.7000 to lows of 0.6949. With this, it looks as though price is headed in the direction of H4 support painted at 0.6926 – sits twenty or so pips above daily demand at 0.6768-0.6903.
In the event that price reaches here, we’ll liquidate our sell and switch to begin looking for confirmed longs between the above said H4 support and psychological support 0.6900. This, at least in our book, is a high-probability reversal zone since not only does it sit on top of the aforementioned daily demand, it also sits snug within weekly demand at 0.6768-0.6942. Furthermore, there’s additional support seen here from the 61.8% Fibonacci level at 0.6909.
Levels to watch/live orders:
- Buys: 0.6926/0.6900 [Tentative – confirmation required] (Stop loss: dependent on where one confirms this area).
- Sells: 0.7034 [LIVE] (Stop loss: breakeven).
USD/JPY:
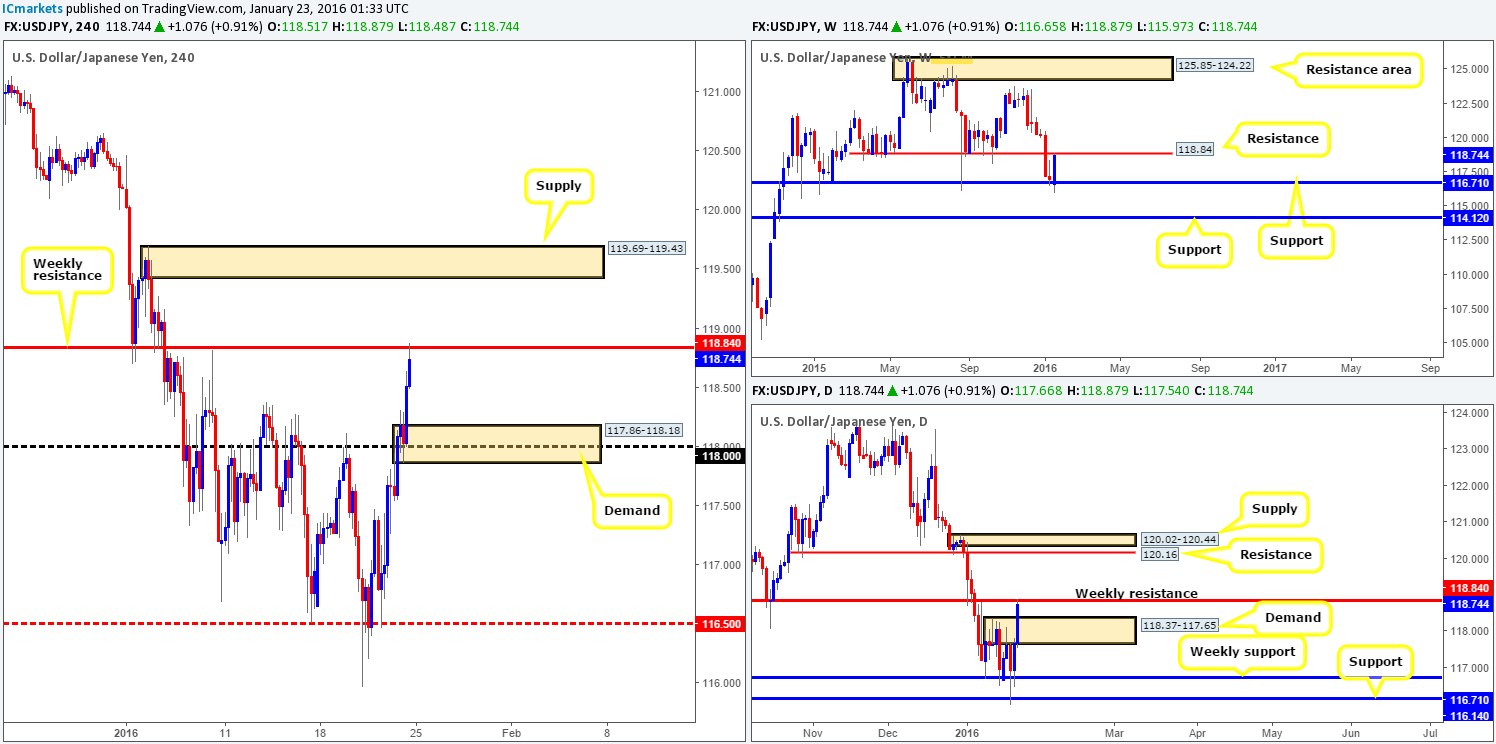
The USD/JPY, as you can see, sold off beautifully from the underside of weekly resistance drawn from 118.84 yesterday down into the jaws of H4 demand at 117.86-118.18 (sits within daily demand at 118.37-117.65). Consequent to this, price is now seen capped between these two zones. Of course, one could look to trade in between here and may work out wonderfully. Despite this, however, we’d much prefer to trade the break of these zones since the profit potential appears more favorable.
A close above 118.84 could, if the level is retested as support, be a nice platform in which to look for confirmed buys from. The first take-profit target from here can be seen at the H4 supply coming in at 119.69-119.43. Be that as it may, price could trade much higher than this area due to the room seen above both the weekly and daily charts, with the closest structure seen around daily resistance at 120.16. Alternatively, a break below daily demand could pressure this market down to weekly support at 116.71/H4 mid-level support 116.50. A retest of this barrier alongside lower timeframe confirmation would be needed for us to short here however.
Levels to watch/live orders:
- Buys: Watch for offers to be consumed around 118.84 and look to trade the any retest seen thereafter (lower timeframe confirmation required).
- Sells: Watch for bids to be consumed around daily demand at 118.37-117.65 and look to trade the any retest seen thereafter (lower timeframe confirmation required).
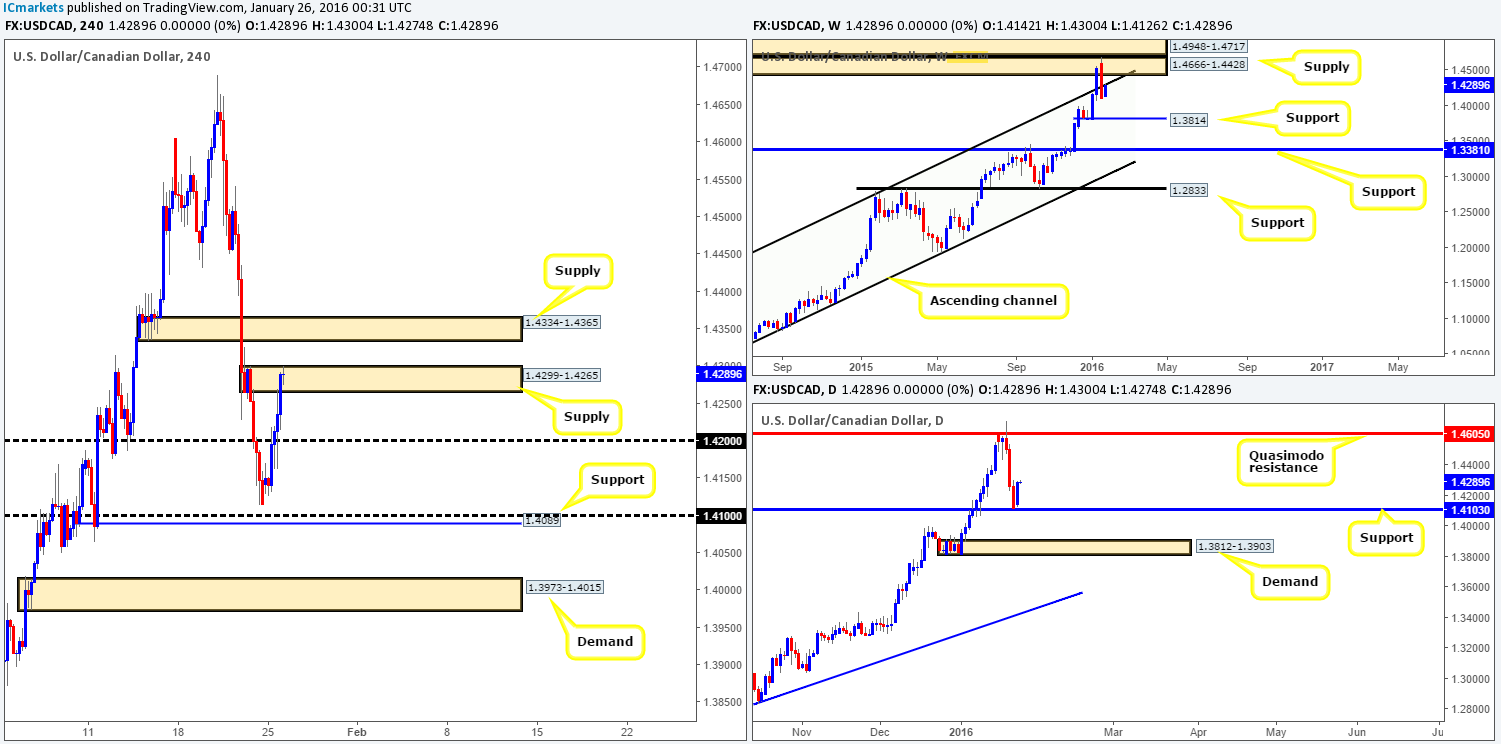
USD/CAD:
Following last week’s strong pullback the USD/CAD bulls responded yesterday by rallying this market close to 150 pips. Psychological resistance 1.4200 was completely wiped out and price ended the day nudging into H4 supply drawn from 1.4299-1.4265.
Given yesterday’s response from just above daily support at 1.4103 as well as the underlying trend on this pair remaining strong, is shorting the current H4 supply or even the one above it at 1.4334-1.4365 such a good idea? Well, it does converge with the weekly channel resistance (1.1173) which was recently brought back into play, and weekly supply at 1.4666-1.4428 is still hanging over current prices, so it may be worth keeping an eye on these areas for potential (confirmed) shorts today. As for longs, nevertheless, price would need to CLOSE above the H4 supply at 1.4334-1.4365 before we’d consider buying.
Levels to watch/live orders:
- Buys: Flat (Stop loss: N/A).
- Sells: 1.4299-1.4265 [Tentative – confirmation required] (Stop loss: dependent on where one confirms this area). 1.4334-1.4365 [Tentative – confirmation required] (Stop loss: dependent on where one confirms this area).
USD/CHF:
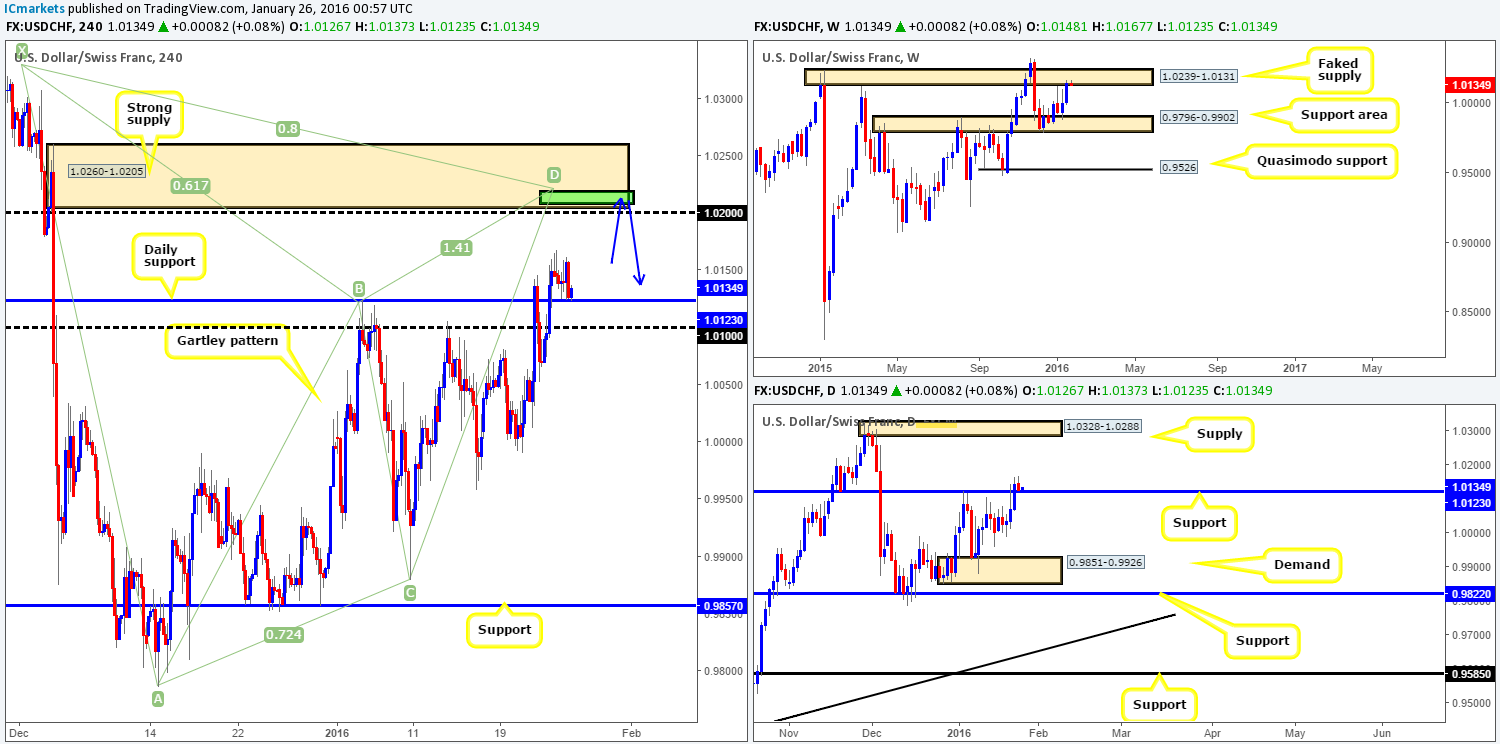
Coming at you directly from the weekly timeframe this morning, price remains teasing the underside of a faked supply area coming in at 1.0239-1.0131, which could potentially suppress buying this week. By contrast, recent movement on the daily timeframe saw price close above resistance drawn from 1.0123, which, as you can see, is now being retested as support. Traders looking to go long from here might want to tread carefully due to where price is positioned on the weekly picture (see above).
Down on the H4 timeframe (much the same as Monday’s report), the overall structure becomes a little clearer. See how Friday’s close above the aforementioned daily resistance has opened the path for prices to challenge H4 supply at 1.0260-1.0205. And boy what a supply this is – just look at that selling momentum! Not only does this supply look tasty, it also boasts a Harmonic Gartley pattern completion point between 1.0207/1.0218 and a psychological resistance 1.0200. The confluence surrounding this area and the fact that its smothered by a weekly sell zone gives us reason to believe that although a little buying may be seen from daily support to reach the above said H4 supply, this market is likely headed south!
All being well, if we have no other positions running, our team will be confident entering short at market around the 1.0203 mark with our stop above at 1.0264. The first take-profit target will be dependent on how the H4 approaches the supply.
Levels to watch/live orders:
- Buys: Flat (Stop loss: N/A).
- Sells: 1.0203 (Stop loss: 1.0264).
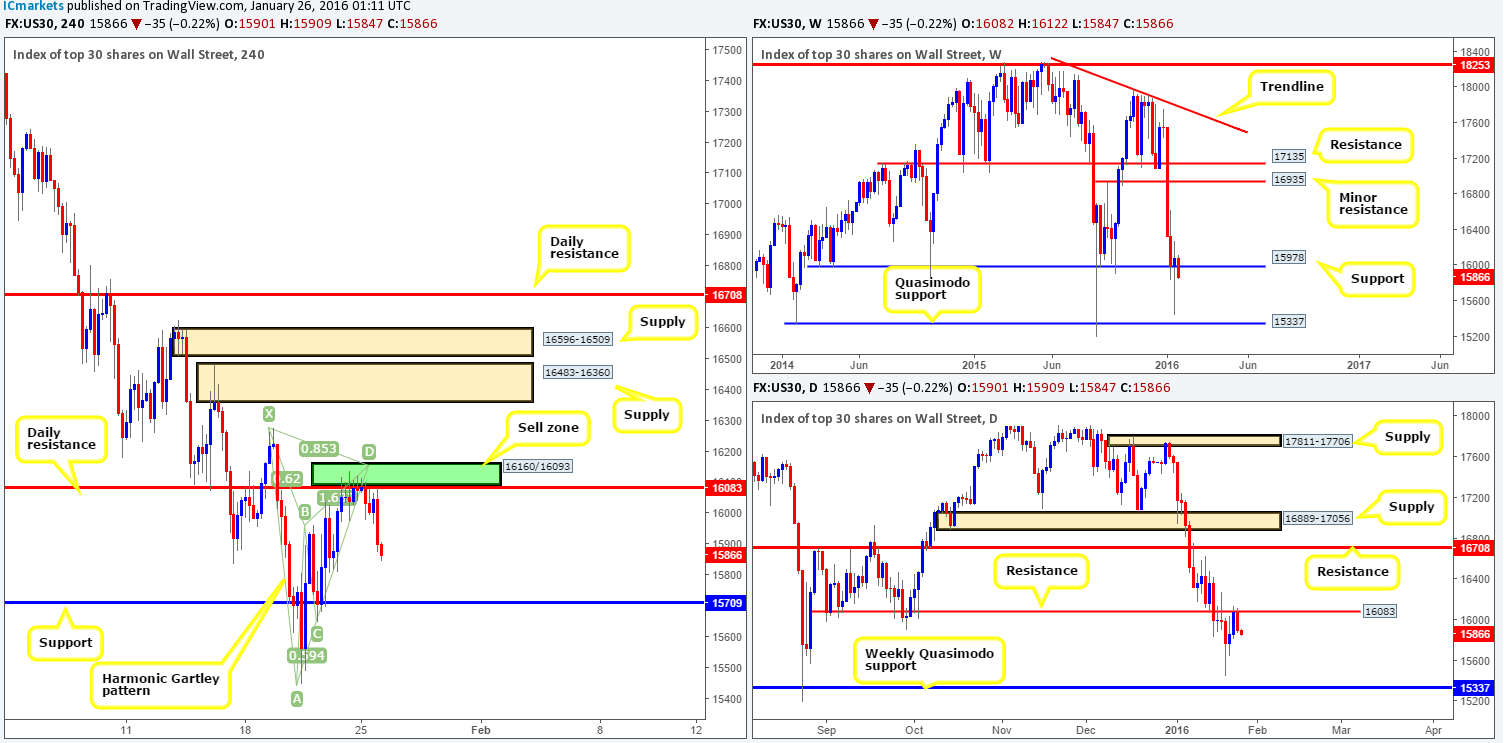
DOW 30:
In our previous report (http://www.icmarkets.com/blog/monday-25th-january-weekly-technical-outlook-and-review/) it was noted to keep an eye on the H4 Harmonic Gartley pattern completing around the 16160/16093 area (green box) for lower timeframe (confirmed) shorts. Since we are still short the Aussie, we unfortunately passed on this selling opportunity. Well done to any of our readers who managed to secure a position here. The overall target objective for this trade was originally around H4 support at 15709. However, we would, judging by the reaction from daily resistance at 16083 and the room seen to drop lower to the weekly Quasimodo support at 15337, possibly look to hold this trade beyond 15709. Taking 50% off of your position at 15709 and moving the stop to breakeven would be wise in our opinion, allowing the remaining 50% room to run.
If you missed this recent short, there might be an opportunity to board this train south should price break below the aforementioned H4 support level and retest it as resistance (lower timeframe confirmation preferred).
Levels to watch/live orders:
- Buys: Flat (Stop loss: N/A).
- Sells: Watch for bids to be consumed around 15709 and look to trade the any retest seen thereafter (lower timeframe confirmation required).
XAU/USD: (Gold)
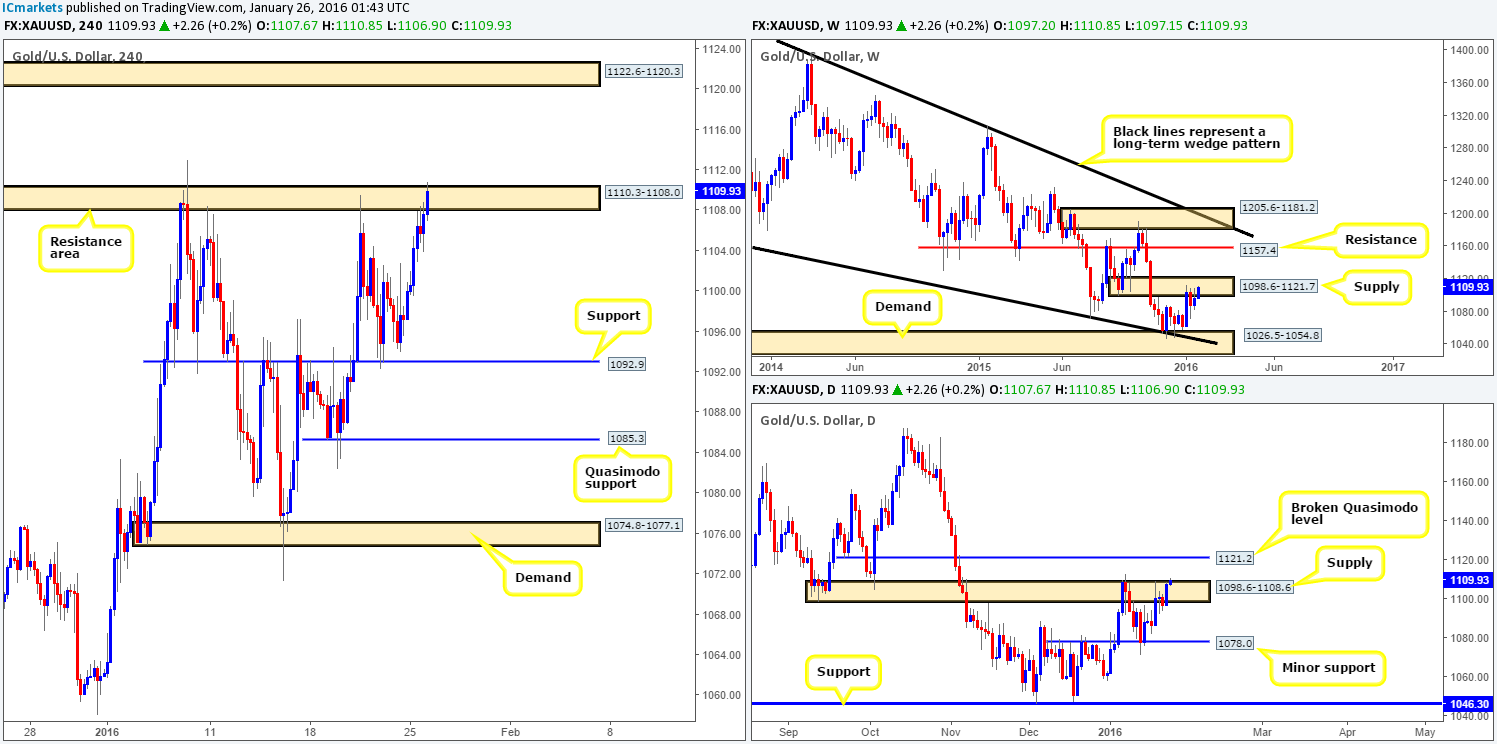
Gold was clearly a favorite among investors yesterday as price was bid to highs of 1108.7 by the day’s end. This, as can be seen from the H4 chart, forced the yellow metal into the jaws of a H4 resistance area coming in at 1110.3-1108.0, which is currently holding firm for the time being. This may have something to do with price also seen trading within both a daily supply coming in at 1098.6-1108.6 and a weekly supply drawn from 1098.6-1121.7.
Despite this, since late 2015 the metal has been relatively well bid, so a push above the current H4 and daily supply should not come as much of a surprise. Therefore, selling at current prices should be done so only with the backing of a lower timeframe setup preferably from the M30 or M60 timeframes i.e. break of demand or selling wicks at lower timeframe resistance etc… In the case that H4 action convincingly closes above the H4 supply today, the path north on this timeframe appears free up to H4 supply coming in at 1122.6-1120.3, which beautifully encapsulates a broken daily Quasimodo level at 1121.2 and also converges with the upper extreme of the above said weekly supply. As such, longs (alongside lower timeframe confirmation) could be possible on any retest of this barrier seen thereafter.
Levels to watch/live orders:
- Buys: Watch for offers to be consumed around H4 supply at 1110.3-1108.0 and look to trade any retest seen thereafter (lower timeframe confirmation required).
- Sells: Flat (Stop loss: N/A).


