
A note on lower timeframe confirming price action…
Waiting for lower timeframe confirmation is our main tool to confirm strength within higher timeframe zones, and has really been the key to our trading success. It takes a little time to understand the subtle nuances, however, as each trade is never the same, but once you master the rhythm so to speak, you will be saved from countless unnecessary losing trades. The following is a list of what we look for:
- A break/retest of supply or demand dependent on which way you’re trading.
- A trendline break/retest.
- Buying/selling tails – essentially we look for a cluster of very obvious spikes off of lower timeframe support and resistance levels within the higher timeframe zone.
- Candlestick patterns. We tend to only stick with pin bars and engulfing bars as these have proven to be the most effective.
For us, lower timeframe confirmation starts on the M15 and finishes up on the H1, since most of our higher timeframe areas begin with the H4.
EUR/USD:
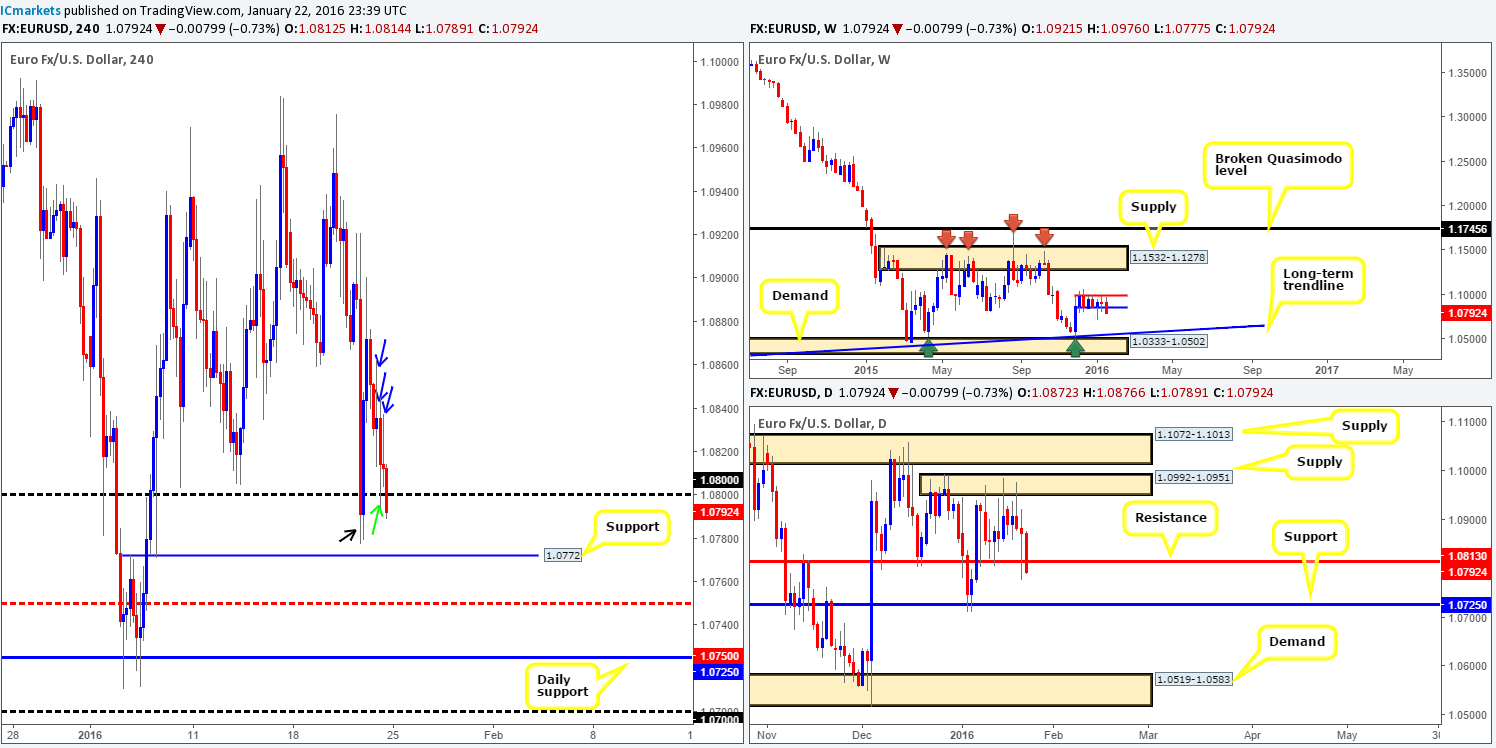
The past week saw the single currency decline around 115 pips into the close 1.0792, forcing price to close below weekly range support coming in at 1.0851 (blue line). Should the sellers manage to hold ground beneath this barrier this week, there’s little to stop them, at least on this timeframe, from dragging this pair down to the long-term weekly trendline extended from the low 1.0823.
Moving down to the daily timeframe, support at 1.0813 was taken out on Friday, potentially opening the path for further selling this week down to at least support drawn from 1.0725. Beyond this barrier, however, we’re looking at demand fixed between 1.0519-1.0583, which if you look back to the weekly chart, you’ll notice it converges beautifully with the aforementioned trendline support.
Turning our attention now to the H4 chart, we can see that the week ended with a close below psychological support 1.0800. With this in mind, here is what we see right now:
- The green arrow marks price rebounding from 1.0800 during the U.S. open. This move clearly filled bids around this barrier, quickly reaching highs of 1.0837.
- The blue arrows above point to what we believe to be supply consumption. Check out how each wick (1.0837/1.0845/1.0862) stabs north while the market is in decline. This indicates, at least to us, offers are weak above 1.0800.
- The black arrow marks a rather aggressive fakeout below 1.0800 on Thursday.
Therefore, with little offers likely remaining above 1.0800 and the rebound from 1.0800 (green arrow) likely taking out the remaining unfilled bids here from Thursday’s fakeout, we believe the close below 1.0800 is likely legit. That being the case, our team will be looking for a confirmed retest of 1.0800 around the open today. Targets, should the trade come to fruition, fall in at H4 support drawn from 1.0772, followed closely by mid-level support 1.0750 and then finally the daily support mentioned above at 1.0725. We may, due to what we’re currently seeing on the weekly timeframe (assuming our trade reaches final take profit that is), look to leave some of the position in the market this week to try and take advantage of any further selling seen.
Levels to watch/live orders:
- Buys: Flat (Stop loss: N/A).
- Sells: 1.0800 [Tentative – confirmation required] (Stop loss: dependent on where one confirms this level).
GBP/USD:
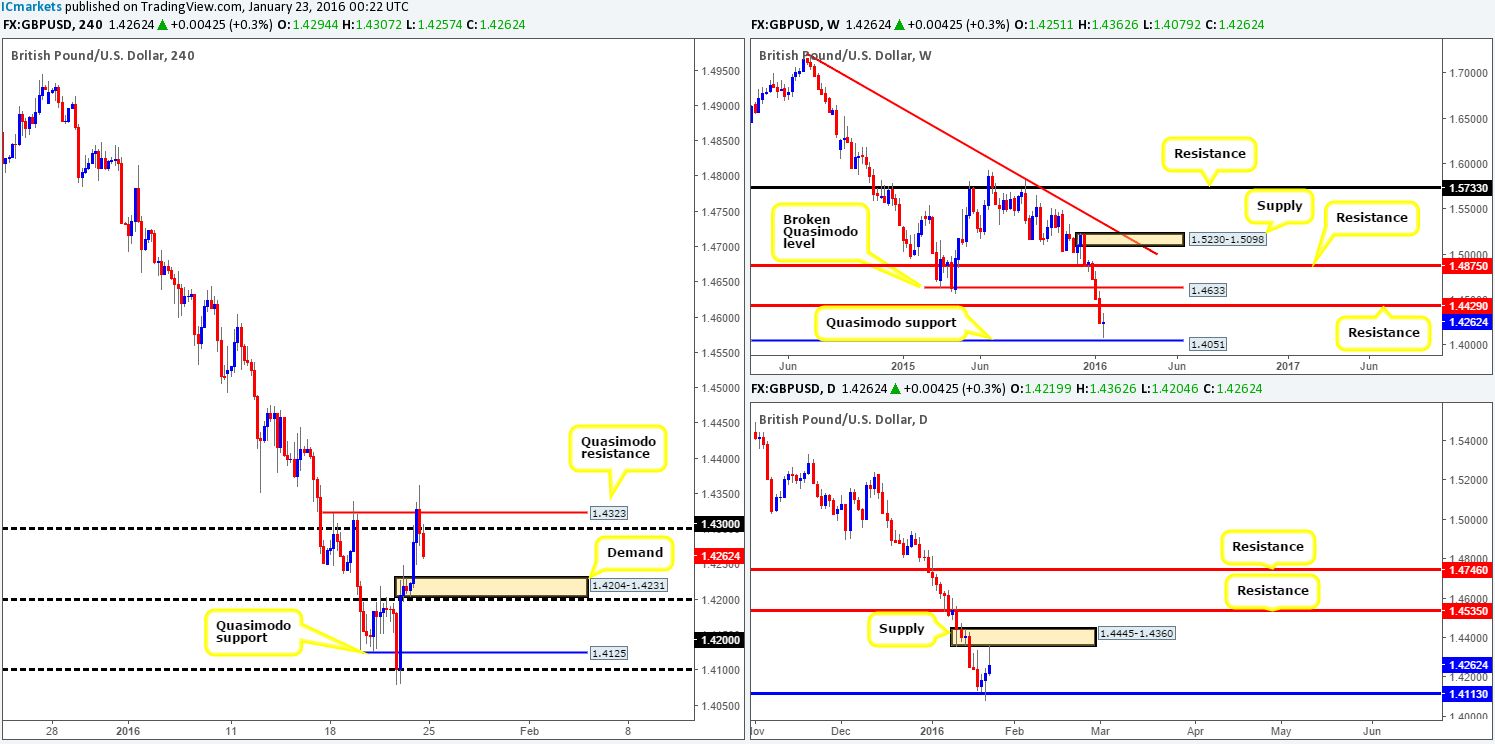
Following three weeks of continuous selling, the foot was taken off the gas last week as prices came so very close to kissing the weekly Quasimodo support at 1.4051. This saw the market end the week relatively unchanged at 1.4262, resulting in a weekly indecision candle forming. Both the aforementioned Quasimodo support and weekly resistance hanging above at 1.4429 could come into play this week, so make sure to have these levels noted.
From the daily chart, however, Cable was seen bid from support at 1.4113 during mid-week trading, which saw prices attack offers around supply drawn from 1.4445-1.4360 on Friday and print a nice-looking selling wick. Since this supply encapsulates the above said weekly resistance line at 1.4429, this area could play a significant role in this week’s trading. If you’re looking to trade from support at 1.4113, nevertheless, this could be risky due to the weekly Quasimodo support mentioned above at 1.4051 lingering just below (fakeout possible).
A quick recap of Friday’s sessions on the H4 shows that the Pound was well-bid going into London trade, breaking above both psychological resistance 1.4300 and Quasimodo resistance at 1.4323. However, with daily supply (see above) hovering just above this level, it did not come as much of a surprise to see Cable then drop to lows of 1.4257 by the week’s end.
Taking into account that price reacted to the underside of a daily supply which fuses beautifully with a weekly resistance (see above for levels), we’re not keen on buying from the H4 demand seen below at 1.4204-1.4231. In fact, we highly anticipate this barrier being taken out. That being the case we see two options here today. The first, if price retests the 1.4323/1.4300 area as resistance, we may, dependent on lower timeframe action, look to short. Secondly, one could wait for price to close below the current H4 demand and look for a confirmed retest thereafter. Either way, the overall take-profit target for both trades would be the H4 Quasimodo support seen below at 1.4125.
Levels to watch/live orders:
- Buys: Flat (Stop loss: N/A).
- Sells: 1.4323/1.4300 [Tentative – confirmation required] (Stop loss: dependent on where one confirms this area). Watch for price to consume bids around H4 demand at 1.4204-1.4231 and look to trade any retest thereafter (lower timeframe confirmation required).
AUD/USD:
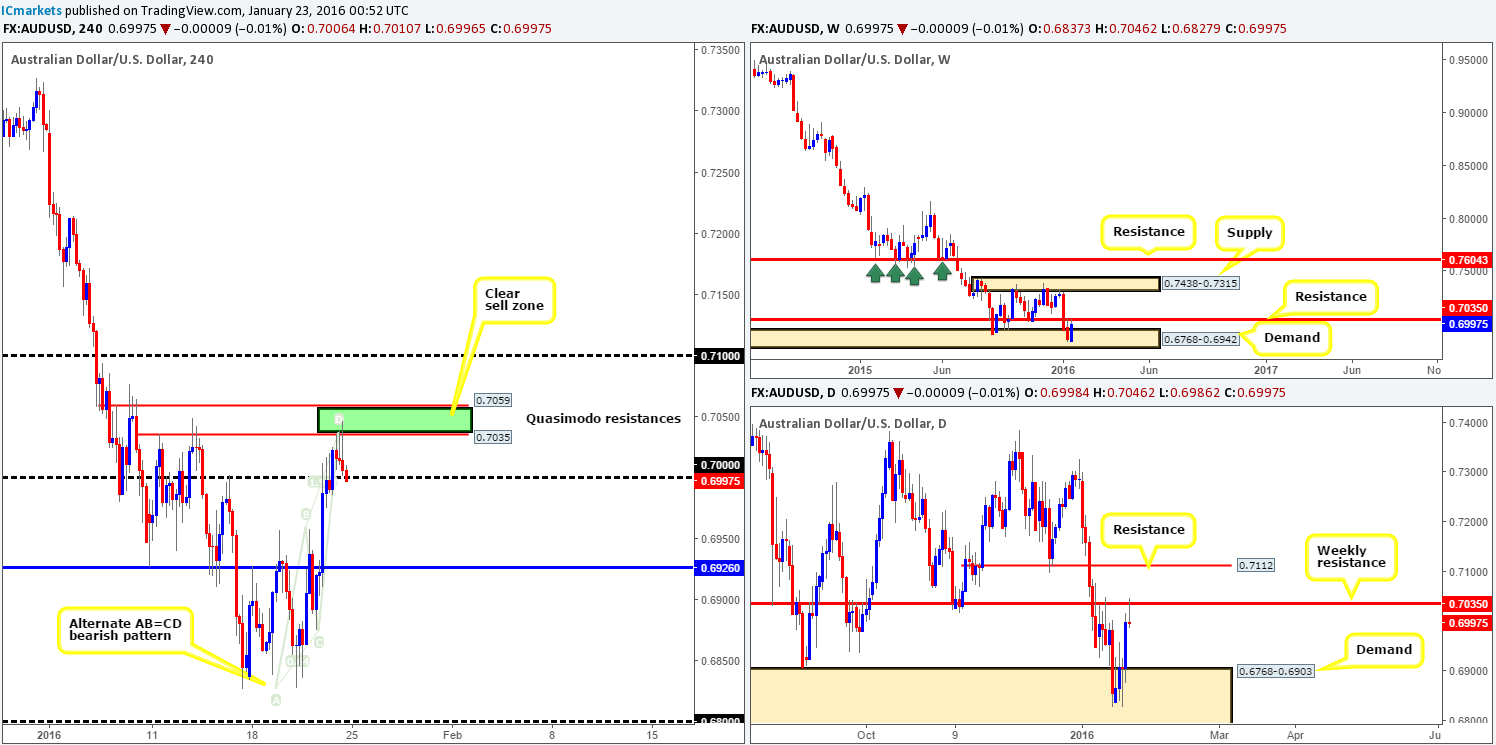
The Aussie dollar performed relatively well last week, positing gains of around 150 pips by the close 0.6997. Technically, this rally came about from within weekly demand seen at 0.6768-0.6942, which, as you can see, dragged this pair up into the jaws of weekly resistance at 0.7035. Traders may have also noticed that price formed a bullish engulfing candle. However, trading this pattern knowing we’re touching base with resistance is too risky for our liking!
Looking to the daily chart, one can see that the Aussie printed a picture-perfect selling wick from the underside of the aforementioned weekly resistance on Friday. This – coupled with room to move back down to daily demand at 0.6768-0.6903, we see no reason, at least technically, why this pair will not continue to decline early on this week.
For those who read Friday’s report (http://www.icmarkets.com/blog/friday-22nd-january-heavy-day-for-the-eur-currency-today-volatility-expected/), you may recall that we placed a pending sell order at 0.7034, with a stop at 0.7066 (above the upper Quasimodo high). As is shown on the chart, our order was filled and price tumbled lower, closing below the large psychological support 0.7000 into the weekend. We forgot to add targets for this trade, we apologize! Partial profits have already been taken at 0.7000 and our stop is now firmly placed at breakeven. With the small close below 0.7000 and the fact that we’re coming off of weekly resistance (see above), there’s possibility for further downside this week in our opinion. Ultimately, we are eyeing the H4 support at 0.6926 as a final take-profit level, which sits twenty or so pips above the aforementioned daily demand.
For those who missed the short entry on Friday, there may, if price retests 0.7000 as resistance this week, be an opportunity to join this potential move down to 0.6926. Nevertheless, we would strongly advise only shorting this number with lower timeframe confirming price action.
Levels to watch/live orders:
- Buys: Flat (Stop loss: N/A).
- Sells: 0.7034 [LIVE] (Stop loss: breakeven). Possible retest trade at 0.7000 (lower timeframe confirmation required).
USD/JPY:
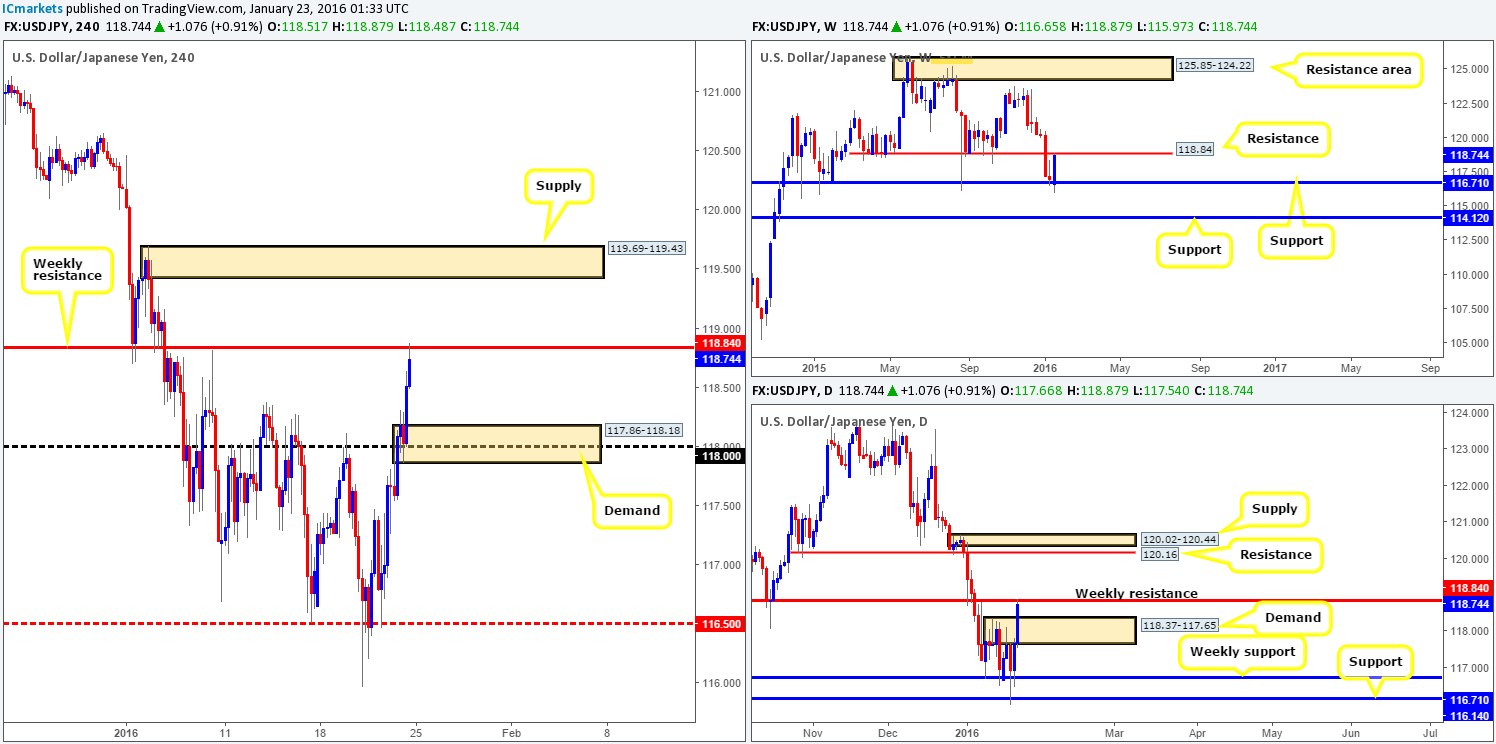
A stronger than expected rebound from weekly support at 116.71 last week saw the U.S. dollar increase around 180 pips in value against the Japanese Yen at the close 118.74. Due to this recent buying, price is now seen crossing swords with weekly resistance drawn from 118.84. To that end, going long on the basis of the engulfing candle recently printed may not be the best path to take. It will be interesting to see what the lower timeframes have to offer…
Branching lower to the daily chart, the USD/JPY was capped between the above said weekly support and a daily supply zone seen at 118.37-117.65 Monday through to Wednesday last week. It was only once we entered into Thursday and Friday’s session did we see this pair bid above the aforementioned supply into the weekly resistance level mentioned above at 118.84. Now, on both the weekly and daily charts, we can see that should price close above the weekly resistance this week, the path appears clear for further upside to at least 120.16. Therefore, do keep in this in mind should this take place. To the downside, however, shorts are going to be tight with the recently broken supply lurking just below at 118.37-117.65 potentially acting as demand now!
Stepping down one more level to the H4, readers may recall us mentioning in Friday’s report (http://www.icmarkets.com/blog/friday-22nd-january-heavy-day-for-the-eur-currency-today-volatility-expected/) that if a close above 118.00 is seen, this would open up the gates for prices to challenge weekly resistance at 118.84. In addition to this, we also spoke about entering long should price retest 118.00 as support following a close higher. As you can see, price held beautifully at 118.00. Unfortunately, we passed on this trade due to being short the AUD/USD, well done to any of our readers who managed to lock in some green pips here!
As far as we’re concerned, today’s trading will simply either see price reject the current weekly resistance, or break above it. In the event that you manage to spot lower timeframe selling around this level, shorting down to H4 demand at 117.86-118.18 is an option. Alternately, a close above the weekly barrier could, if the level is retested as support, be a nice platform in which to look for confirmed buys from. The first take-profit target from here can be seen at the H4 supply coming in at 119.69-119.43. Be that as it may, do remember that prices could go much higher than here, as we explained in the daily section above in bold.
Levels to watch/live orders:
- Buys: Watch for offers to be consumed around 118.84 and look to trade the any retest seen thereafter (lower timeframe confirmation required).
- Sells: 118.84 [Tentative – confirmation required] (Stop loss: dependent on where one confirms this level).
USD/CAD:
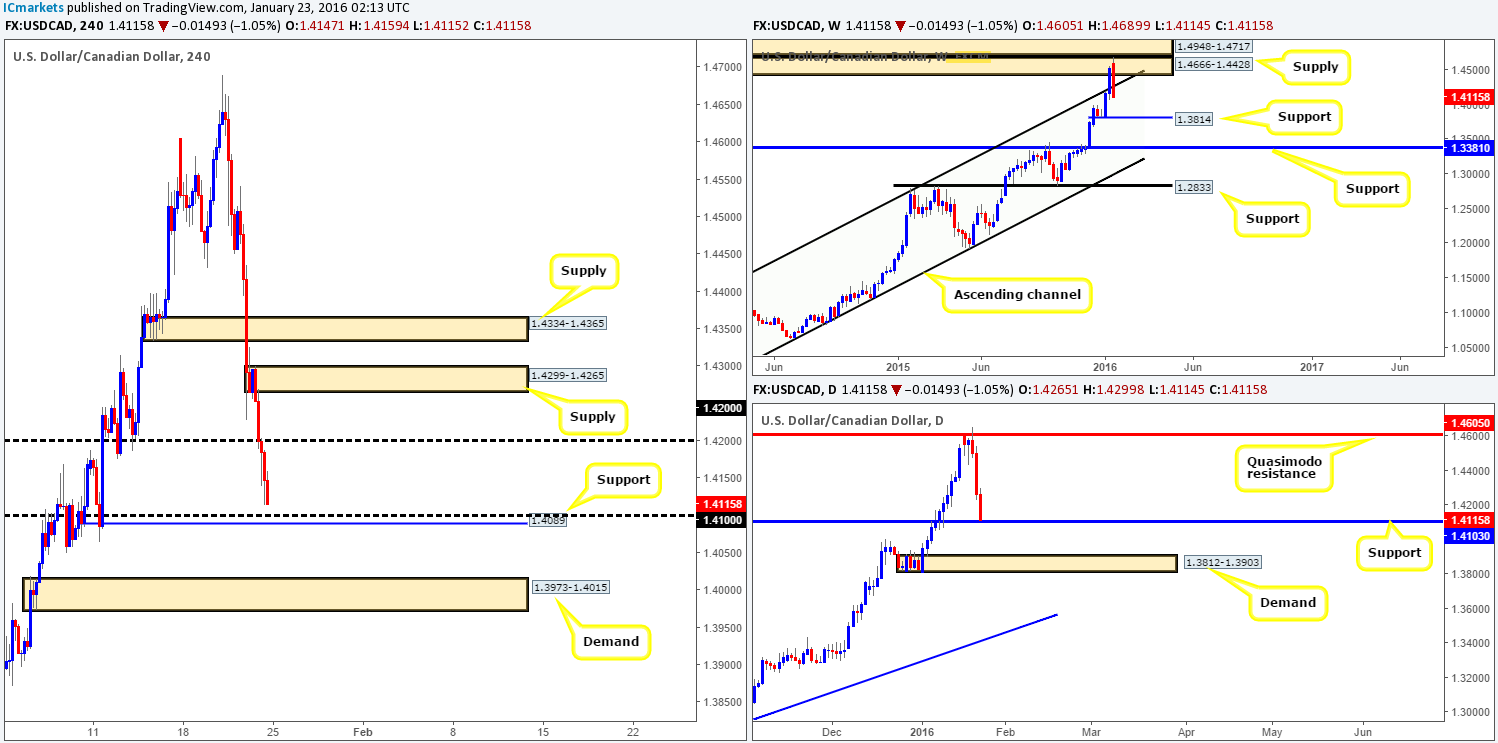
The USD/CAD had a rather eventful week with the Loonie dropping over 400 pips into the close 1.4115, which began following the BoC’s decision to keep rates at 0.50% versus an expected rate cut down to 0.25%. This recent selling has seen prices drive back into the long-term weekly ascending channel (1.0620/1.1173), which could encourage further selling down into the jaws of weekly support at 1.3814 this week.
By contrast, daily action ended the week closing just above support coming in at 1.4103. This is quite a significant level in our opinion and one that should be watched closely this week, since this is all that stands in the way of a move down to demand at 1.3812-1.3903 (sits around the aforementioned weekly support).
Stepping down to the H4 timeframe, we can see that due to Friday’s sell-off price closed the week out just above an area of H4 support formed by the psychological number 1.4100 and H4 support at 1.4089. This – coupled with daily flow trading close to support at 1.4103 potentially lays a foundation for a buy trade here early on this week. In spite of this, let’s not forget where price is coming from – weekly supply at 1.4666-1.4428! This pressure could possibly derail any bids sitting at the above mentioned supports, so trading this level should only be possibility with the aid of a lower timeframe confirmation (preferably on the M30/M60).
In the case that both H4 supports and daily support is taken out, shorting this pair looks favorable down to H4 demand coming in at 1.3973-1.4015. For us to be given the green light to short following a close lower, nonetheless, we’d need to see two things happen. Firstly, a retest of the 1.4100 region as resistance, and secondly a lower timeframe sell signal following the retest.
Levels to watch/live orders:
- Buys: 1.4100 region [Tentative – confirmation required] (Stop loss: dependent on where one confirms this area).
- Sells: Watch for bids to be consumed around 1.4100 and look to trade the any retest seen thereafter (lower timeframe confirmation required).
USD/CHF:
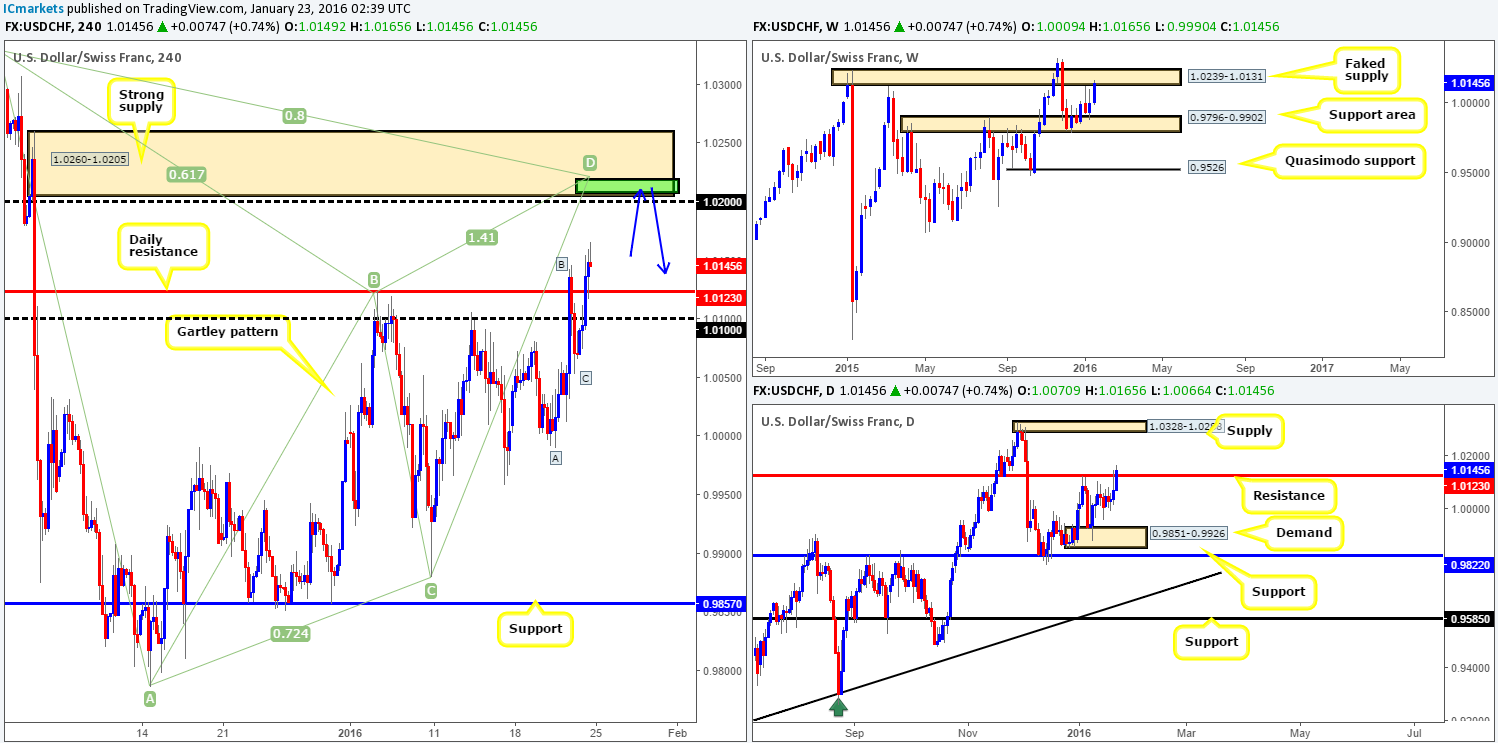
Further buying was seen last week on the USD/CHF following a rebound from a weekly support area painted at 0.9796-0.9902. This increased the pair’s value by 140 pips at the close 1.0145 and drove into the teeth of a faked weekly supply area coming in at 1.0239-1.0131. As a result, traders may want to be cautious about taking medium-term longs in this market this week!
On the other side of the ledger, recent movement on the daily timeframe forced price to close above resistance drawn from 1.0123. Traders need to take this close with a pinch of salt in our opinion. Yes, it was a legit close, but with price teasing the underside of a weekly sell zone at the same time, it could merely be a fakeout to take in stops to drive this unit lower. Keep this in mind while we take a look at the H4 timeframe…
From this angle, the overall picture becomes clearer. See how Friday’s close above the aforementioned daily resistance has opened the path for prices to challenge H4 supply at 1.0260-1.0205. And boy what a supply this is – just look at that selling momentum! Not only does this supply look tasty, it also boasts a Harmonic Gartley pattern completion point between 1.0207/1.0218, a psychological resistance 1.0200 and a potential Harmonic AB=CD approach. The confluence surrounding this area and the fact that its smothered by a weekly sell zone gives us reason to believe that although a little buying may be seen early on to reach the above said H4 supply, this market is likely headed south!
All being well, if we have no other positions running, our team will be confident entering short at market around the 1.0203 mark with our stop above at 1.0264. The first take-profit target will be dependent on how the H4 approaches the supply.
Levels to watch/live orders:
- Buys: Flat (Stop loss: N/A).
- Sells: 1.0203 (Stop loss: 1.0264).
DOW 30:
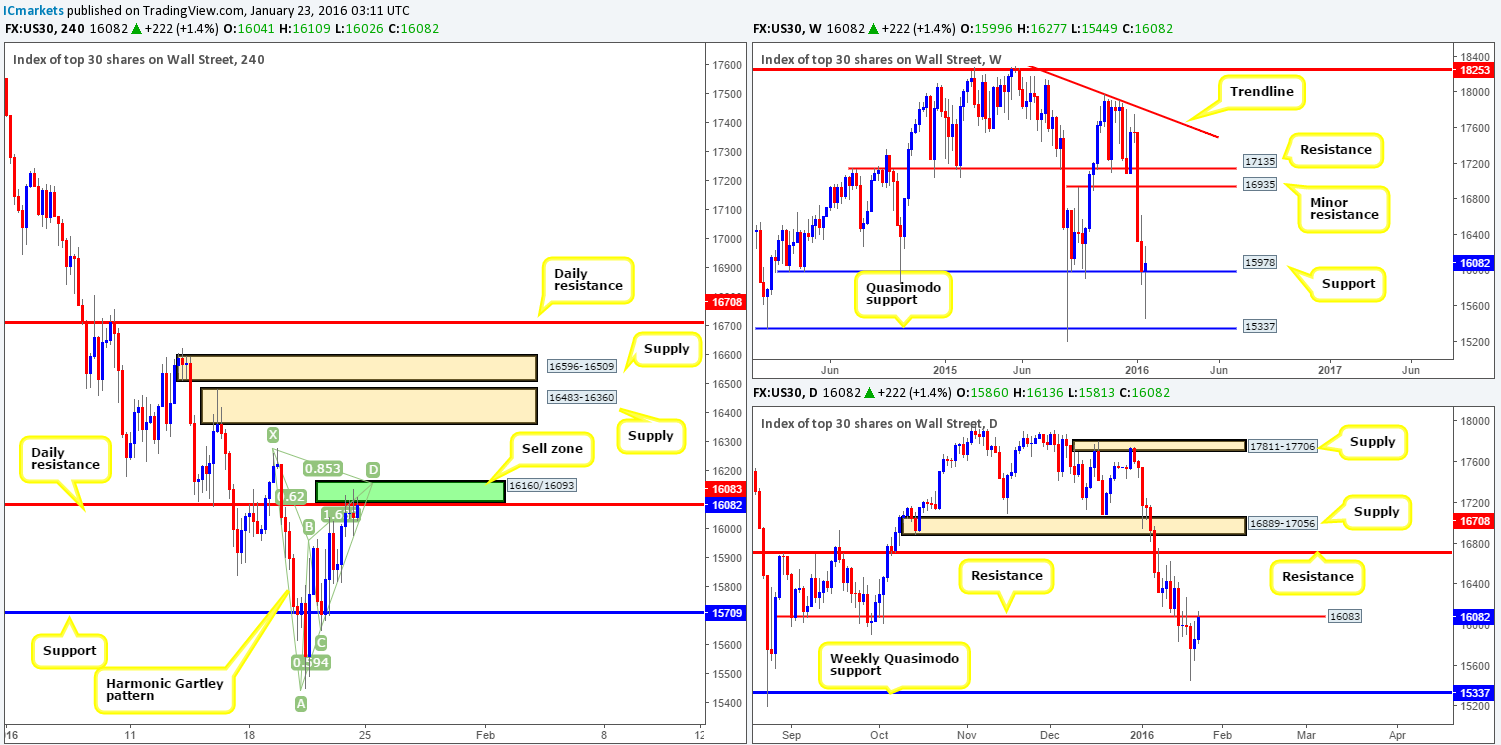
Relatively heavy volatility was seen on the DOW during the course of last week, ranging over 800 points. Despite this flurry of buying and selling, however, the market closed a mere 86 points higher at the closing price of 16082. As we can all see, price still remains bid above weekly support at 15978, which might entice buyers into this market this week. On the flip side, daily action has yet to break above daily resistance drawn from 16083. Until this happens, buying this market is out of the question for us.
Zooming in and looking at the H4 chart, nevertheless, it’s clear to see that there were willing offers at the Harmonic Gartley pattern completing around the 16160/16093 area (green box) on Friday. As we mentioned in our previous report (http://www.icmarkets.com/blog/friday-22nd-january-heavy-day-for-the-eur-currency-today-volatility-expected/), trading this short without any supporting lower timeframe price action was risky due to where price is positioned on the weekly chart (see above). Although there was adequate confirmation seen on the lower timeframes to short this index at the Harmonic H4 sell zone, we refrained due to already being short the AUD/USD. Despite this, traders should still keep their eye on this boundary for confirmed shorts this week, with an overall target objective seen around H4 support at 15709.
On the occasion that price makes a run higher, it’s likely the DOW will stretch its arms out to at least H4 supply coming in at 16483-16360, followed closely by H4 supply just above at it 16596-16509. As such, longs could be possible should price retest the broken Harmonic sell zone as support alongside lower timeframe confirming action.
Levels to watch/live orders:
- Buys: Watch for offers to be consumed around 16160/16093 and look to trade the any retest seen thereafter (lower timeframe confirmation required).
- Sells: 16160/16093 [Tentative – confirmation required] (Stop loss: dependent on where one confirms this area but the safest bet would be above the X point at 16286).
XAU/USD: (Gold)
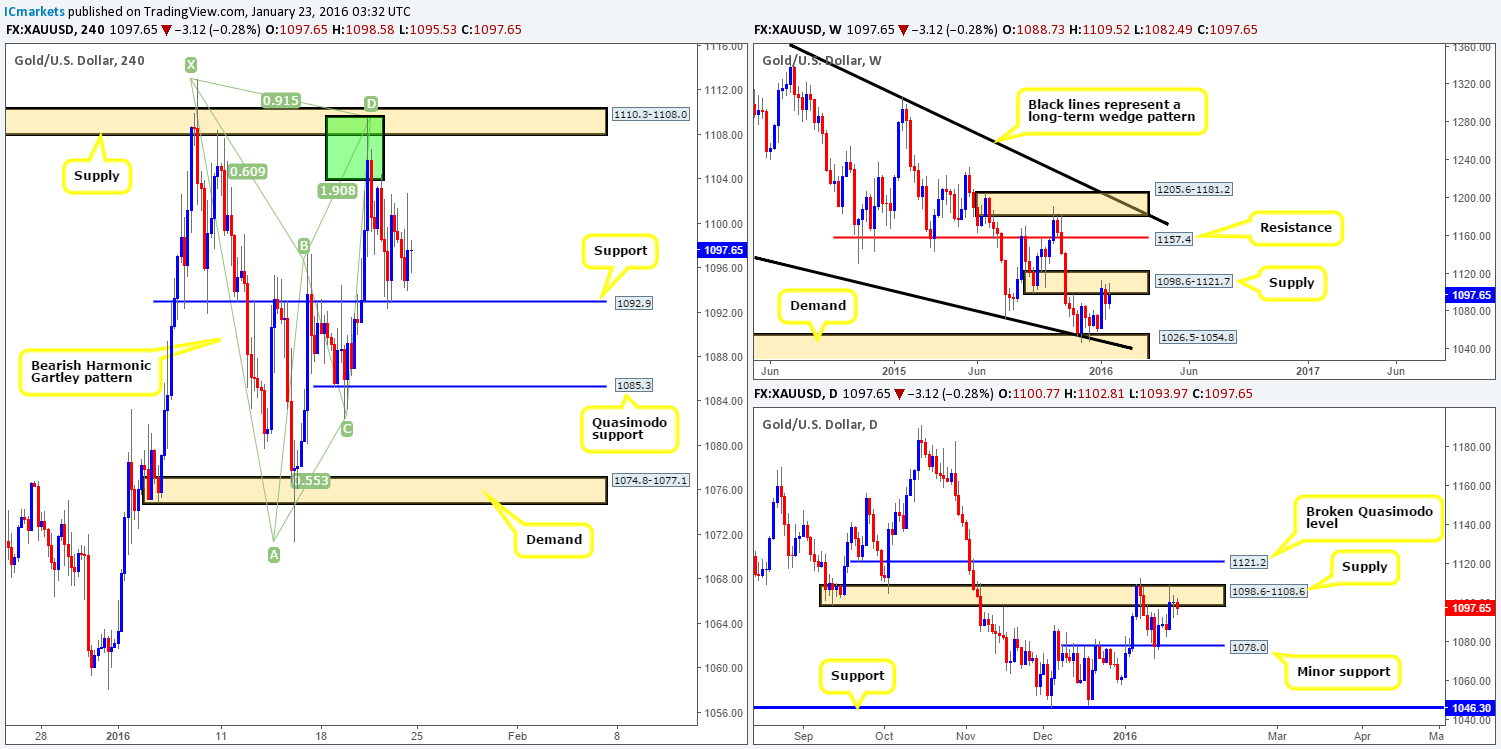
Although the yellow metal recorded a gain of close to $9 last week, Gold remains loitering at the underside of weekly supply painted at 1098.6-1121.7. Downside targets from here fall in around the weekly demand coming in at 1026.5-1054.8. A close above the current supply, nevertheless, places weekly resistance at 1157.4 in view.
In-line with the weekly timeframe, price action on the daily timeframe is also seen lingering around supply drawn from 1098.6-1108.6. The only difference we see from this angle is that a push lower from here has the minor support level at 1078.0 to target, and upon a break above the present supply, a broken Quasimodo line at 1121.2 will be the next objective to reach.
For those who are still short Gold from our call on Wednesday at the Harmonic Gartley reversal zone seen on the H4 between 1103.8/1110.3, well done! Stops should be at breakeven now and a nice chunk of your profits locked away.
Much like Friday’s report, given the position of price on the higher timeframes right now (see above), looking to buy from the current H4 support at 1092.9 is not something our team would be comfortable with. Therefore, unless you’re one of the traders who managed to short the Gartley reversal zone on Wednesday, the only opportunity available today and possibility into the week, as far as we see, is on a break below and confirmed retest of the above said H4 support. Should this move come to fruition and we manage to get filled, we’ll immediately be targeting the H4 Quasimodo support below at 1085.3, followed by H4 demand seen just below it at 1074.8-1077.1 (sits just below the minor daily support at 1078.0).
Levels to watch/live orders:
- Buys: Flat (Stop loss: N/A).
- Sells: Watch for bids to be consumed around 1092.9 and look to trade any retest of this number seen thereafter (lower timeframe confirmation required).