
Key risk events today:
US CB Consumer Confidence; Richmond Manufacturing Index.
(Previous analysis as well as outside sources – italics).
EUR/USD:
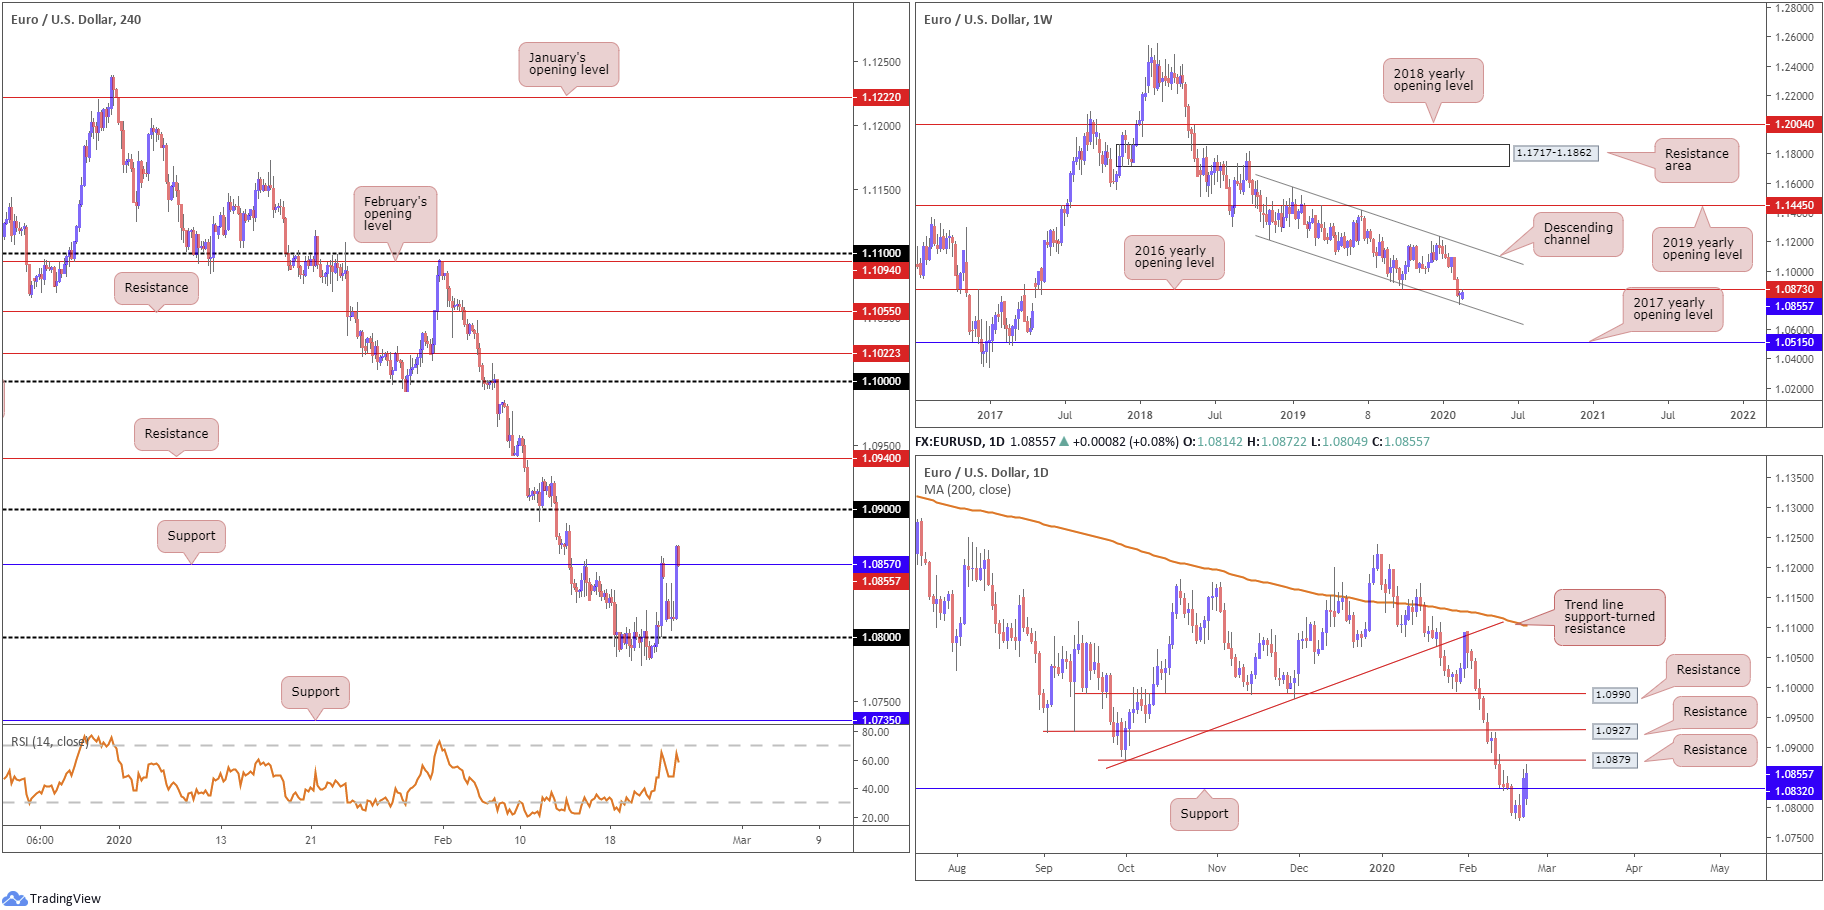
Europe’s shared currency kicked off the week lower against the buck, pencilling in a decisive opening gap. Early Europe witnessed a run to 1.0805, before spiking to highs of 1.0841 amid a modestly better-than-expected German IFO print. A sharp drop in US Treasury yields weighed on the greenback, sending the US dollar index to lows at 99.11 and providing impetus to the EUR/USD.
H4 resistance at 1.0857 was recently taken, with the candles poised to retest the level as support. The 1.09 handle rests as the next upside target on the H4 scale followed by resistance at 1.0940.
Further afield, weekly price is testing resistance at 1.0873, formed by way of the 2016 yearly opening level. This follows last week’s rejection off channel support, taken from the low 1.1109, shaped in the form of a bullish hammer candlestick pattern. A move above 1.0873 could eventually see an approach towards channel resistance, extended from the high 1.1569.
The response from the weekly channel support has so far generated enthusiastic upside, reclaiming daily resistance at 1.0832 (now a serving support) and exposing daily resistance at 1.0879, the October 1st low, with a break highlighting resistance at 1.0927 and then around 1.0990.
Areas of consideration:
Well done to any readers long north of 1.08; this was a noted setup to watch for last week. Reducing risk to breakeven and banking partial profits right now should be a priority, given the test at weekly resistance from 1.0873. Daily resistance at 1.0879 is next on tap followed by the 1.09 handle on the H4.
Should we hold north of 1.0857 today, this is likely to be interpreted as an early cue we’re heading towards daily resistance mentioned above at 1.0879, the second take-profit target for longs.
GBP/USD:
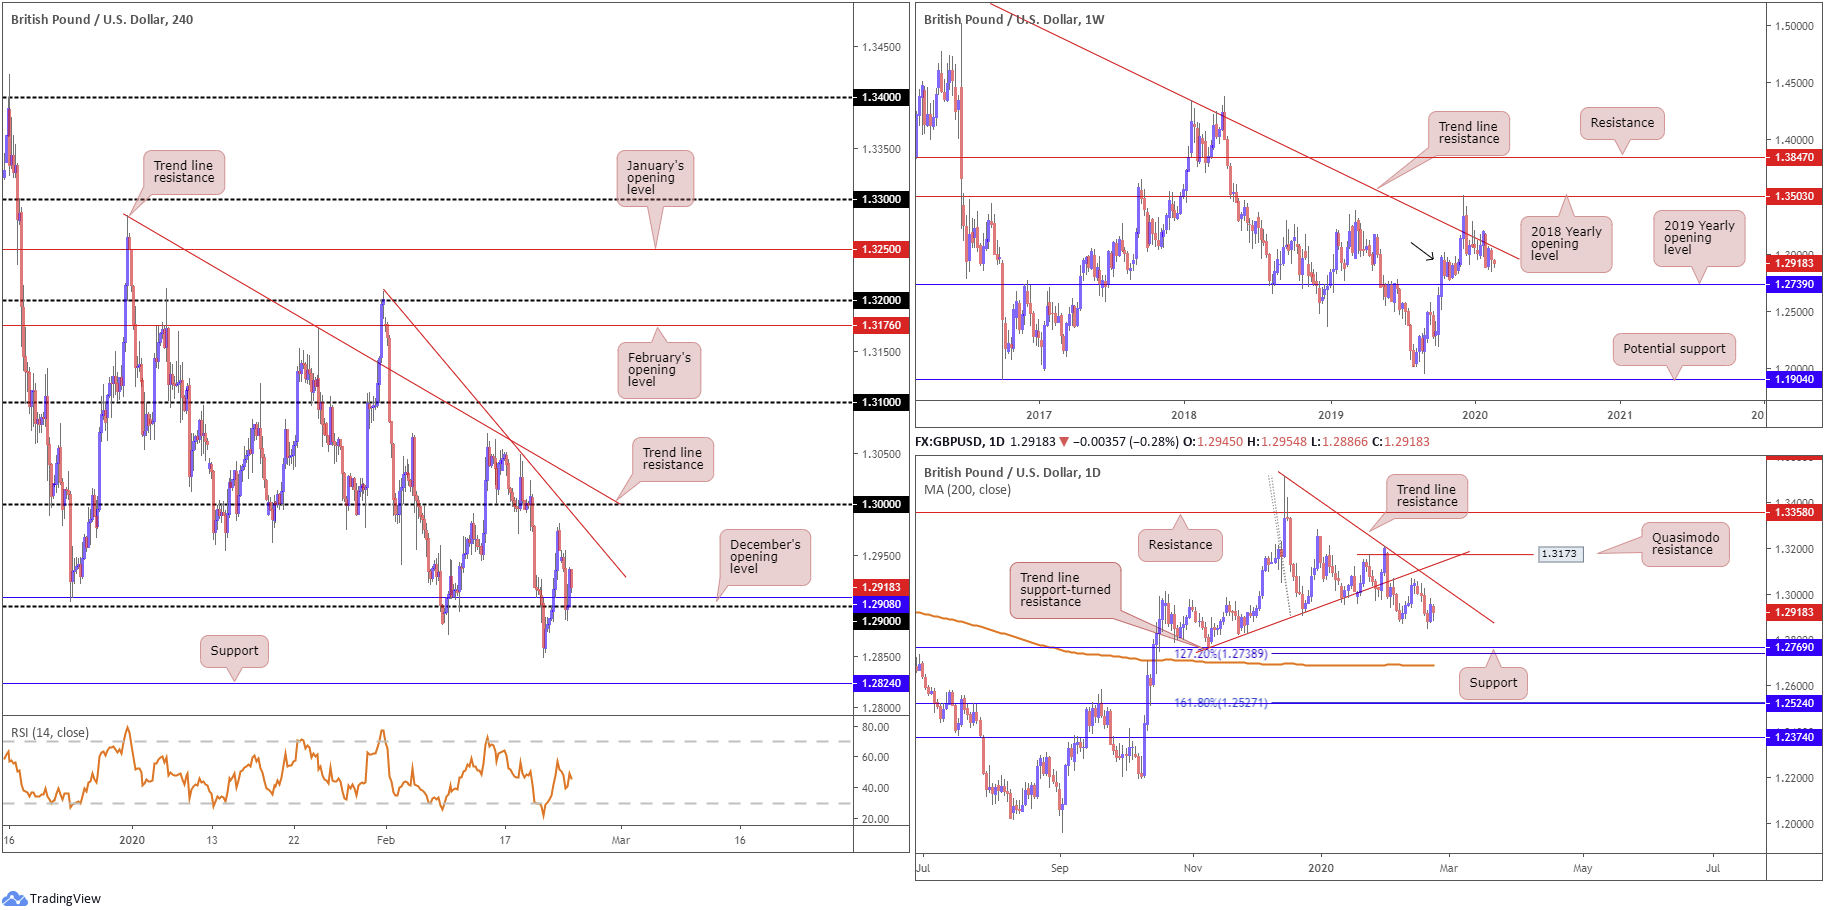
Sterling failed to take advantage of Friday’s upbeat tone on Monday, spinning lower and retesting December’s opening level at 1.2908 and the 1.29 handle on the H4 timeframe. A modest rebound emerged, though failed to sustain gains past 1.2937. South of 1.29, traders’ crosshairs are likely pinned on the 1.2849 February 20th low, followed by support priced in at 1.2824. To the upside, we have trend line resistance, taken from the high at 1.3209, the key figure 1.30 and another trend line resistance lurking above 1.30, extended from the high 1.3284.
Weekly price is seen languishing beneath long-standing trend line resistance, pencilled in from the high 1.5930, though demand around the 1.2939 region is also still in motion (black arrow). Continued downside may imply a break of the said demand, tripping sell stops and testing the 2019 yearly opening level at 1.2739. A break higher, on the other hand, could see the 2018 yearly opening level enter the fight at 1.3503.
From the daily timeframe, we can see that after engulfing the 1.2872 10th February low Thursday, price action staged a stronger-than-expected recovery Friday and shuffled the candles to within striking distance of trend line resistance, taken from the high 1.3514. A rotation to the downside from here, nevertheless, has support fixed at 1.2769, a 127.2% Fibonacci extension at 1.2738 and the 200-day SMA (1.2688). Note the said SMA has been flattening since mid-October 2019.
Areas of consideration:
According to our chart studies, 1.29 appears to be under threat. A H4 close south of here today could set the ball rolling for an approach to H4 support at 1.2824. Therefore, bearish scenarios beneath 1.29 are worthy of the watchlist.
The 1.30 region is another worthy contender in this market as resistance. However, traders are urged to pencil in the possibility of a fakeout above the round number into the upper H4 trend line resistance. Whipsaws through round numbers are common viewing so they should be expected to form.
AUD/USD:
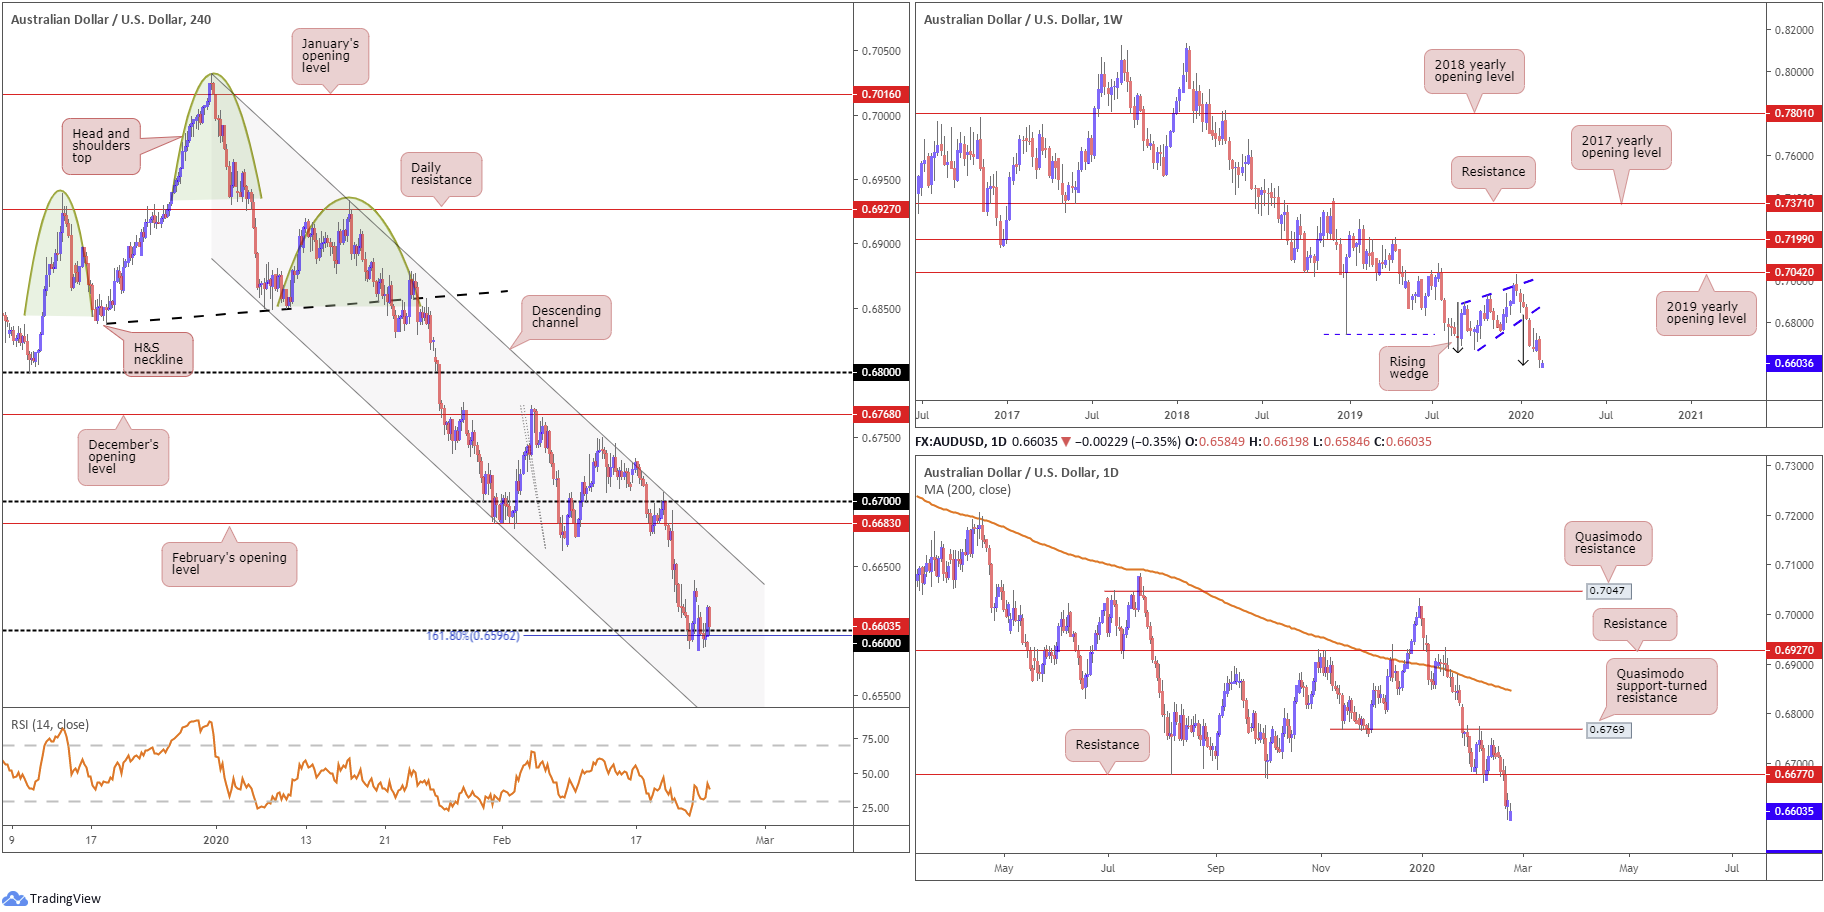
Opening the week with a bearish gap, AUD/USD dipped a toe in waters south of 0.66, likely tripping additional sell stops on the H4 timeframe. Reinforced by a 161.8% Fibonacci extension at 0.6596 and the relative strength index (RSI) elbowing its way out of oversold territory, the H4 candles half-heartedly continue to defend 0.66 as support. In the event 0.66 gives way, channel support, extended from the low 0.6850, may enter the fold, shadowed by the 0.65 handle.
On a wider perspective, longer-term movement on the weekly timeframe shook hands with a rising wedge take-profit target at 0.6599 (black arrows – calculated by taking the height of the base and adding it to the breakout point) in the later stages of last week, clocking multi-year lows. This pattern took five months to complete; well done to any readers who took part. With price nudging beyond this barrier yesterday, continued downside on this scale has support at 0.6359 (not visible on the screen) to target.
The key observation on the daily timeframe is the taking of support at 0.6677 last week, now a serving resistance level. The next support target beyond 0.6677 falls in around 0.6508 (not visible on the screen).
Areas of consideration:
Should 0.66 fall through today, which going by the current state of the H4 candles looks to be the case, breakout sellers likely have eyes for the H4 channel support (highlighted above), and the 0.65 handle, which happens to merge with the next daily support target mentioned above at 0.6508. As such, a decisive H4 close beneath 0.66 will likely entice selling. A retest at 0.66 as resistance offers confirmation, however, especially if the H4 candle closes by way of a bearish candlestick signal (entry and risk can be set according to its structure).
USD/JPY:
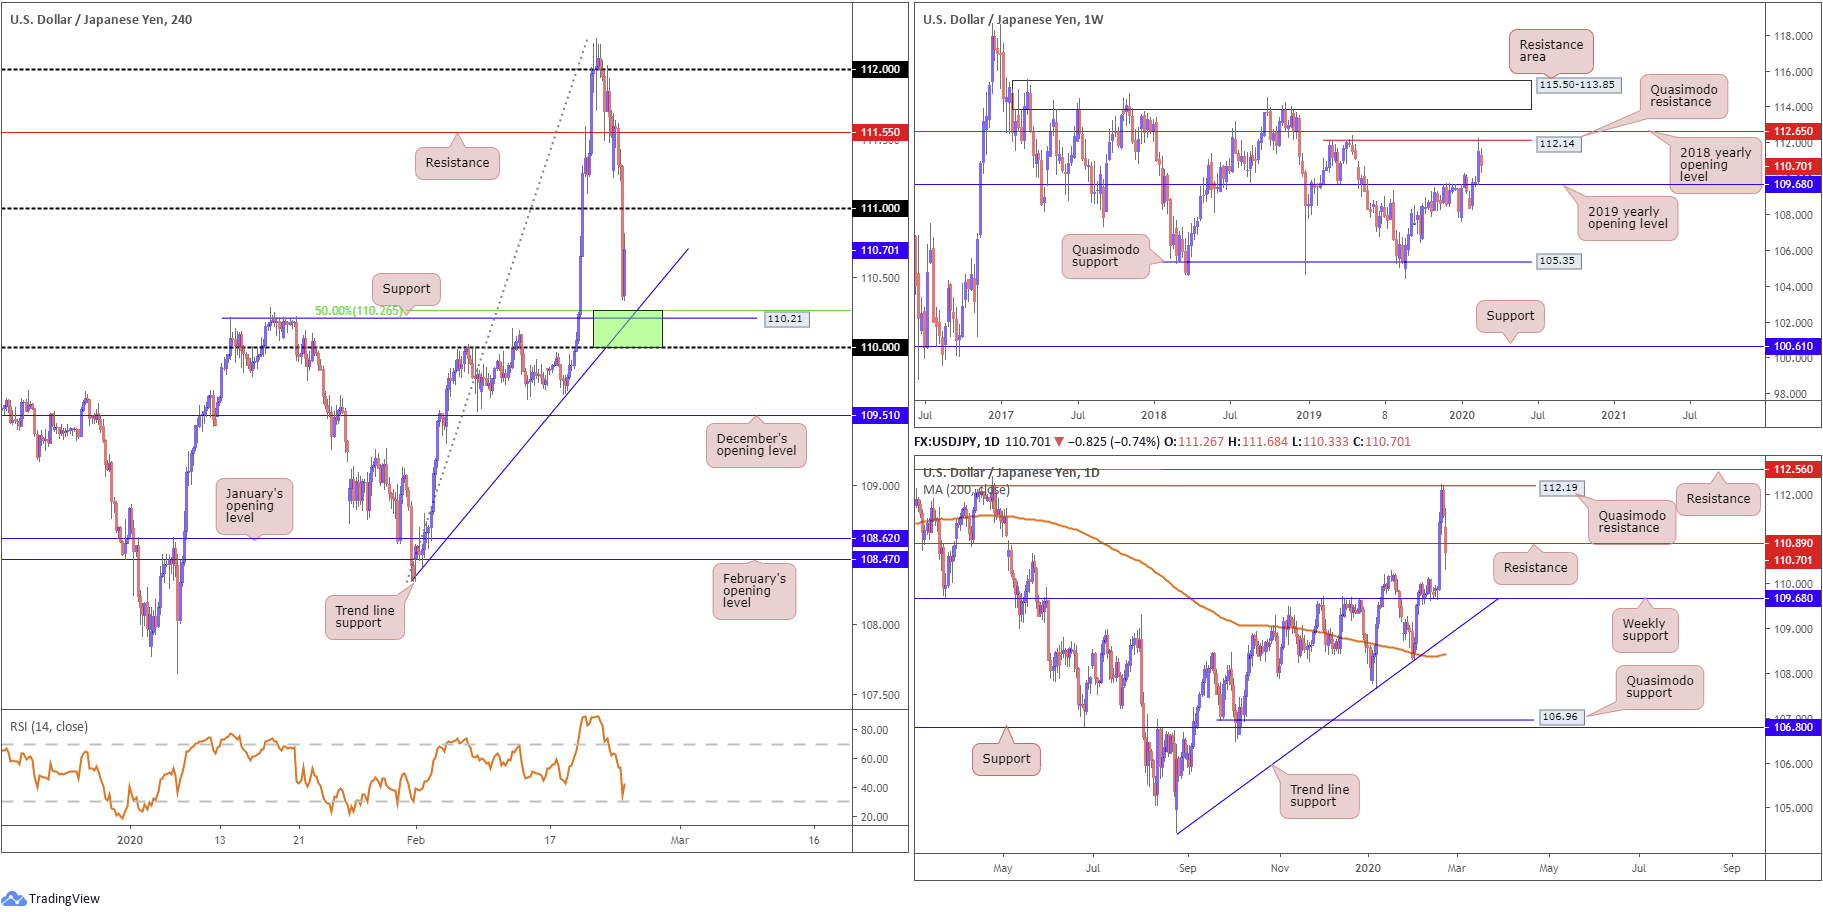
USD/JPY held onto the bulk of its daily losses Monday, establishing a firm footing south of the 111 handle on the H4 timeframe. The Japanese yen found increased demand on safe-haven flows amid heightened concerns surrounding the coronavirus, with a number of confirmed infections rising outside of China. Also weighing on the pair were US equities plunging lower across the board, and US Treasury yields taking a hit, pressuring the broad dollar index to lows just north of 99.00.
Technically, the H4 candles are seen bottoming just ahead of a support level coming in at 110.21, linked closely with a 50.0% retracement at 110.26 and a trend line support, extended from the low 108.31. Note the 110 handle also resides just beneath this plot of support while 111 represents feasible resistance. Indicator-based traders may also wish to note the relative strength index (RSI) is seen fast approaching oversold terrain.
The weekly timeframe shows the pair delivered a near-full-bodied bullish candle north of the 2019 yearly opening level at 109.68 last week, though encountered resistance from a Quasimodo formation at 112.14, sited just south of the 2018 yearly opening level at 112.65. Another area of interest on this scale can be seen at a resistance area drawn from 115.50-113.85.
In similar fashion to weekly structure, the daily timeframe had price fade Quasimodo resistance at 112.19 at the tail end of the week, located a few points beneath resistance at 112.56. Follow-through selling from this region was seen Monday, rupturing support at 110.89 and crossing swords with lows at 110.33. A decisive close beyond here has the 2019 yearly opening level mentioned above at 109.68 to target.
Areas of consideration:
Well done to any readers who took advantage of bearish themes beneath 112 on Friday; this was a noted move to be aware of.
The combination of the 111 handle on the H4 timeframe and daily support (now serving as potential resistance) could provide a ceiling today for possible bearish themes.
Support, however, falls in between the 110/110.26 (green zone on the H4 timeframe), comprised of the round number 110, H4 support at 110.21, the 50.0% retracement at 110.26 and H4 trend line support. Note that any fakeout seen through this area could be somewhat large, due to weekly support being stationed around 109.68, acting as a magnet to price.
USD/CAD:
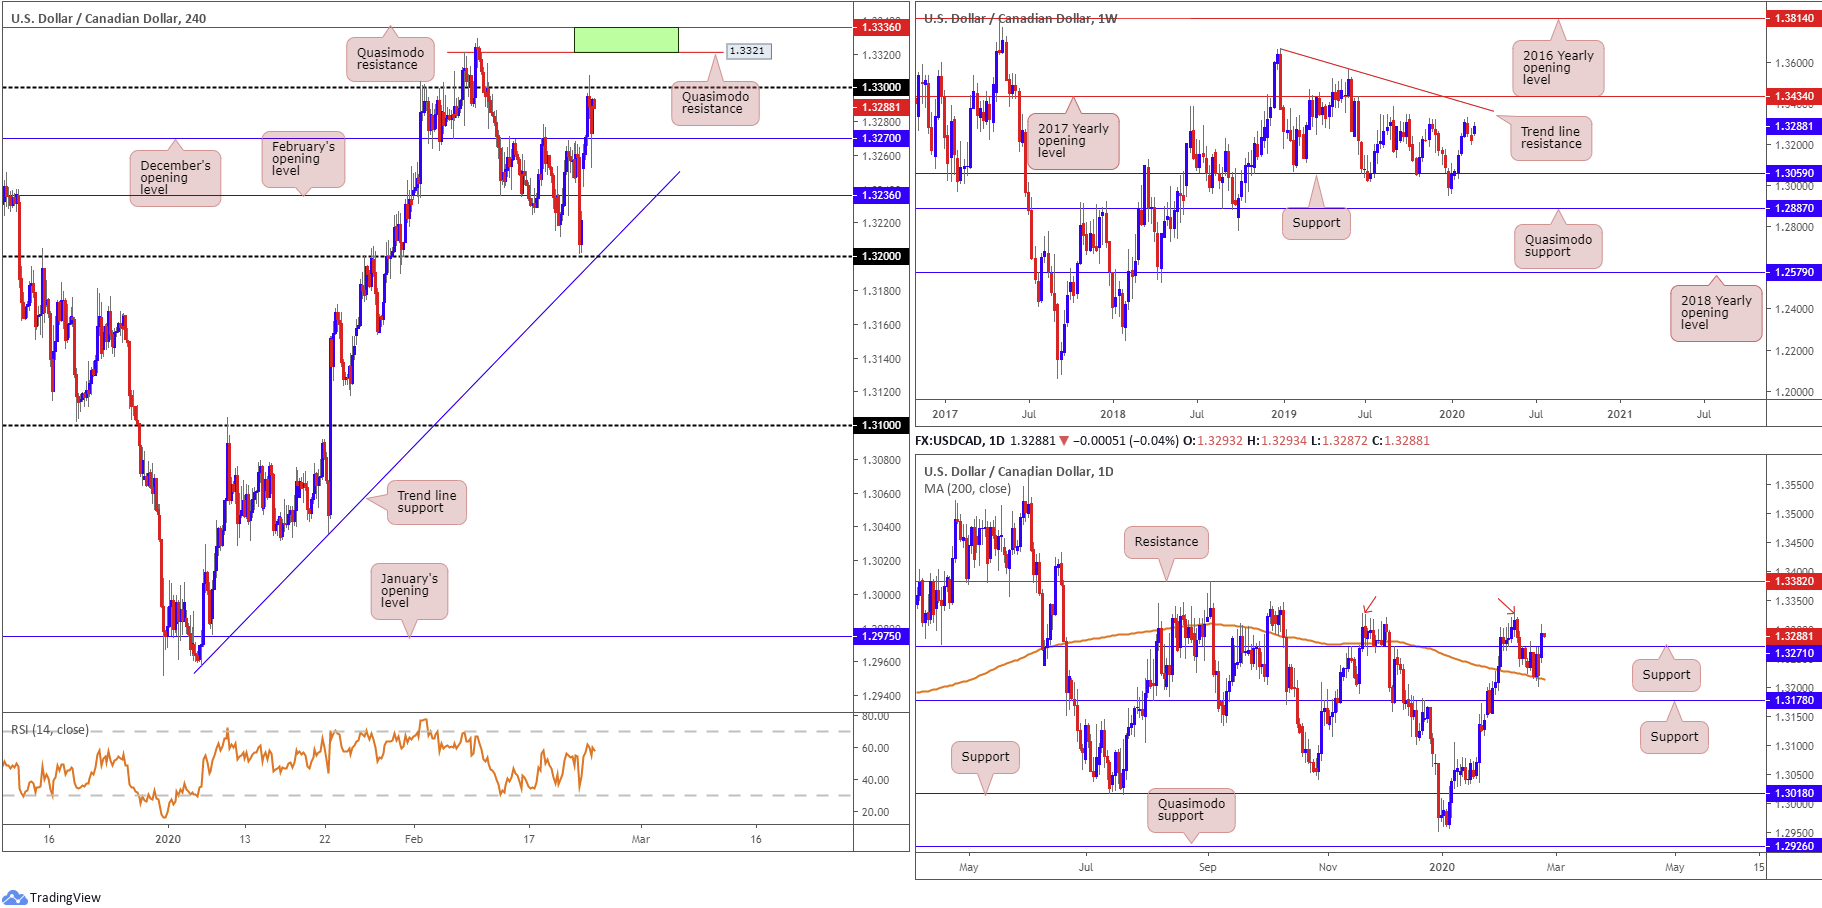
USD/CAD began the week on strong footing, gapping more than 30 points higher at the open. This led to a wave of continuation buying throughout early Europe towards the 1.33 handle, supported by a sharp fall in WTI prices undermining the Canadian dollar. The ongoing slump in US Treasury yields, though, seemed to cap any gains a touch north of 1.33.
Having shown some resilience off the 200-day SMA (orange – 1.3214) Friday, the pair dethroned daily resistance at 1.3271 on Monday. Tops around 1.3329 are now in view (red arrows) with a break drawing eyes to resistance pencilled in at 1.3382.
Meanwhile, on the weekly timeframe, resistance remains around tops at 1.3340. Additional resistance resides at a trend line formation (1.3661) and the 2017 yearly opening level at 1.3434. Support can be found around the 1.3059 neighbourhood.
Across the page on the H4 timeframe, 1.33 continues to offer the pair resistance, though simultaneously deriving support off December’s opening level at 1.3270. Quasimodo resistance at 1.3321 is another point of interest on this scale, as is Quasimodo resistance at 1.3336.
Areas of consideration:
The green zone marked on the H4 timeframe between two Quasimodo resistances at 1.3360/1.3321 offer a potential reversal zone today, in the event 1.33 gives way. Supporting a bounce from this region are the daily tops mentioned above at 1.3329 and buy-stop liquidity above 1.33. The stops taken above 1.33 will likely be enough to attract sellers out of 1.3336/1.3321 for at least an intraday move back to 1.33. Entry can be found off 1.3321, while traders have the option of either placing stops above 1.3336 or the apex of the upper Quasimodo formation at 1.3347. The latter is clearly the more conservative route, but offers limited risk/reward back to 1.33, which could hamper further downside.
USD/CHF:
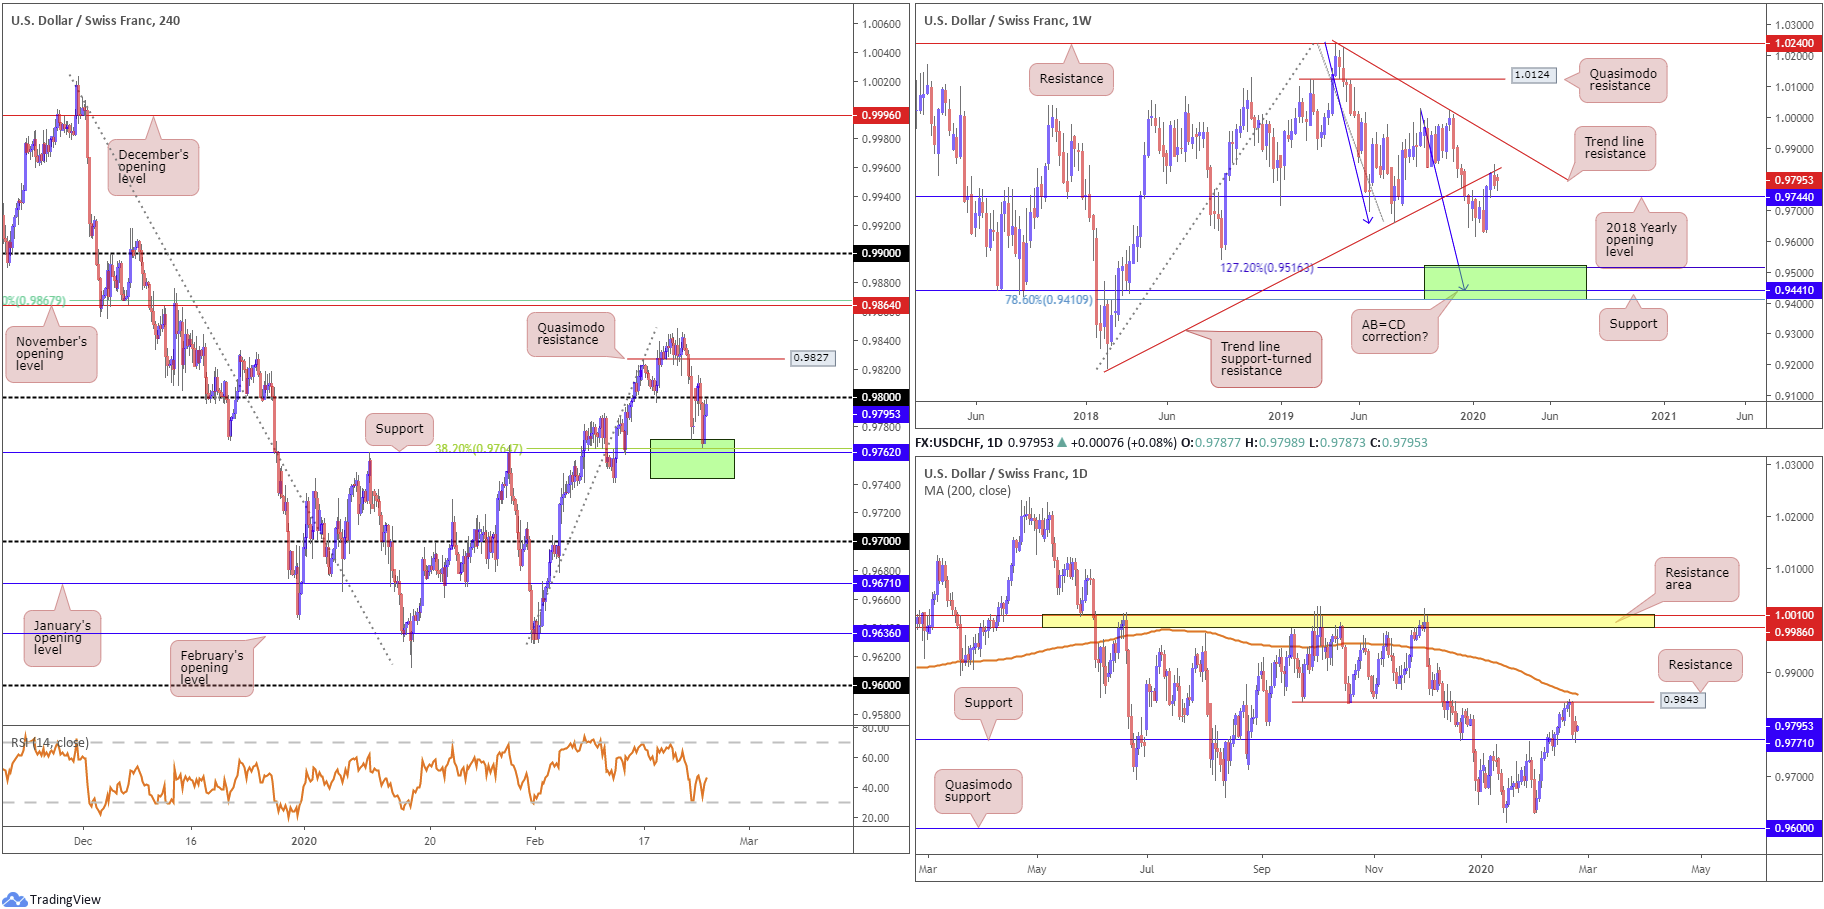
Looking at the weekly timeframe this morning, we can see the candles remain capped by trend line support-turned resistance, drawn from the low 0.9187. Trend line resistance, etched from the high 1.0236, is in sight, in the event we turn higher, while beyond support at 0.9744 (the 2018 yearly opening level), the 0.9613 January 13th low is seen, followed by 0.9410/0.9516 (green) – comprised of a 78.6% Fibonacci retracement at 0.9410, support at 0.9441 and a 127.2% AB=CD bullish correction (black arrows]) at 0.9516.
Following last week’s rejection off daily resistance at 0.9843, a support level placed just ahead of the 200-day SMA (orange – 0.9857) at 0.9771 currently holds price higher. A violation of the said level this week lands price within close proximity of the weekly support highlighted above at 0.9744.
Traders who read Monday’s technical piece may recall the following:
The green area on the H4 timeframe, formed by weekly support at 0.9744 and daily support at 0.9771, is a zone buyers could occupy this week. Additional support is seen around 0.9762 on the H4 scale, as well as a 38.2% Fibonacci retracement at 0.9764.
As you can see, 0.9744/0.9771 held price higher Monday, now testing the underside of 0.98. North of 0.98 we have Quasimodo resistance at 0.9827 to target, followed by November’s opening level at 0.9864 (and a 61.8% Fibonacci retracement at 0.9867).
Areas of consideration:
Traders long from the 0.9744/0.9771 H4 area likely have eyes above 0.98 today. A H4 close above 0.98 could represent a cue to reduce risk to breakeven, given the threat of selling on the weekly timeframe from trend line resistance.
H4 Quasimodo resistance at 0.9827 is stationed as the next upside target above 0.98, followed by daily resistance at 0.9843.
Dow Jones Industrial Average:
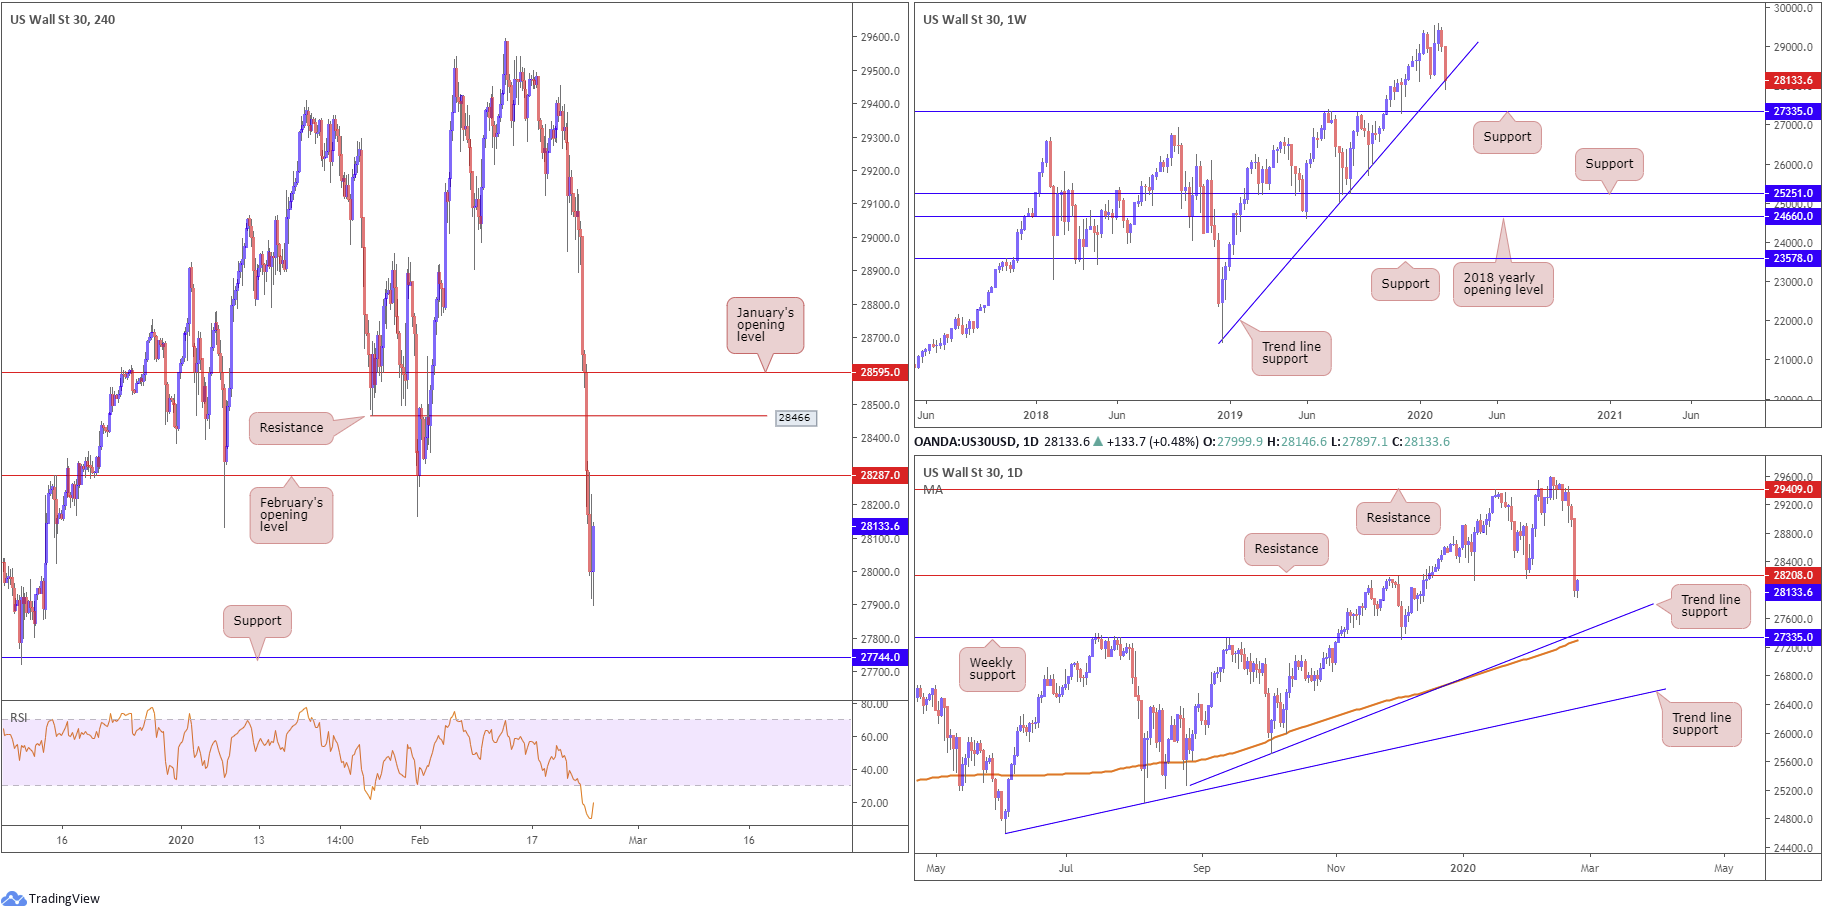
US stocks plunged lower Monday amid heightened concerns regarding the coronavirus epidemic, as new cases outside China dashed hopes the outbreak had been contained. The Dow Jones Industrial Average lost 1031.61 points, or 3.56%; the S&P 500 declined 111.85 points, or 3.35% and the tech-heavy Nasdaq 100 ended lower by 367.06 points, or 3.89%.
Technically, weekly price, thanks to recent selling, is seen testing long-term trend line support, taken from the low 21452. Outside of the aforementioned trend line, additional support rests at 27335.
Closer analysis of price on the daily timeframe reveals a break of support emerged Monday at 28208 (now a serving resistance), exposing trend line support, taken from 25264, and weekly support mentioned above at 27335.
The H4 timeframe, on the other hand, has resistance priced in at 28287, February’s opening level, and support coming in at 27744. Traders may also note the relative strength index (RSI) is seen modestly rebounding from deep within oversold territory, bottoming just north of the 10.00 value.
Areas of consideration:
The combination of February’s opening level at 28287 and daily resistance at 28208 offers a potential reversal zone to consider today. However, traders are urged to pencil in the possibility of a zone failure here, based on weekly price defending trend line support.
XAU/USD (GOLD):
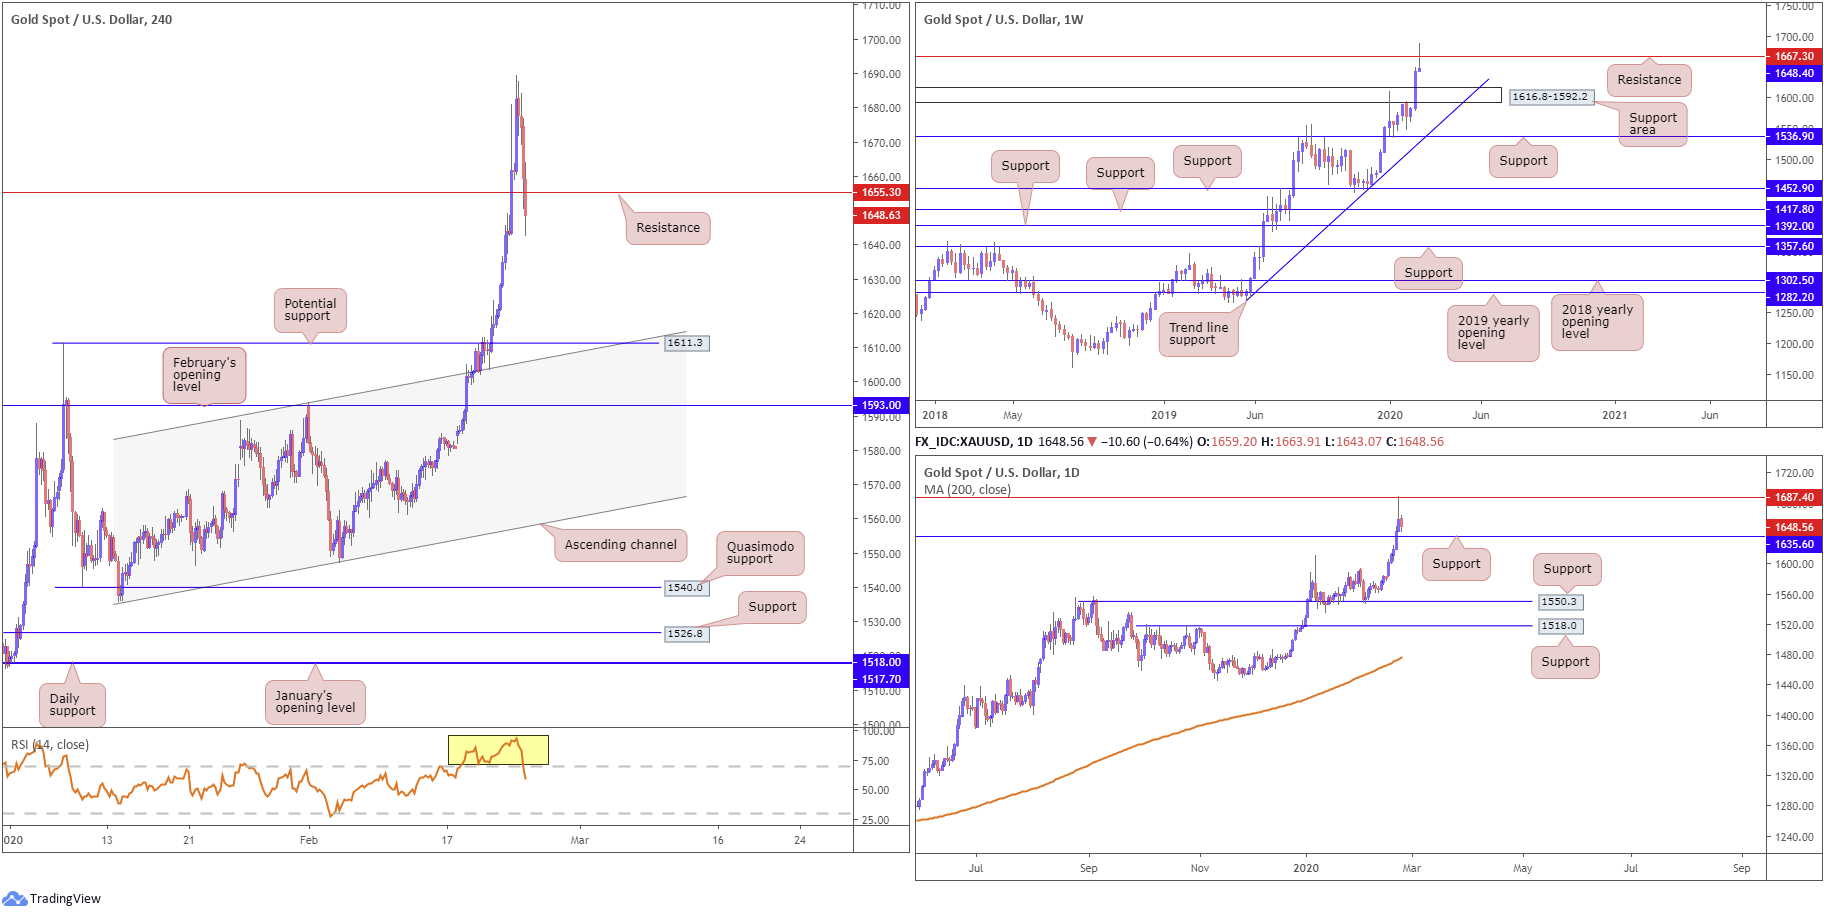
The clear risk-averse environment allowed bullion to continue to find demand as a safe-haven Monday. Gold reached highs at 1689.3, before pulling back and erasing more than 60% of its daily gains.
As of now, H4 price trades beneath support at 1655.3, now a serving resistance, with the market now potentially eyeing an approach to support at 1611.3, which happens to merge with channel resistance-turned support, taken from the high 1593.9. Indicator-based traders may also wish to acknowledge the relative strength index (RSI) is seen exiting overbought territory.
Higher-timeframe action has weekly price fading resistance at 1667.3, formed in the shape of a shooting star candlestick pattern. Continued selling from here could draw in a support area at 1616.8-1592.2. On the daily timeframe, resistance entered the fold at 1687.4, with support expected to develop off 1635.6.
Areas of consideration:
Daily support at 1635.6 could hold price action higher today. However, the top edge of the weekly support area is also of interest at 1616.8, given it converges closely with H4 support at 1611.3.
Whether additional confirmation, such as candlestick patterns, is needed before pulling the trigger off either of the aforementioned supports is, of course, trader dependent. Traders are, however, urged to recognise we do have weekly resistance in play at 1667.3.
The accuracy, completeness and timeliness of the information contained on this site cannot be guaranteed. IC Markets does not warranty, guarantee or make any representations, or assume any liability regarding financial results based on the use of the information in the site.
News, views, opinions, recommendations and other information obtained from sources outside of www.icmarkets.com.au, used in this site are believed to be reliable, but we cannot guarantee their accuracy or completeness. All such information is subject to change at any time without notice. IC Markets assumes no responsibility for the content of any linked site.
The fact that such links may exist does not indicate approval or endorsement of any material contained on any linked site. IC Markets is not liable for any harm caused by the transmission, through accessing the services or information on this site, of a computer virus, or other computer code or programming device that might be used to access, delete, damage, disable, disrupt or otherwise impede in any manner, the operation of the site or of any user’s software, hardware, data or property.


