
Key risk events today:
Eurozone, UK and US Manufacturing and Services PMIs; Richmond Manufacturing Index.
(Previous analysis as well as outside sources – italics).
EUR/USD:
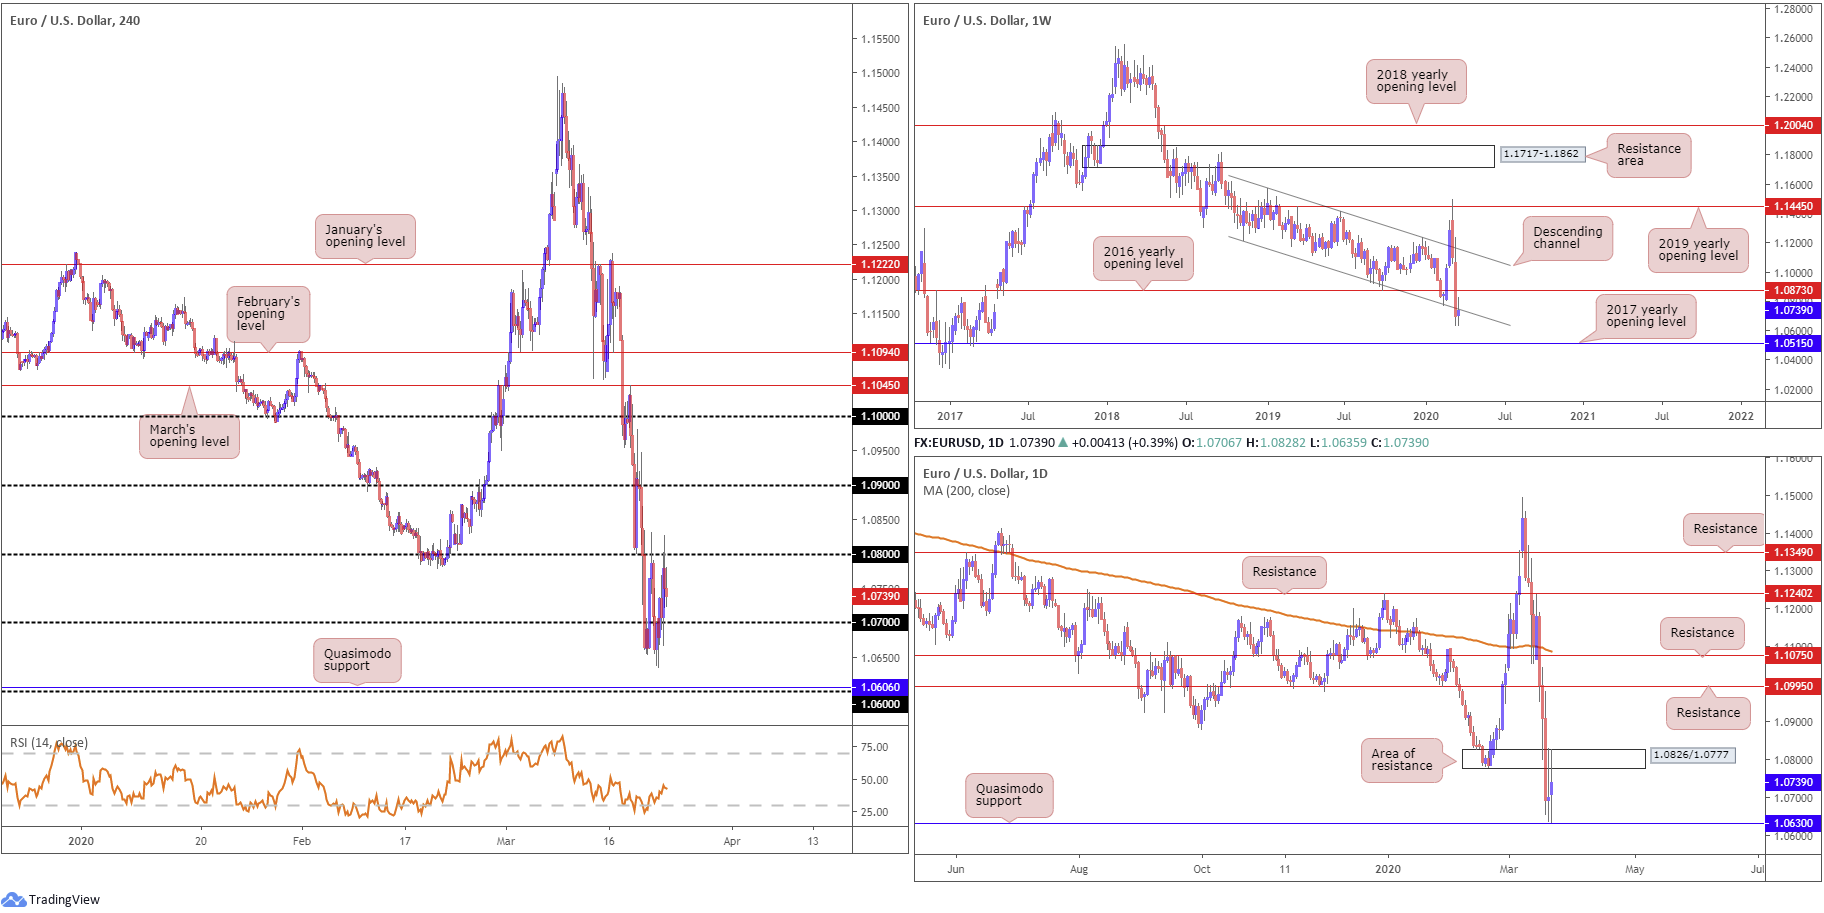
EUR/USD traded within a near-200-point range Monday between 1.0828/1.0635, as worldwide governments and central banks attempt to control the spread of COVID-19 and a global recession.
In recent news, the US Federal Reserve rolled out an extraordinary array of programs to backstop an economy reeling from sweeping restrictions on people and businesses that scientists say are needed to limit the spread of the coronavirus. For the first time the Fed will back purchases of corporate bonds and make direct loans to companies, and will roll out a program to get credit to small and medium-sized business. It also said it will expand its asset purchases by as much as needed to stabilize financial markets (REUTERS).
Downside risks continue to build long term in EUR/USD, absorbing bids from the 2016 yearly opening level at 1.0873 and channel support, taken from the low 1.1215 on the weekly timeframe. Further downside this week has the 2017 yearly opening level in view at 1.0515, with price action currently retesting the underside of the recently broken channel support.
A closer reading of price movement on the daily timeframe shows EUR/USD consolidating between Quasimodo support at 1.0630 and an area of resistance drawn from 1.0826/1.0777. The key observation here is a break of the aforementioned Quasimodo formation may prep the ground for an approach towards the 2017 yearly opening level mentioned above on the weekly timeframe at 1.0515.
Across the page on the H4 timeframe we have the candles fading the underside of 1.08. Quasimodo support at 1.0606 and the 1.06 handle are in view south of 1.07, while the relative strength index (RSI) is seen modestly gaining ground out of oversold terrain.
Areas of consideration:
A close south of daily Quasimodo support at 1.0630 this week is tipped to provide an unfavourable wind for EUR/USD towards weekly support at 1.0515, the 2017 yearly opening level.
Given the room to move lower on the weekly timeframe, bearish themes off 1.08 and sub 1.07 are likely eyed today/this week. Conservative traders will likely want to view a retest at the underside of the round number 1.07 before committing.
GBP/USD:
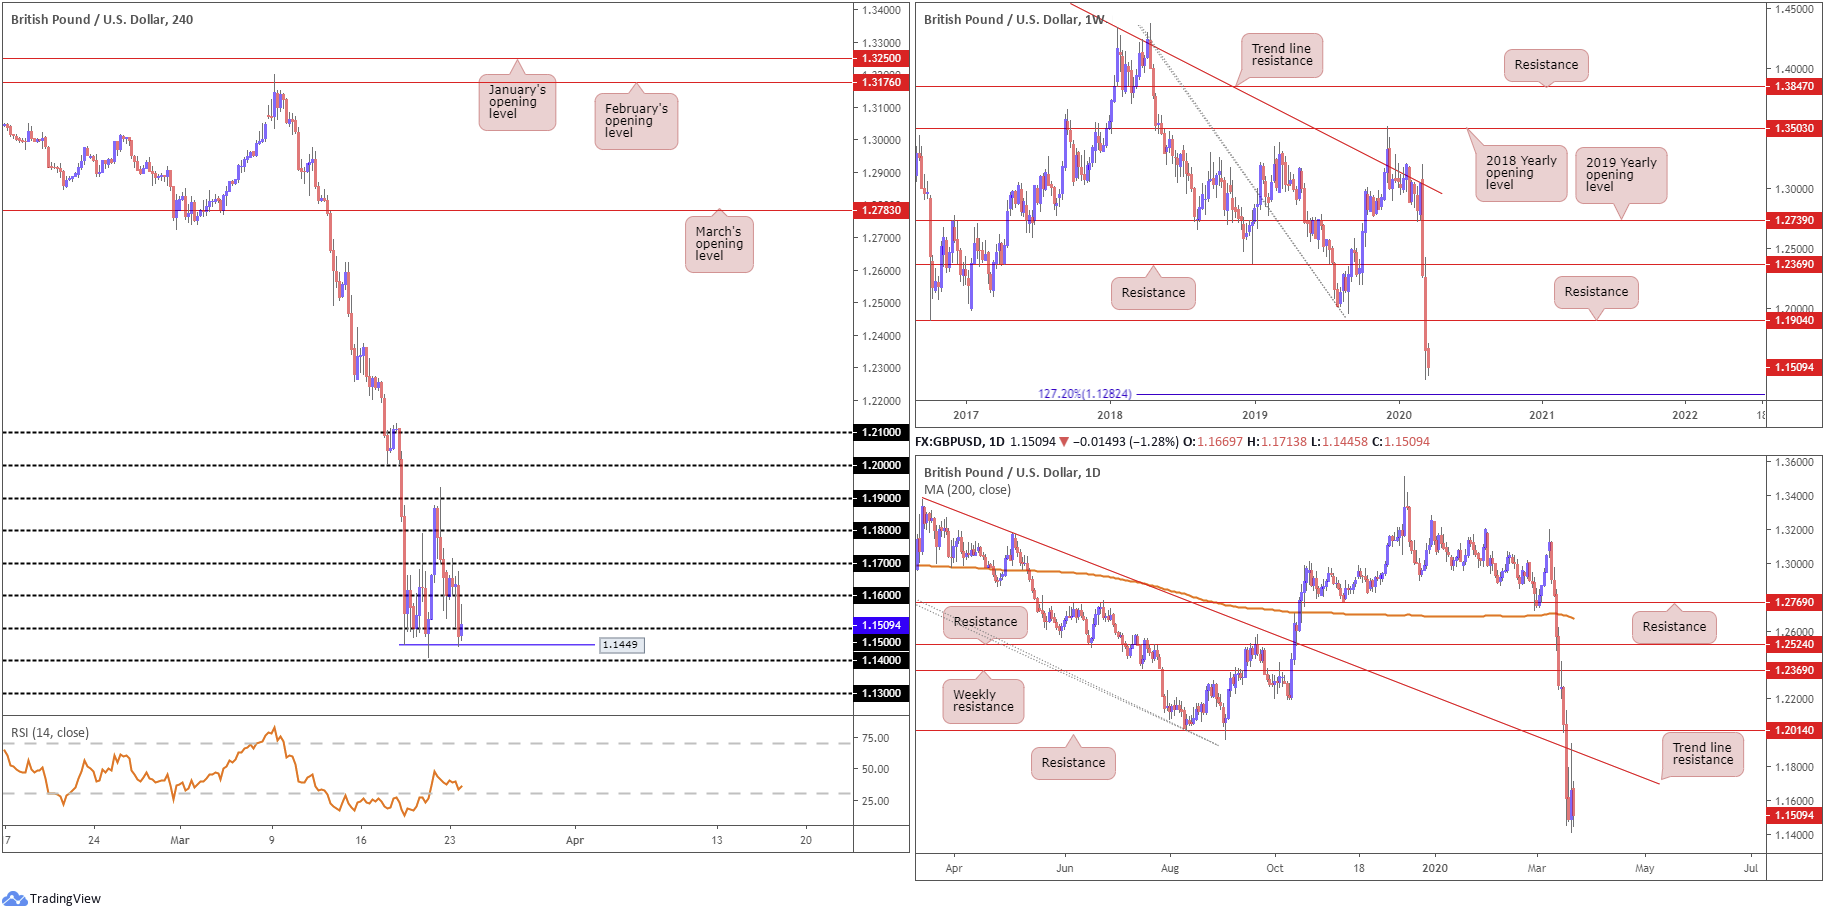
Sterling found broad support mid-way through London’s session Monday as the US Federal Reserve attempted to provide additional liquidity, in response to the COVID-19 crisis. Sending the US dollar index temporarily lower, GBP/USD gleaned fresh impetus and overthrew the 1.16 handle. Price, however, failed to sustain gains north of the round number, steamrolling lower in US trading hours which observed the unit whipsaw through 1.15 and test Quasimodo support at 1.1449. Note H4 price action is governed largely by round numbers at the moment.
Further afield on the weekly timeframe, we can see the market remains trading around the prior week’s lows at 1.1409, levels not seen since the 1980s. Long-term flow eyes the 127.2% Fibonacci extension at 1.1282 as a possible target.
The daily timeframe houses similar support at 1.1282, the weekly 127.2% Fibonacci extension. Daily structure reveals resistance emerging off a trend line formation, taken from the high 1.3380. It should also be noted the 200-day SMA value at 1.2679 is turning lower after trading flat since November 2019.
Areas of consideration:
Until 1.13, or the weekly 127.2% Fibonacci extension at 1.1282, this remains a sellers’ market, according to chart studies.
H4 closing under 1.15, despite the current H4 Quasimodo support at 1.1449, could spark further selling in this market, targeting moves beyond 1.14 to 1.13. Conservative traders may opt to wait and see if a retest at 1.15 materialises and holds before pulling the trigger. However, in order to secure a tight entry, traders may be forced to drill down into the lower timeframes and enter based off local structure.
AUD/USD:
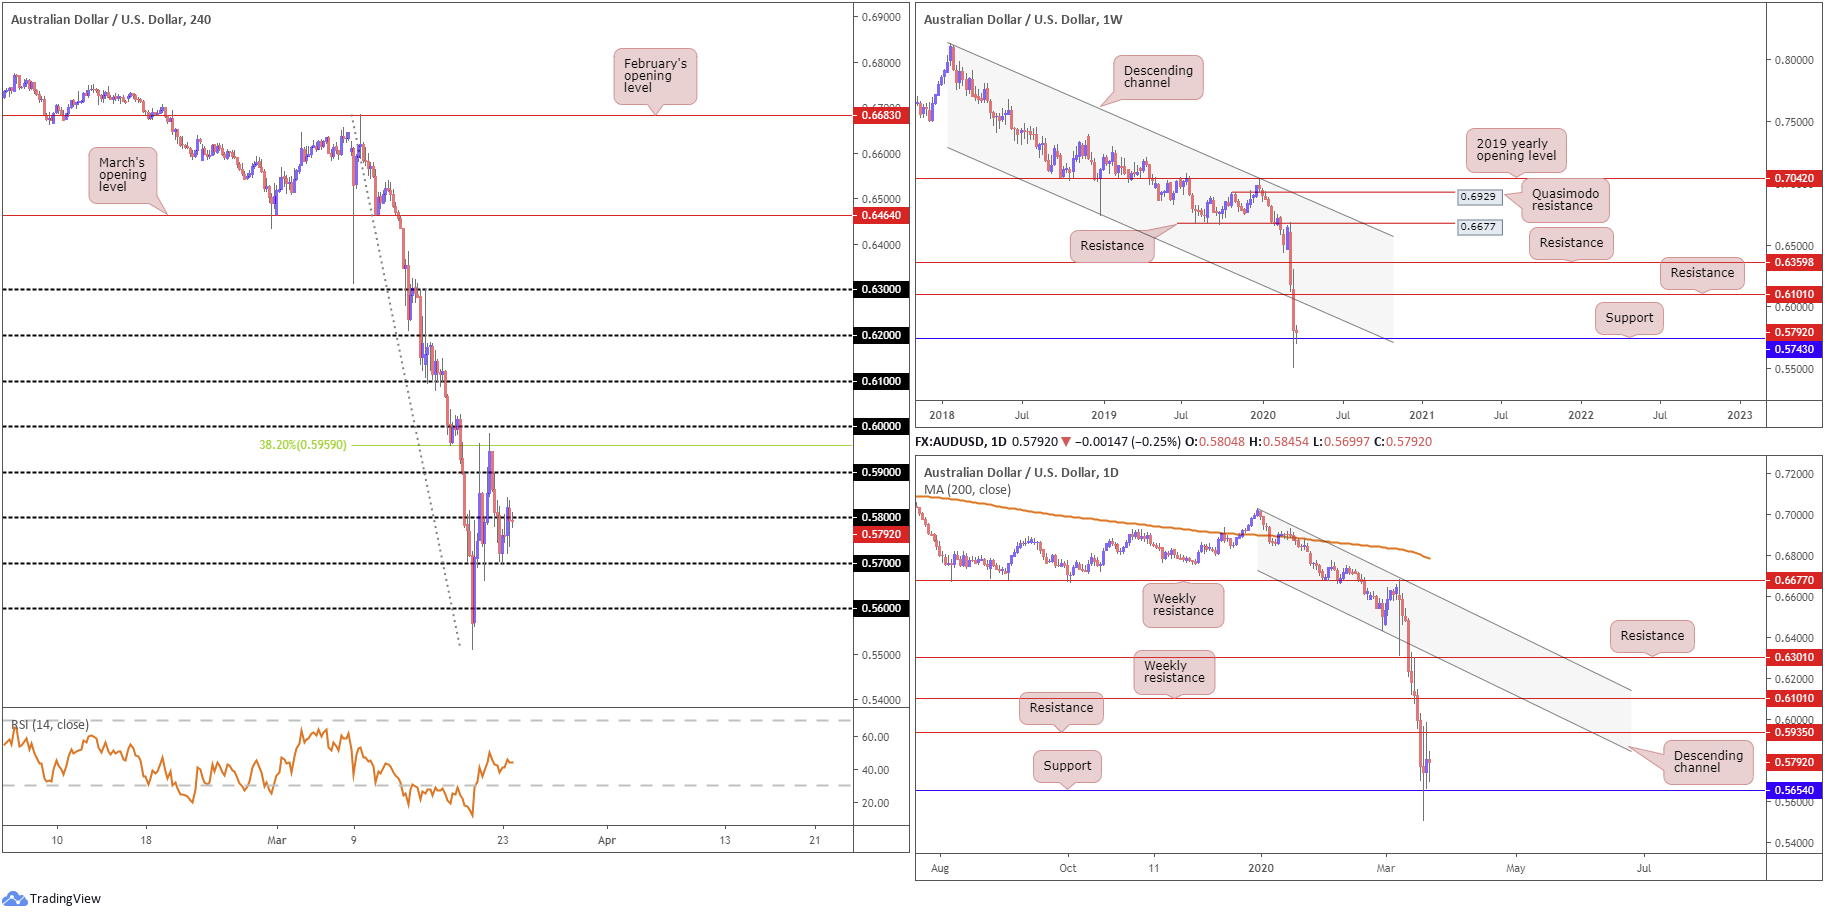
Bottoming 20 points ahead of the 0.57 handle, AUD/USD switched gears Monday and snapped back above 0.58 following the US Federal Reserve announcing an open-ended quantitative easing program, in retaliation to the COVID-19 pandemic sweeping across the globe.
The technical setting on the H4 timeframe has candle activity surfacing a touch south of the 0.58 handle, following last week’s recovery peak off the 38.2% Fibonacci retracement ratio at 0.5959. Downside support on this timeframe remains at 0.57, with a break exposing 0.56.
Persistent coronavirus headlines, coupled with muscular demand for the dollar last week, sparked a 370+ point down move in AUD/USD, a week after a near-7% decline. Modestly recovering from worst levels, a touch above 0.55, price managed to elbow its way marginally north of weekly support at 0.5743 which remained in the mix Monday. To the upside, focus shifts to channel support-turned resistance, taken from the low 0.6744, and resistance plotted at 0.6101.
Meanwhile, on the daily timeframe, price action shook hands with support coming in at 0.5654, with resistance standing at 0.5935. Candlestick traders will note Thursday’s activity chalked up a long-legged doji formation and Friday printed a half-hearted shooting star pattern. Monday’s action, however, remained within Friday’s range, almost unchanged on the session.
Areas of consideration:
Failure to hold above 0.58 is a sign buyers may be weak intraday. A H4 rejection candlestick signal formed from current price, therefore, will likely be viewed as a sell signal, targeting 0.57, and possibly daily support at 0.5654. Alternatively, a H4 close north of 0.58 (preferably followed up with a retest) today may entice further buying to 0.59, reinforced by weekly support mentioned above at 0.5743.
USD/JPY:
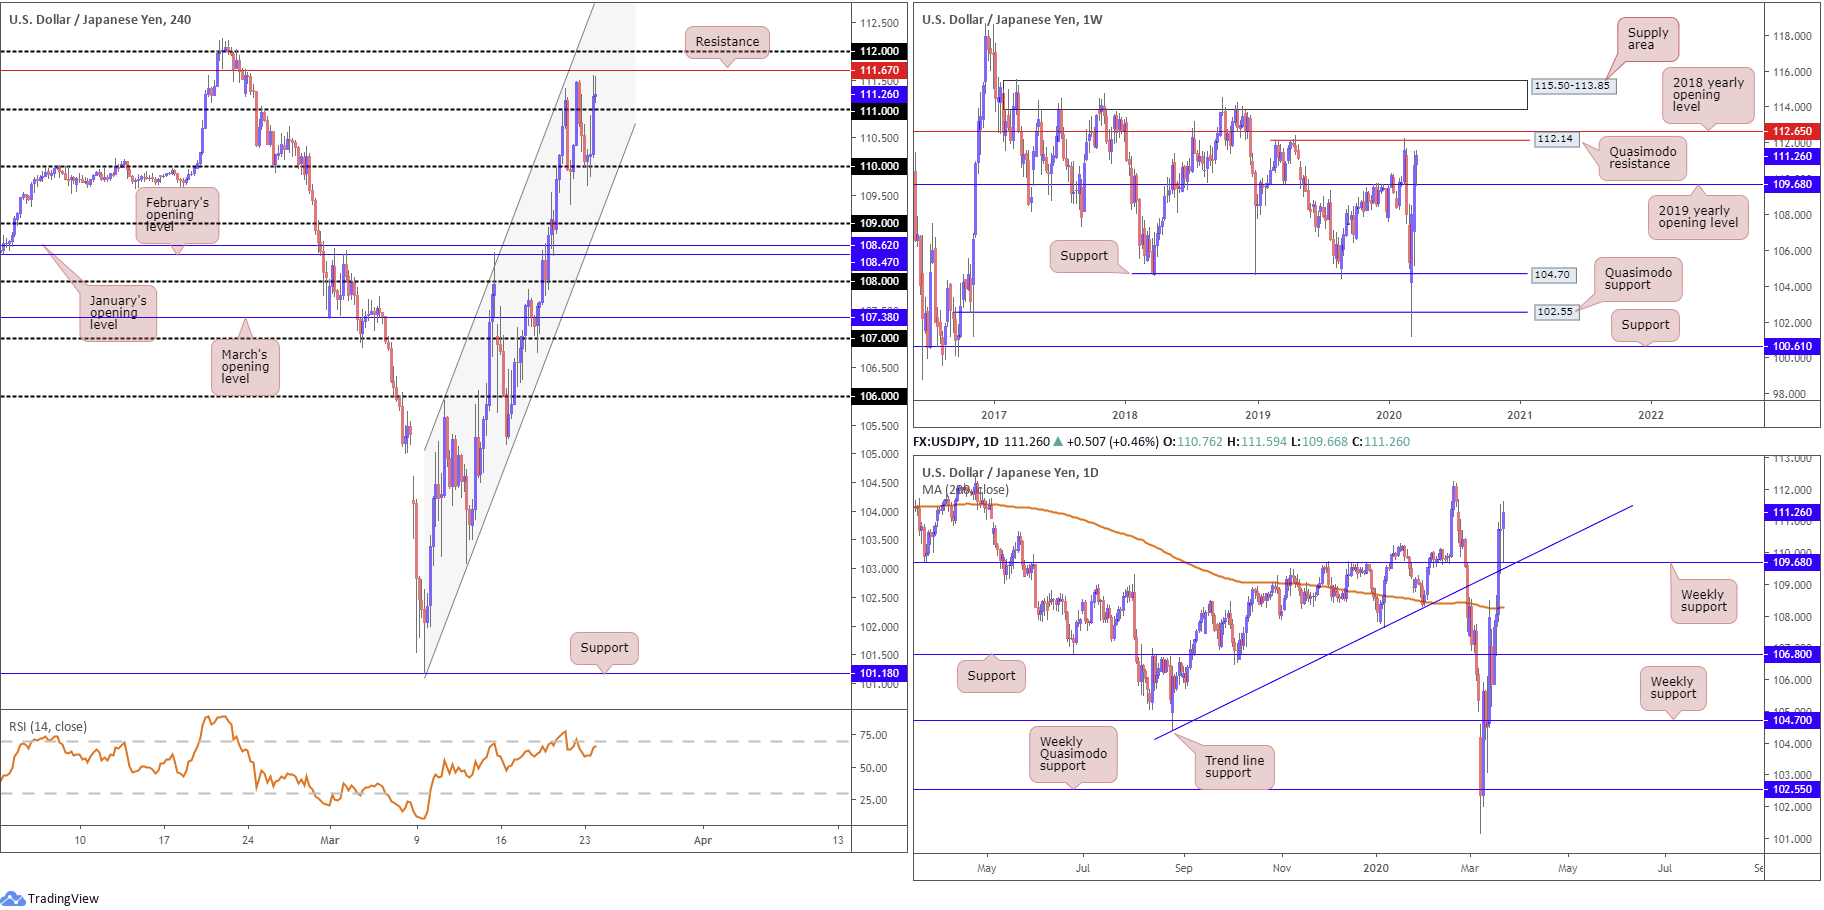
The US dollar continued to pressure higher against the Japanese yen Monday, consequently registering its fifth consecutive daily gain. Despite this, a knee-jerk reaction to the downside was observed mid-way through London after the US Federal Reserve announced additional liquidity, in response to the COVID-19 crisis. The move was short-lived, however, as USD/JPY gleaned support off the 110 handle, shortly after proceeding to knock on the 111 handle’s door and reach highs at 111.59. H4 resistance is seen close by at 111.67, closely shadowed by the 112 region. It is also worth noting the pair continues to compress within an ascending channel formation between 101.18/105.91. In addition, we can see the relative strength index (RSI) producing bearish divergence out of overbought waters.
On more of a broader perspective, the weekly timeframe has price action retesting the 2019 yearly opening level at 109.68, with the path paved for moves to Quasimodo resistance priced in at 112.14 and the 2018 yearly opening level at 112.65. Down a notch, daily movement also reveals limited resistance to the upside until reaching the noted weekly resistances.
Areas of consideration:
According to chart studies on the higher timeframes, we are perhaps heading for higher ground. As a result, a retest at 111 is a possibility today, which if it comes to pass and holds, an intraday rotation to H4 resistance at 111.67 could be in the offing, followed by 112 and ultimately 112.14, the weekly Quasimodo resistance. Failure to hold off 111, H4 channel support will likely be the next hurdle of interest for dip-buying opportunities.
Conservative traders will likely pursue additional confirmation, such as candlestick analysis or lower-timeframe structural confirmation, before engaging as round numbers are prone to whipsaws.
USD/CAD:
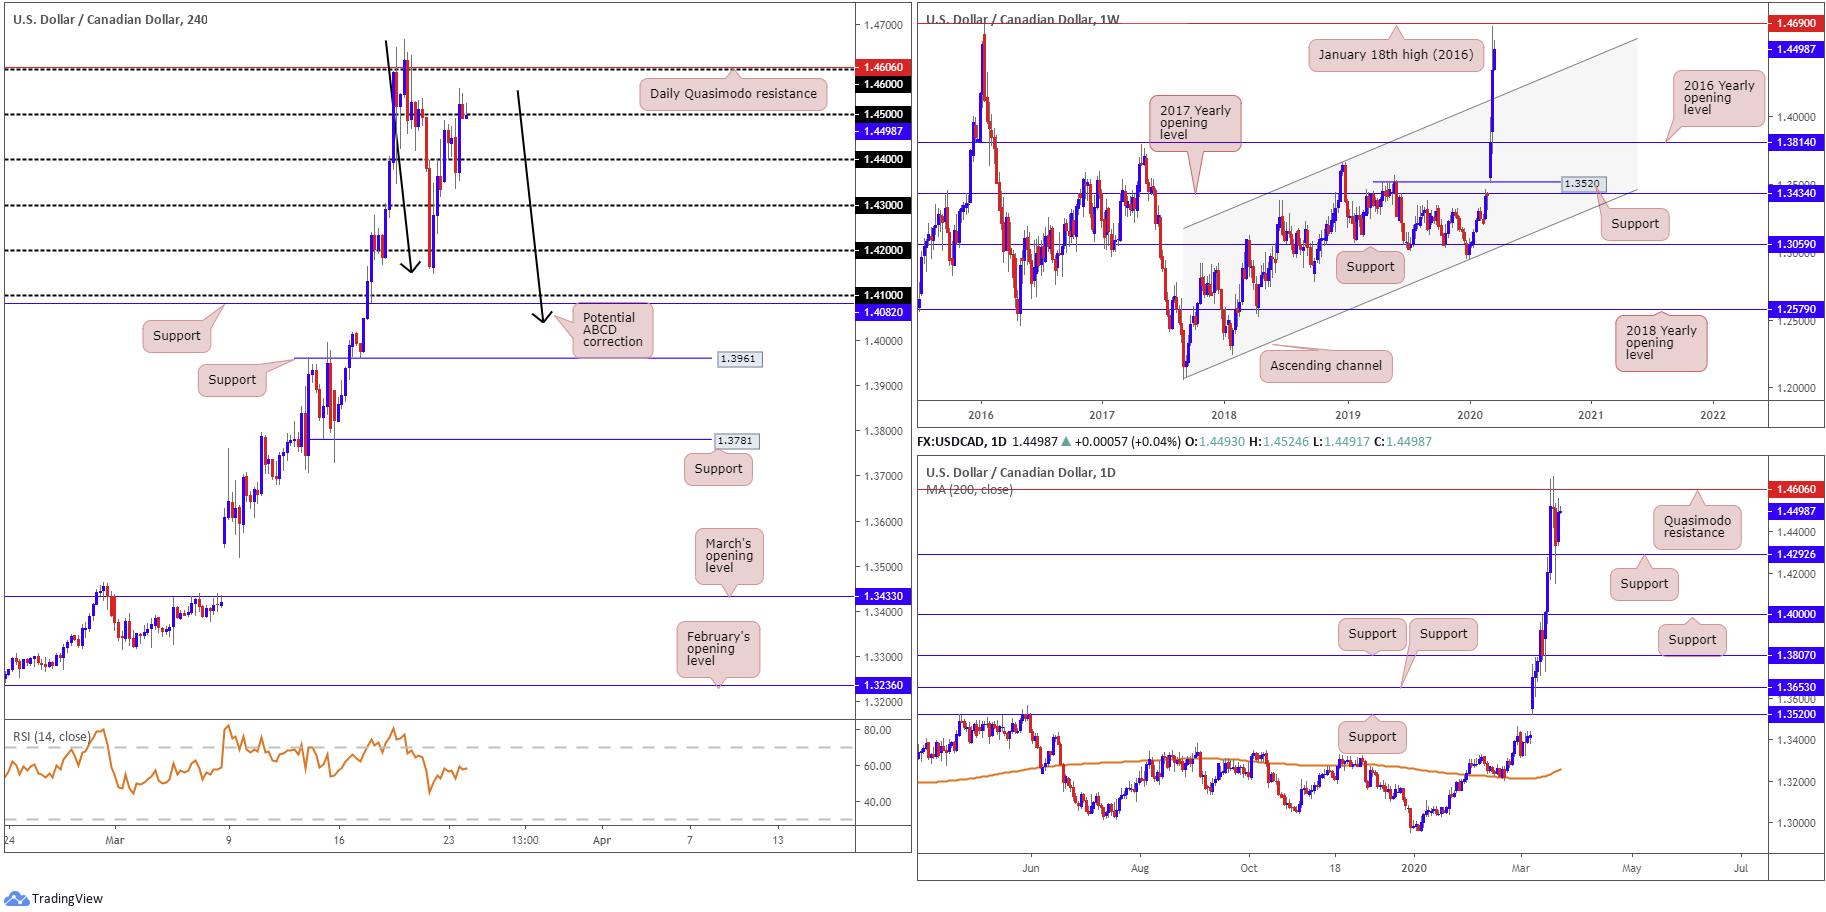
The after-effects of the US Federal Reserve announcing additional liquidity, in attempt to tackle the effects of the COVID-19 crisis, guided USD/CAD lower Monday. The move swamped orders at 1.44, albeit swiftly recovering and attacking the 1.45 handle into the close, potentially exposing 1.46 and daily Quasimodo resistance plotted at 1.4606. With respect to support on the daily scale, we have 1.4292 in view.
Vigorous USD buying amidst a scramble for liquidity and WTI prices falling nearly 30% last week had USD/CAD finish 530 points in the green. Weekly price reached highs of 1.4667, a touch short of the January 18th high at 1.4690 (2016), before pulling back to 1.4336. This came after retesting the 2016 yearly opening level at 1.3814, and breaching long-term channel resistance, etched from the high 1.3661.
Areas of consideration:
1.41 on the H4 timeframe is a level to keep an eye on this week as possible support; not only does the base align with H4 support coming in at 1.4082 and a potential H4 ABCD correction (black arrows), it intersects closely with weekly channel resistance-turned support from 1.3661.
Alternatively, another appealing area of support this week resides close by around 1.43, packaged with daily support at 1.4292.
Both 1.41 and 1.43 are positioned in line with the underlying primary trend, trading north since September 2017 (weekly timeframe).
The daily Quasimodo resistance at 1.4606, although aligning with 1.46, may give way, as weekly price displays scope to approach 1.4690. Therefore, bullish themes north of this vicinity is potentially in the offing.
USD/CHF:
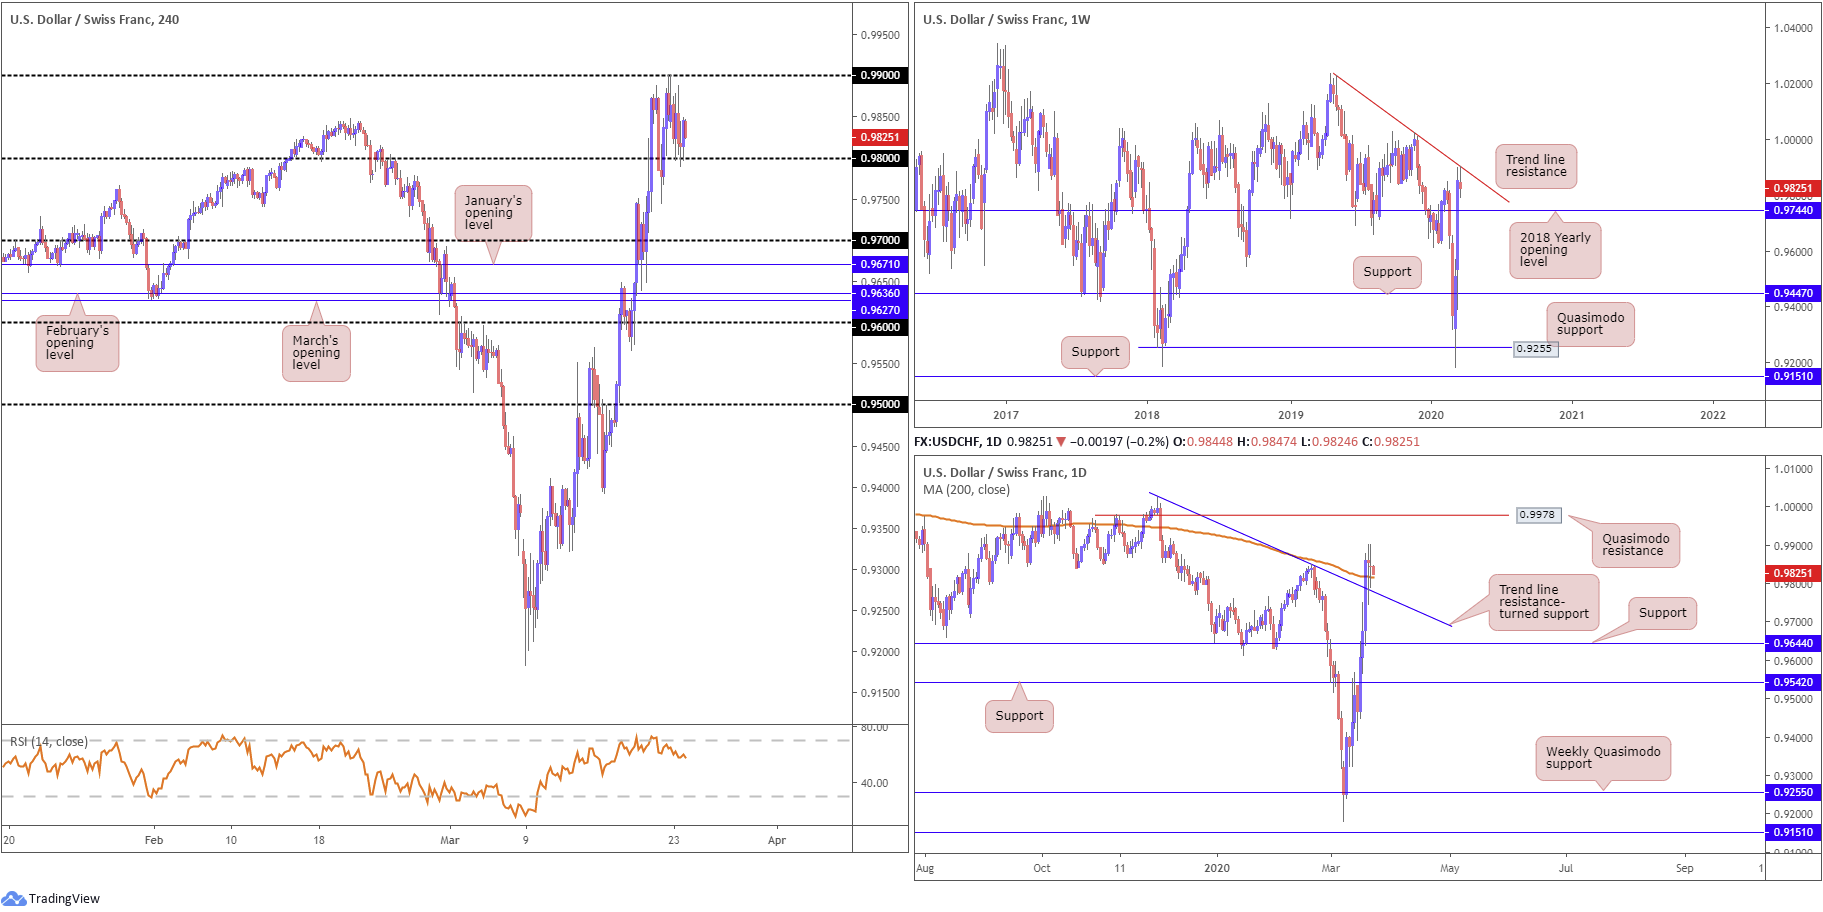
Although ranging between 0.9901/0.9789, USD/CHF wrapped up Monday unmoved, forming a clear-cut daily indecision candle. While the H4 relative strength index (RSI) is seen producing modestly bearish divergence out of overbought levels, H4 price action is seen attempting to remain afloat above 0.98. A breach of this level has the 0.97 handle to target, closely followed by January’s opening level at 0.9671.
Extending the V-shape recovery off multi-year lows at 0.9182, the pair retained its underlying bid last week and added 340 points. Weekly price nestled above the 2018 yearly opening level at 0.9744, surpassed the 0.9848 February 20th high and, in recent trade, tested trend line resistance, taken from the high 1.0226.
Elsewhere, daily price worked its way through trend line resistance, extended from the high 1.0023, and the 200-day SMA (orange – 0.9817). As you can see on this timeframe, we are currently testing the 200-day SMA as support, formed in the shape of a doji candlestick pattern. The next resistance target on this timeframe can be seen at Quasimodo resistance from 0.9978.
Areas of consideration:
In light of weekly price testing a trend line resistance, and daily flow indicating an indecisive tone off the 200-day SMA, moves through 0.98 may be something to keep an eye out for today on the H4 timeframe. A decisive H4 close beneath 0.98 (preferably followed up with a retest) will likely be interpreted as a bearish signal to 0.97. However, some traders may incorporate the daily trend line resistance-turned support as another possible downside target.
Dow Jones Industrial Average:
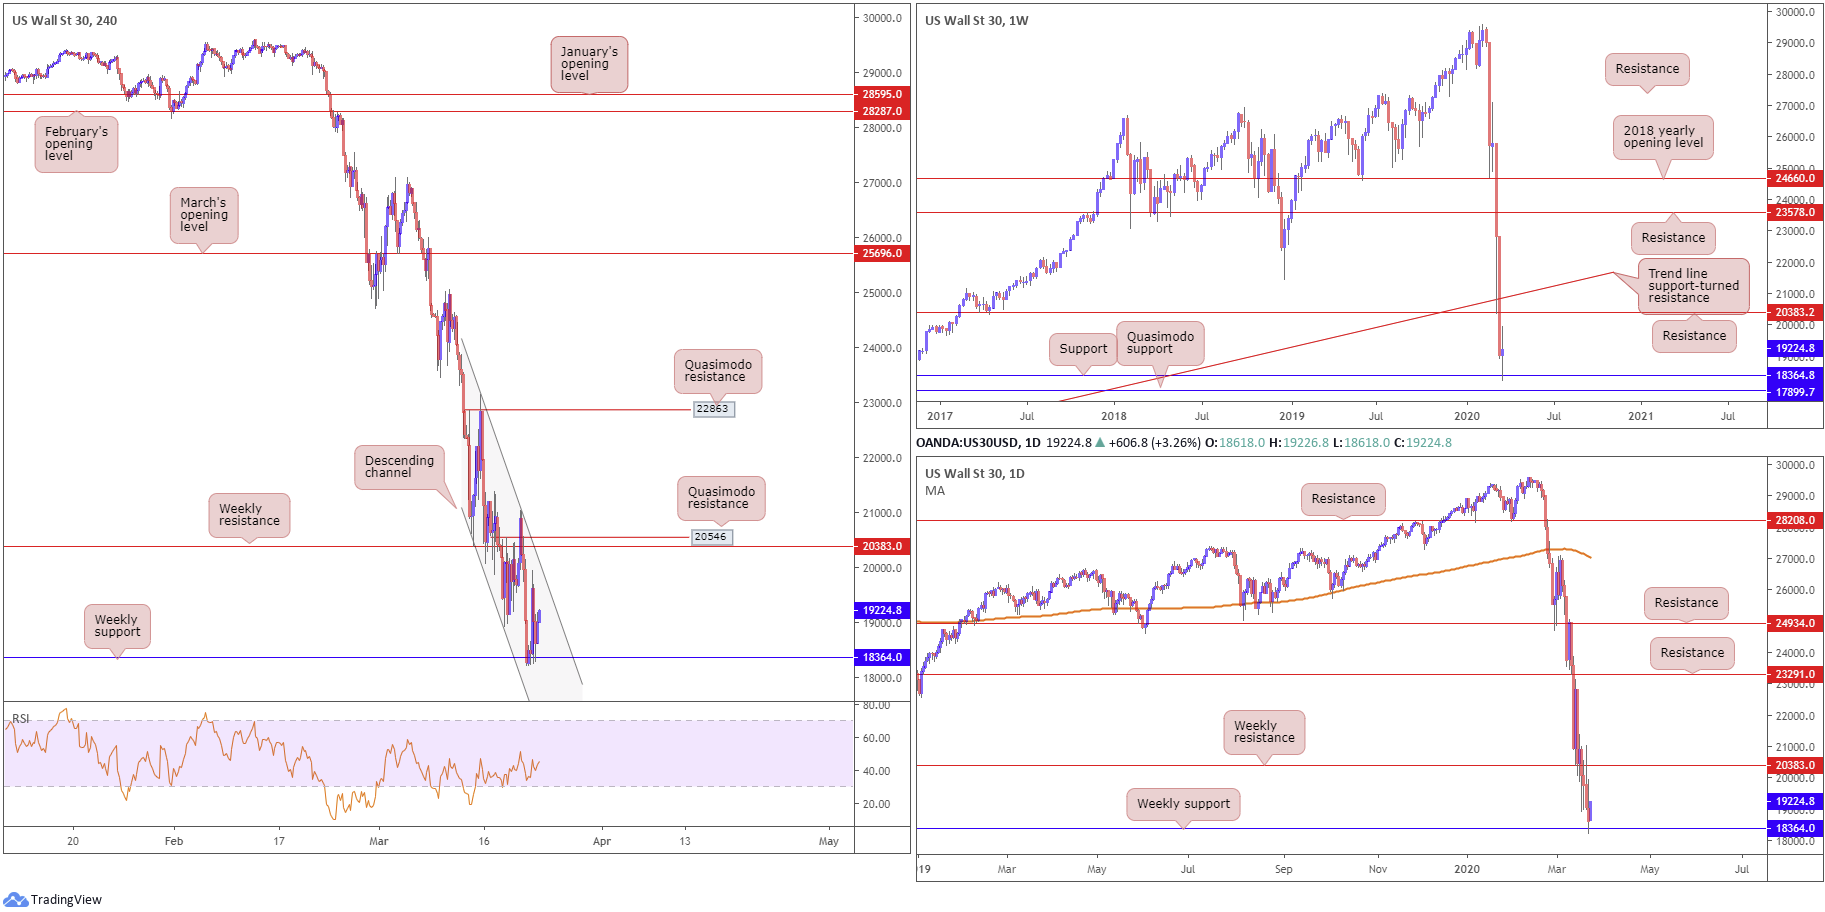
US equities wrapped up Monday in negative territory, despite a slew of new stimulus measures from the Federal Reserve. The Dow Jones Industrial Average declined 582.05 points, or 3.04%; the S&P 500 also lost 67.52 points, or 2.93%, and the tech-heavy Nasdaq 100 ended modestly higher by 12.63 points, or 0.18%.
Technical headlines had price action shake hands with weekly support coming in from 18364, with the response on the weekly timeframe chalking up a temporary doji indecision candle. Continued rejection from this angle has weekly resistance at 20383 in sight.
H4 price action, although seen rebounding from weekly support mentioned above at 18364, can also be found compressing within the limits of a descending channel formation, extended from 23145/20616. A breakout north from the current channel configuration reveals weekly resistance highlighted above at 20383, closely shadowed by H4 Quasimodo resistance at 20546. In terms of the relative strength index (RSI), the value continues to remain above its oversold region, though has had difficulty in breaching 50.00.
Areas of consideration:
In the event buying from weekly support has the H4 candles close outside of the current H4 descending channel formation, this will likely be viewed as a bullish signal for an approach to weekly resistance at 20383. A retest of the broken channel resistance as support before rallying higher is desirable as it can offer additional confirmation for buyers.
XAU/USD (GOLD):
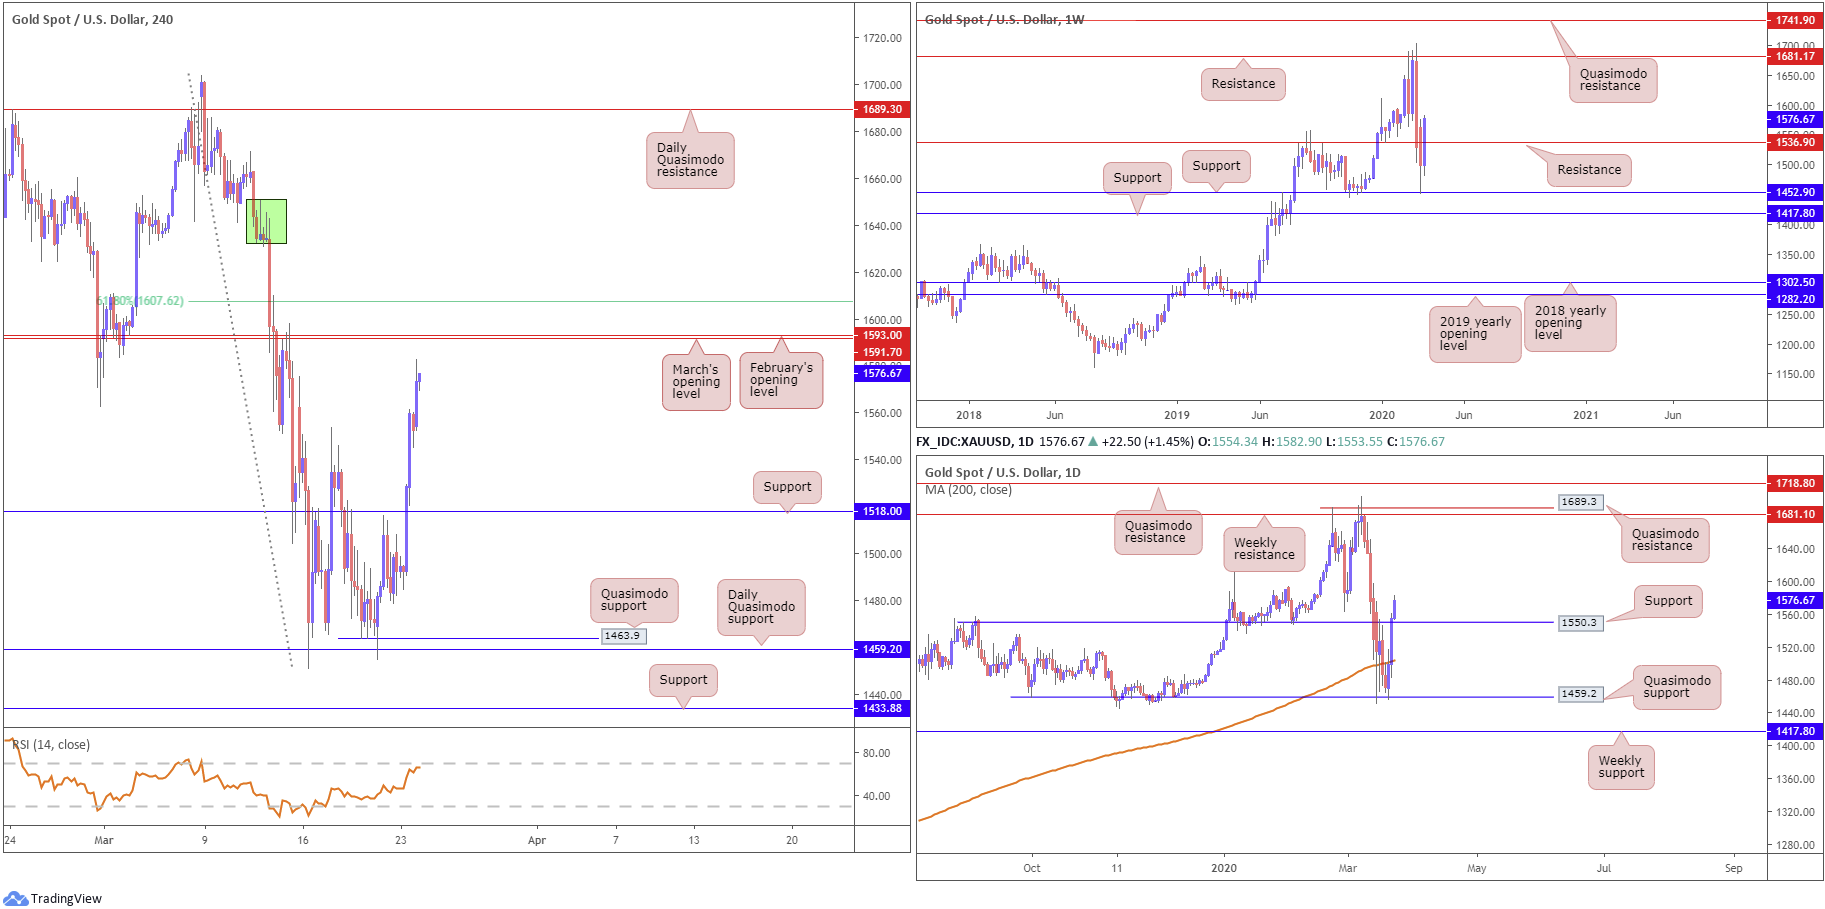
Monday witnessed the precious metal strongly advance against the buck, adding more than $55, or 3.7%.
Gold extended gains after the Federal Reserve took unprecedented measures to shore up the US economy, which has been hit by the spread of the coronavirus. In a surprise announcement Monday, the central bank said it would buy unlimited amounts of Treasury bonds and mortgage-backed securities to keep borrowing costs at rock-bottom levels, aiding bullion which doesn’t offer interest. It also set up programs to ensure credit flows to corporations as well as state and local governments (Bloomberg).
Technically speaking, H4 price is poised to connect with February and March’s opening levels at 1593.0 and 1591.7, respectively. It should also be noted a 61.8% Fibonacci retracement level is seen close by at 1607.6. In addition, the relative strength index (RSI) is seen fast approaching overbought ground.
Weekly price reveals moves above resistance at 1536.9 in recent trade. The break of this level may rejuvenate a gold bid this week and potentially welcome an approach to resistance at 1681.1. Meanwhile, daily price made its way through resistance at 1550.3, now a serving support level. This follows Quasimodo support at 1459.2 withstanding a number of downside attempts. Like the weekly timeframe, daily price exhibits scope to firm as far north as weekly resistance at 1681.1, followed by daily Quasimodo resistance at 1689.3.
Areas of consideration:
Feb/Mar opening levels on the H4 timeframe between 1593.0/1591.7 offer interesting resistance, particularly given the 61.8% Fibonacci resistance seen close by at 1607.6. However, with weekly and daily price displaying scope for further upside until reaching weekly resistance at 1681.1, a reaction from the said H4 resistances may only be minor.
Beyond the current resistances, therefore, may provide buying opportunities, targeting H4 supply (green) at 1650.3-1633.3. Above this point, the research team sees limited active supply until reaching the daily Quasimodo resistance mentioned above at 1689.3.
The accuracy, completeness and timeliness of the information contained on this site cannot be guaranteed. IC Markets does not warranty, guarantee or make any representations, or assume any liability regarding financial results based on the use of the information in the site.
News, views, opinions, recommendations and other information obtained from sources outside of www.icmarkets.com.au, used in this site are believed to be reliable, but we cannot guarantee their accuracy or completeness. All such information is subject to change at any time without notice. IC Markets assumes no responsibility for the content of any linked site.
The fact that such links may exist does not indicate approval or endorsement of any material contained on any linked site. IC Markets is not liable for any harm caused by the transmission, through accessing the services or information on this site, of a computer virus, or other computer code or programming device that might be used to access, delete, damage, disable, disrupt or otherwise impede in any manner, the operation of the site or of any user’s software, hardware, data or property.


