
DXY:
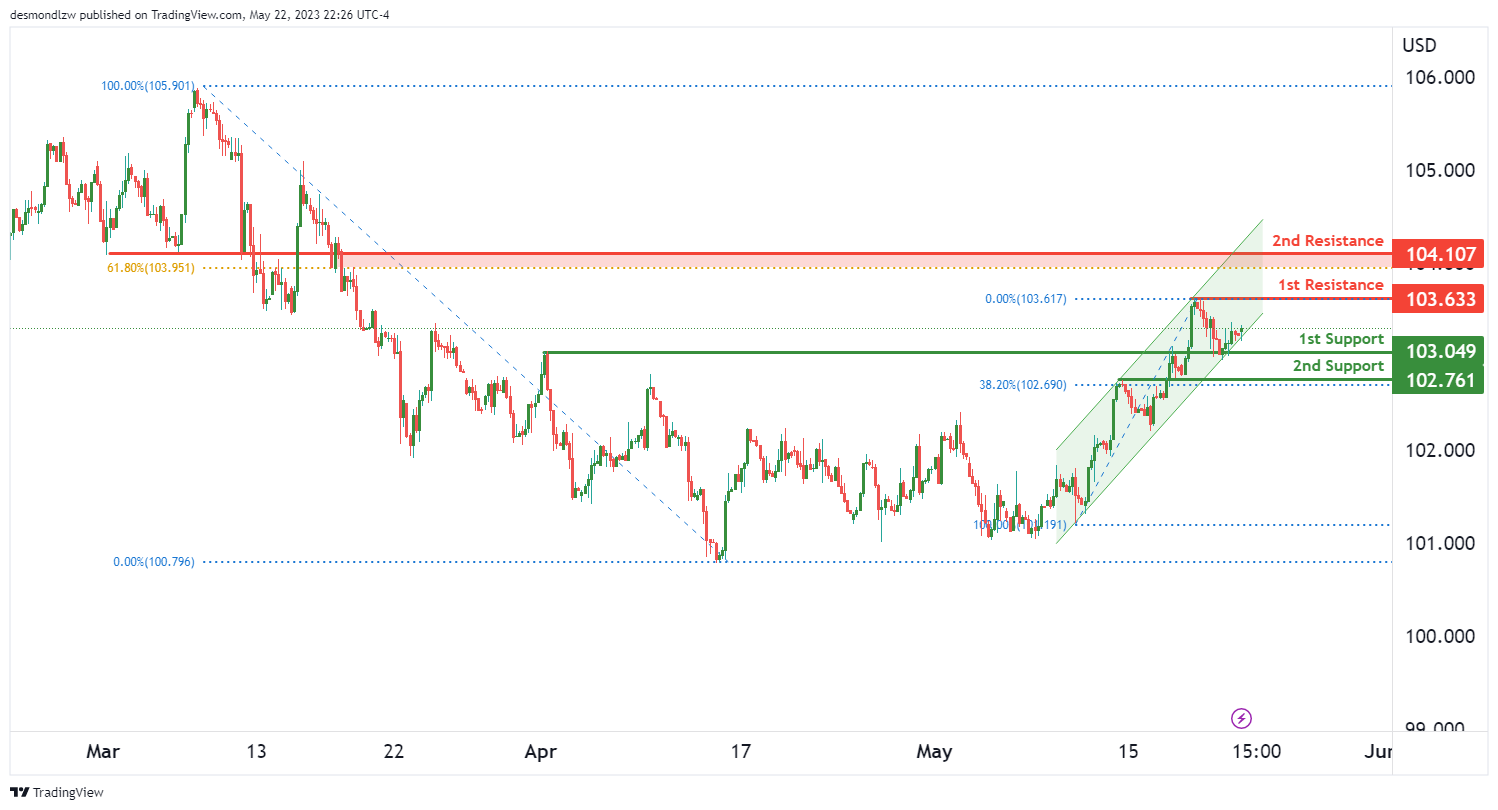
The DXY is currently showing a bullish trend, with the price movement in a bullish ascending channel contributing to this momentum.
The price could potentially continue its upward movement towards the first resistance level.
The first support level is at 103.04 and is considered an overlap support, a price level that has previously acted as both support and resistance.
The second support level is located at 102.76. This level also serves as an overlap support and aligns with the 38.20% Fibonacci retracement level, highlighting its significance in the current market conditions.
On the upside, the first resistance level is at 103.63, which has historically acted as a multi-swing high resistance, where the price has touched and retreated several times in the past.
The second resistance level is at 104.10 and functions as an overlap resistance, indicating its previous role as both support and resistance. This level also corresponds with the 61.80% Fibonacci retracement, suggesting it may present a significant hurdle for further price increases.
EUR/USD:
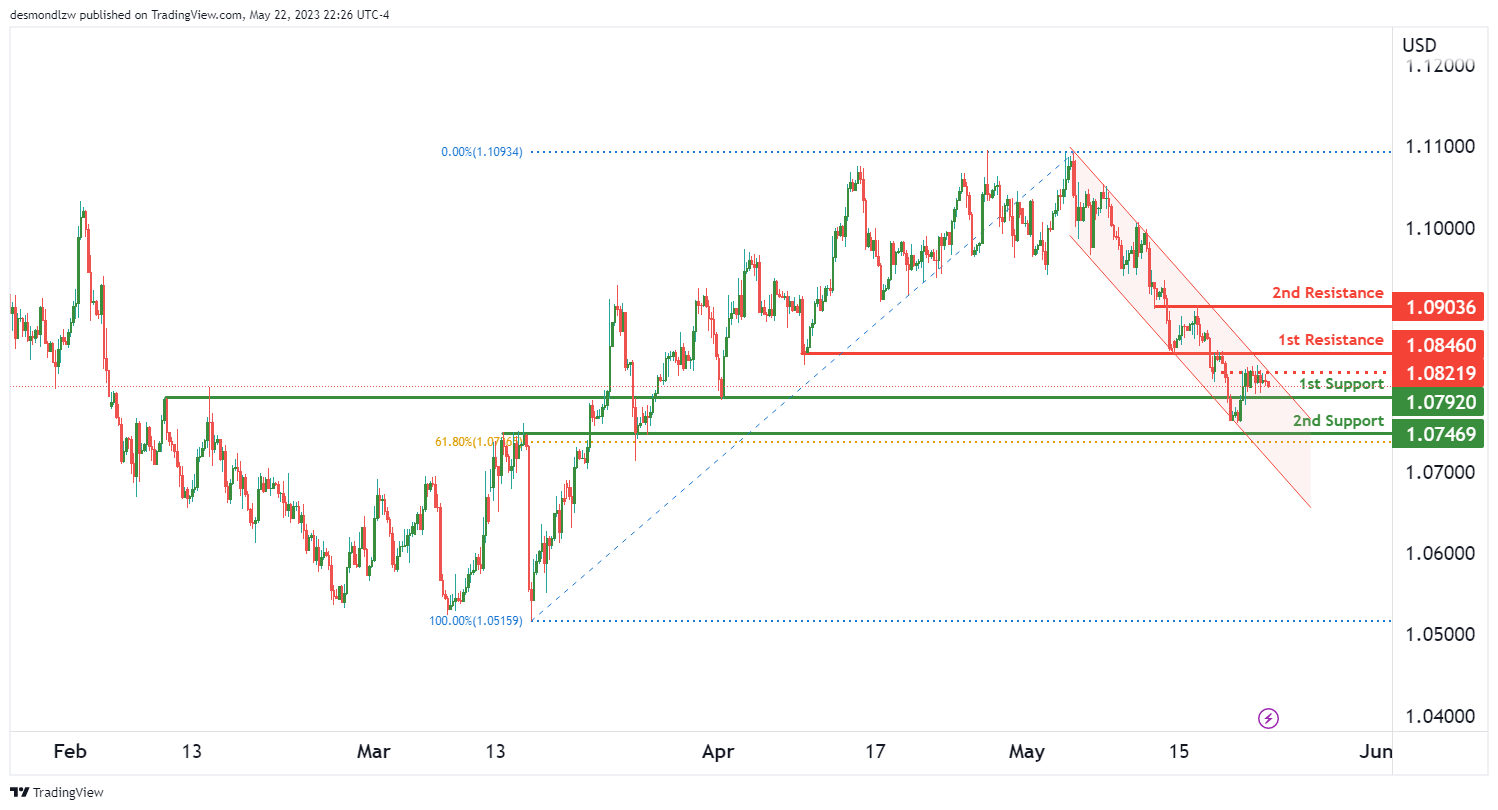
The EUR/USD pair currently exhibits a bearish trend, with the price moving in a bearish descending channel.
Given this trend, there is potential for continued bearish movement towards the initial support level.
The first support level is identified at 1.0792 and acts as an overlap support, indicating it has previously served as both support and resistance.
The second support level, at 1.0746, also functions as an overlap support and coincides with the 38.20% Fibonacci retracement level, reinforcing its significance in the current market scenario.
If the price were to reverse direction, the first resistance level is situated at 103.63. This level has historically acted as a multi-swing high resistance, suggesting the price has struggled to break above this level on multiple occasions.
The second resistance level stands at 104.10, serving as an overlap resistance. This level aligns with the 61.80% Fibonacci retracement level, indicating it could act as a significant barrier to upward price movements.
GBP/USD:
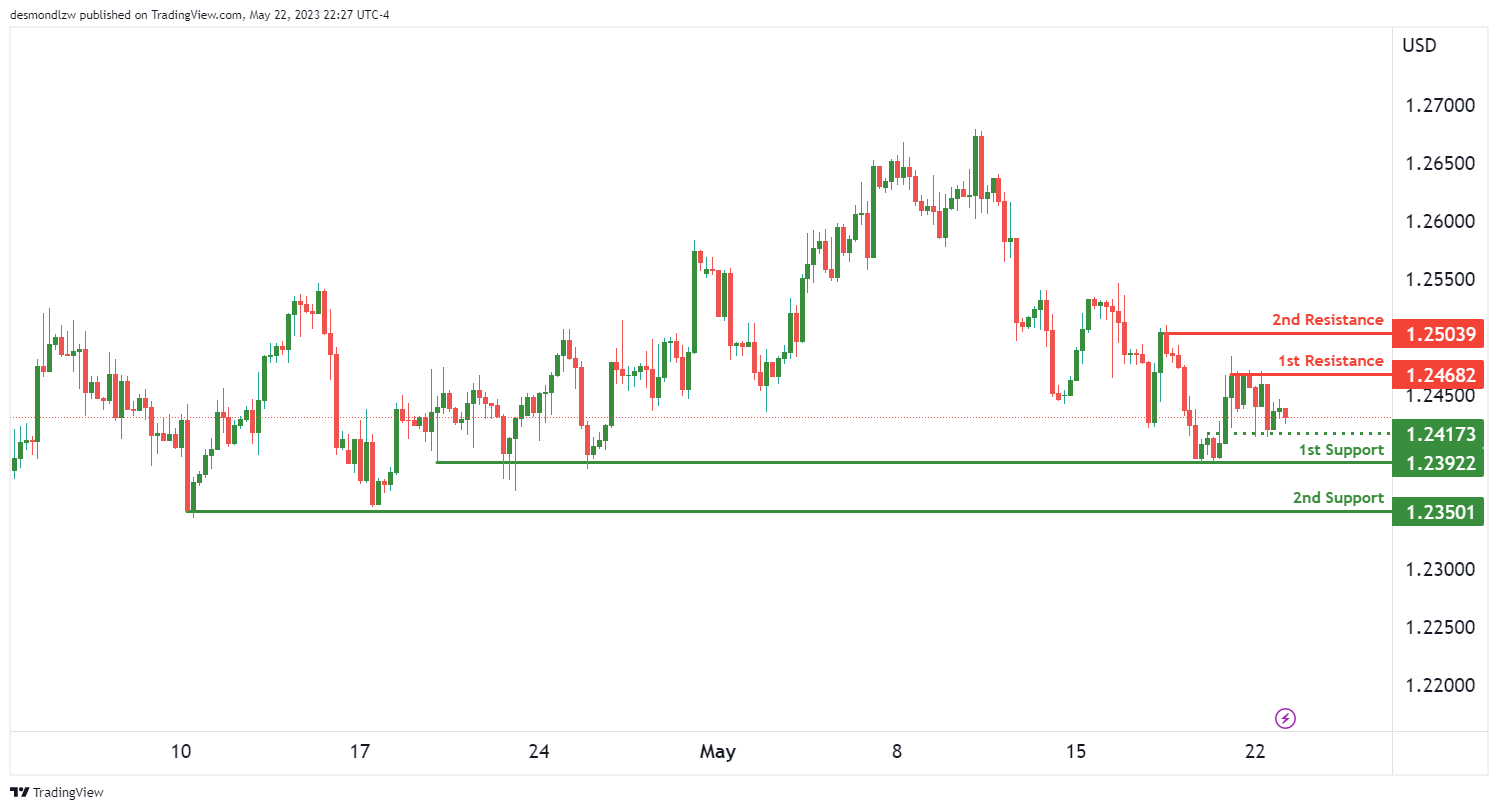
The GBP/USD pair currently demonstrates a bearish trend, suggesting potential for further downward price movement towards the primary support level.
The initial support level is situated at 1.2392 and has historically functioned as a multi-swing low support, indicating its significance as a point of demand in the market.
A secondary support level at 1.2340 acts similarly as a multi-swing low support, further emphasizing its role in potentially halting further price declines.
Contrarily, if the price reverses upwards, the first resistance level can be found at 1.2468. This level has previously acted as a multi-swing high resistance, suggesting the price has encountered difficulties breaking above this point on multiple attempts.
A second resistance level at 1.2503 serves as a swing high resistance, indicating its potential to act as a barrier to upward price movements.
USD/CHF:
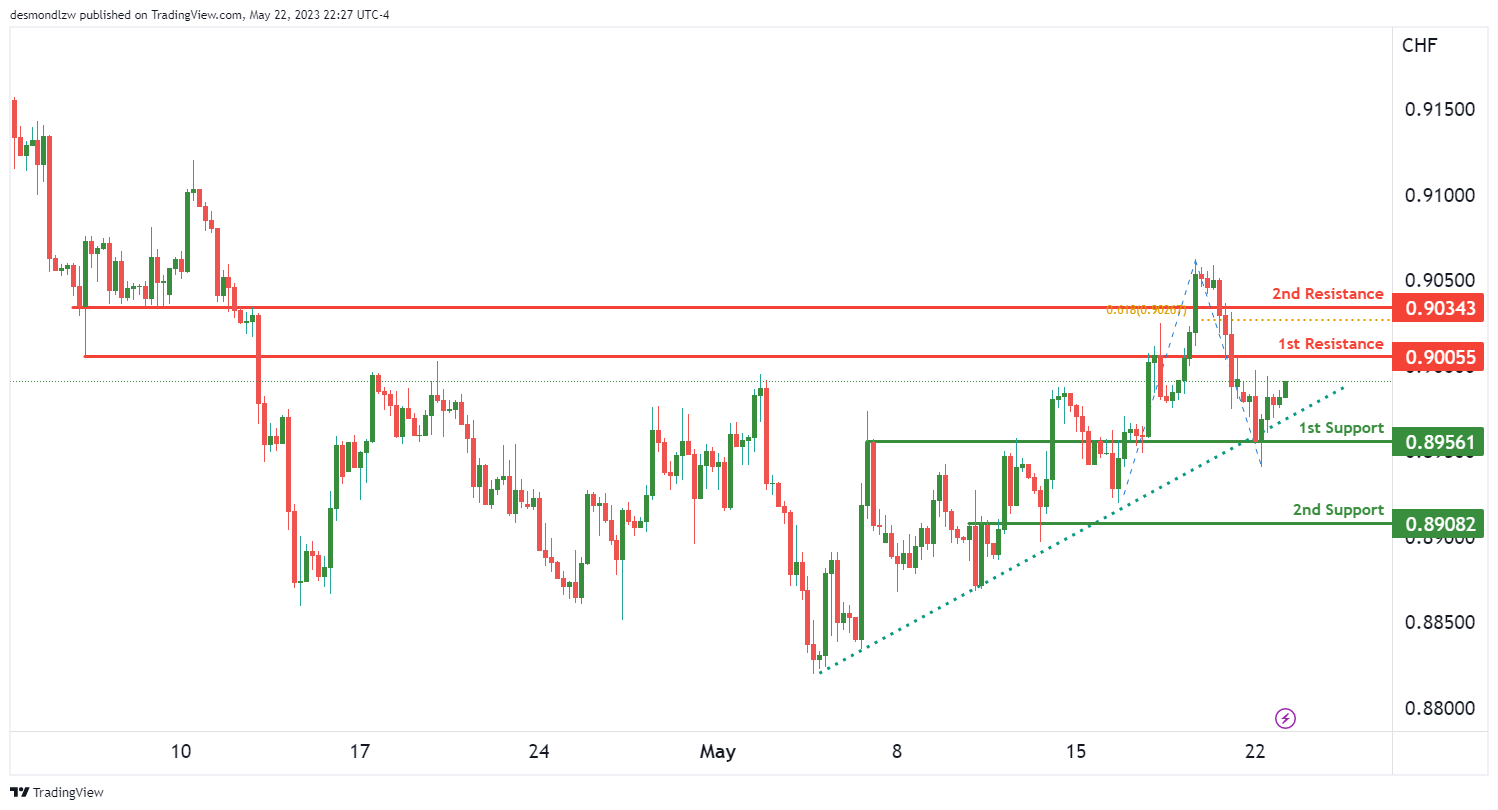
The USD/CHF pair is currently showing a bullish trend, with the price staying above a significant ascending trend line, indicating the possibility for continued bullish momentum.
In light of this trend, the price could potentially continue its bullish ascent towards the first resistance level.
The initial support level is at 0.8956 and acts as an overlap support, a level that has historically served both as support and resistance, indicating its potential as a significant floor level.
A secondary support level can be found at 0.8908, serving also as an overlap support, further emphasizing its role as a potential floor level for the price.
On the other hand, if the price continues to rise, the first resistance level is located at 0.9005. This level has served as an overlap resistance, indicating its previous role as both support and resistance.
The second resistance level stands at 0.9034, acting as a pullback resistance. Additionally, this level coincides with the 61.8% Fibonacci projection, suggesting its potential to act as a significant ceiling level for price movements.
USD/JPY:
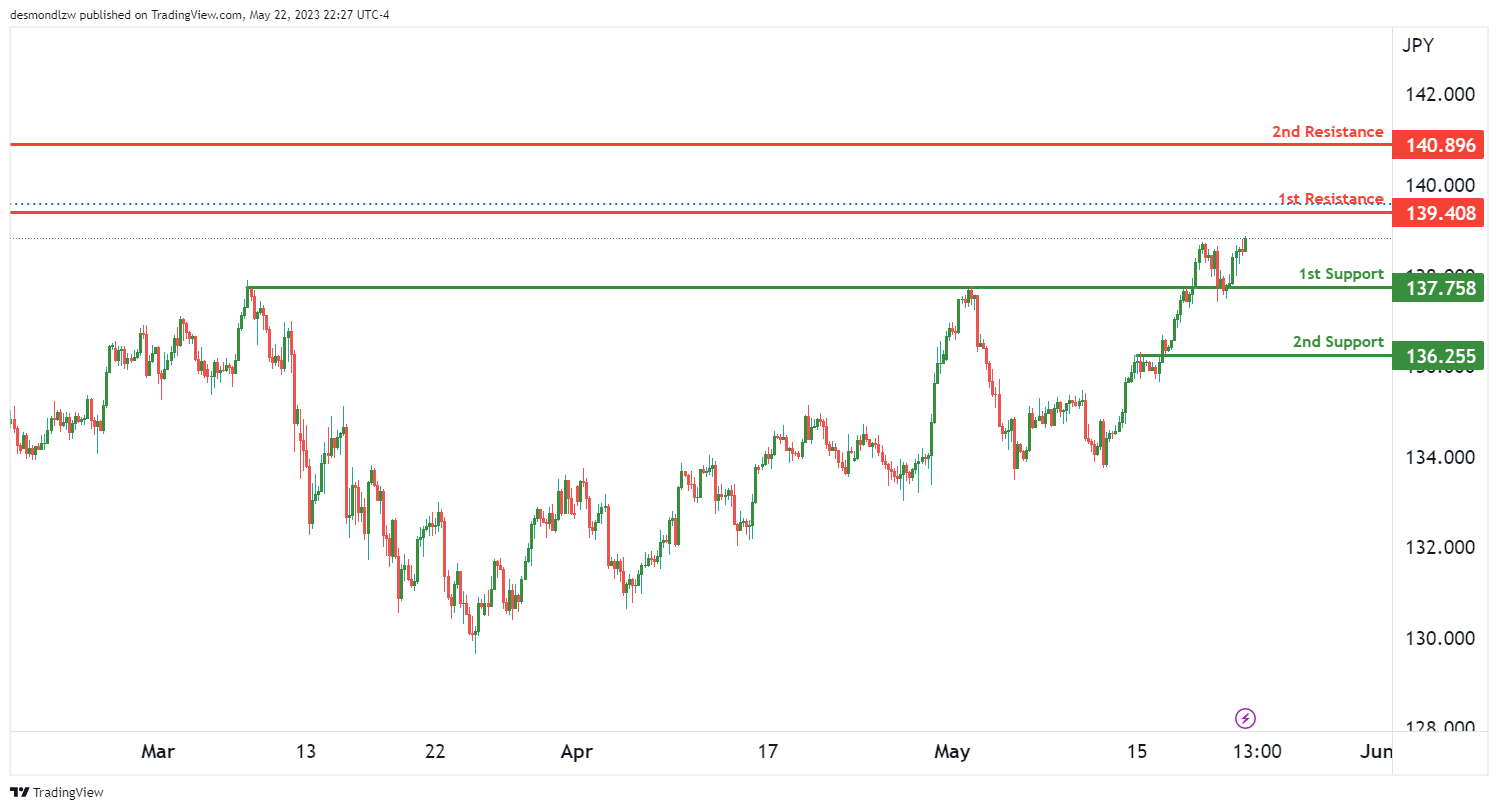
The USD/JPY pair is currently on a bullish trend, suggesting that the pair could continue its upward trajectory towards the first resistance level.
The first level of support is at 137.75, functioning as an overlap support, which is a level that has historically acted as both resistance and support. This could potentially halt or reverse any downward movement in the pair.
A second support level can be found at 136.25. This level also acts as an overlap support, reinforcing its potential as a crucial floor level for the pair.
On the upside, if the bullish trend continues, the first level of resistance is at 139.40. This level acts as a swing high resistance, indicating it has been a point at which upward price momentum has historically stopped and reversed.
The second resistance level is located at 140.89. This level serves as a pullback resistance, indicating it is a price level at which the currency pair has previously experienced a reversal following a brief retracement.
AUD/USD:
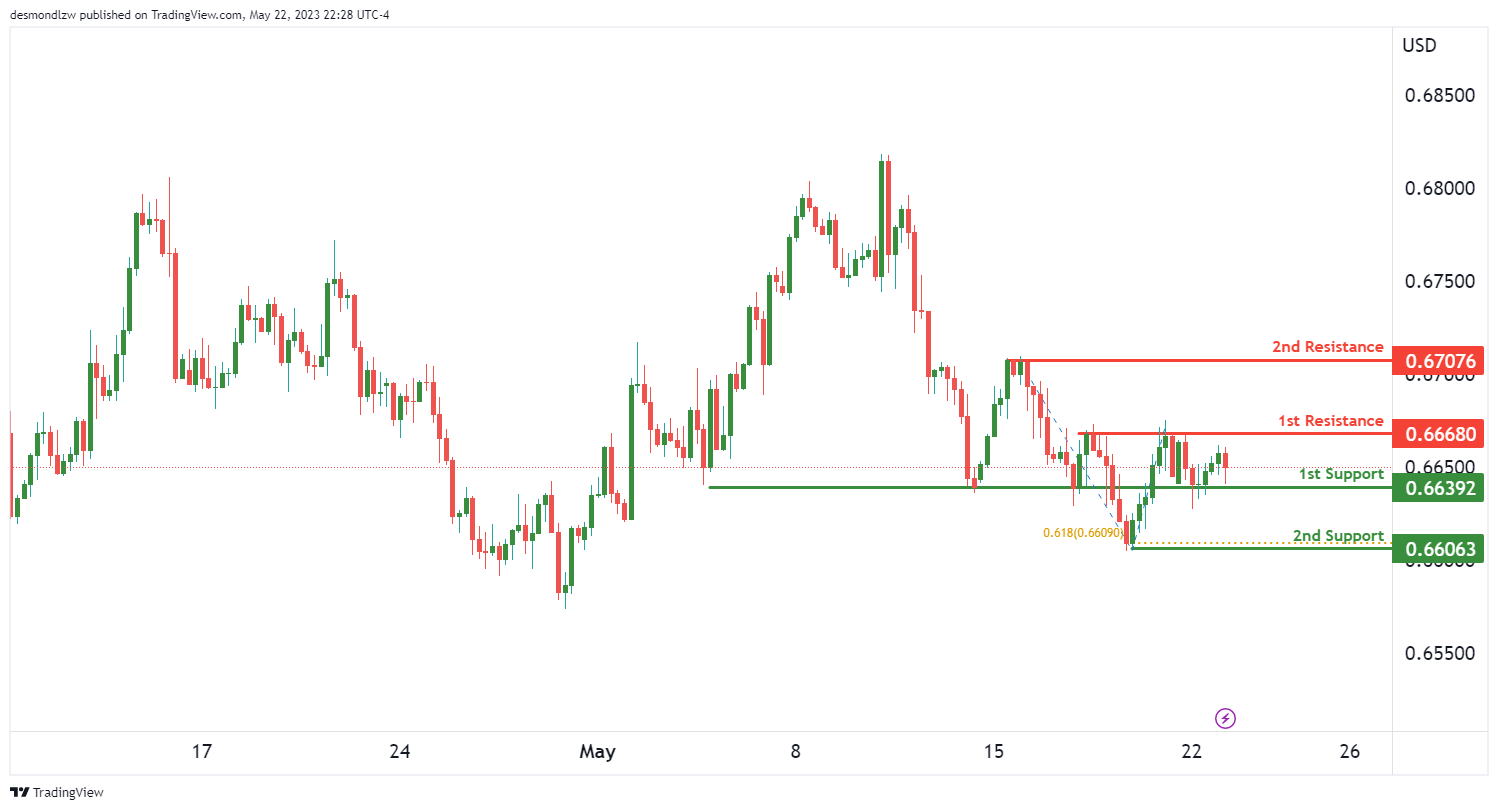
The AUD/USD pair currently shows a neutral trend, indicating that the pair could oscillate between the first resistance and first support level.
The first support level is at 0.6639, acting as an overlap support, which is a price level that has historically functioned as both resistance and support. This might be a region where the price can pause or rebound.
The second support level lies at 0.6606. This level is considered a swing low support, which means it’s a price level where the pair has historically bottomed out. Additionally, it aligns with the 61.8% Fibonacci projection, further strengthening its significance.
On the other hand, if the price sees an upward move, the first resistance level is found at 0.6668. This level has acted as a multi-swing high resistance in the past, indicating that it could be a challenging point for the pair to surpass.
The second resistance level is at 0.6707, which also serves as a multi-swing high resistance, suggesting that it’s a level where the price has historically found difficulty in breaking through.
NZD/USD
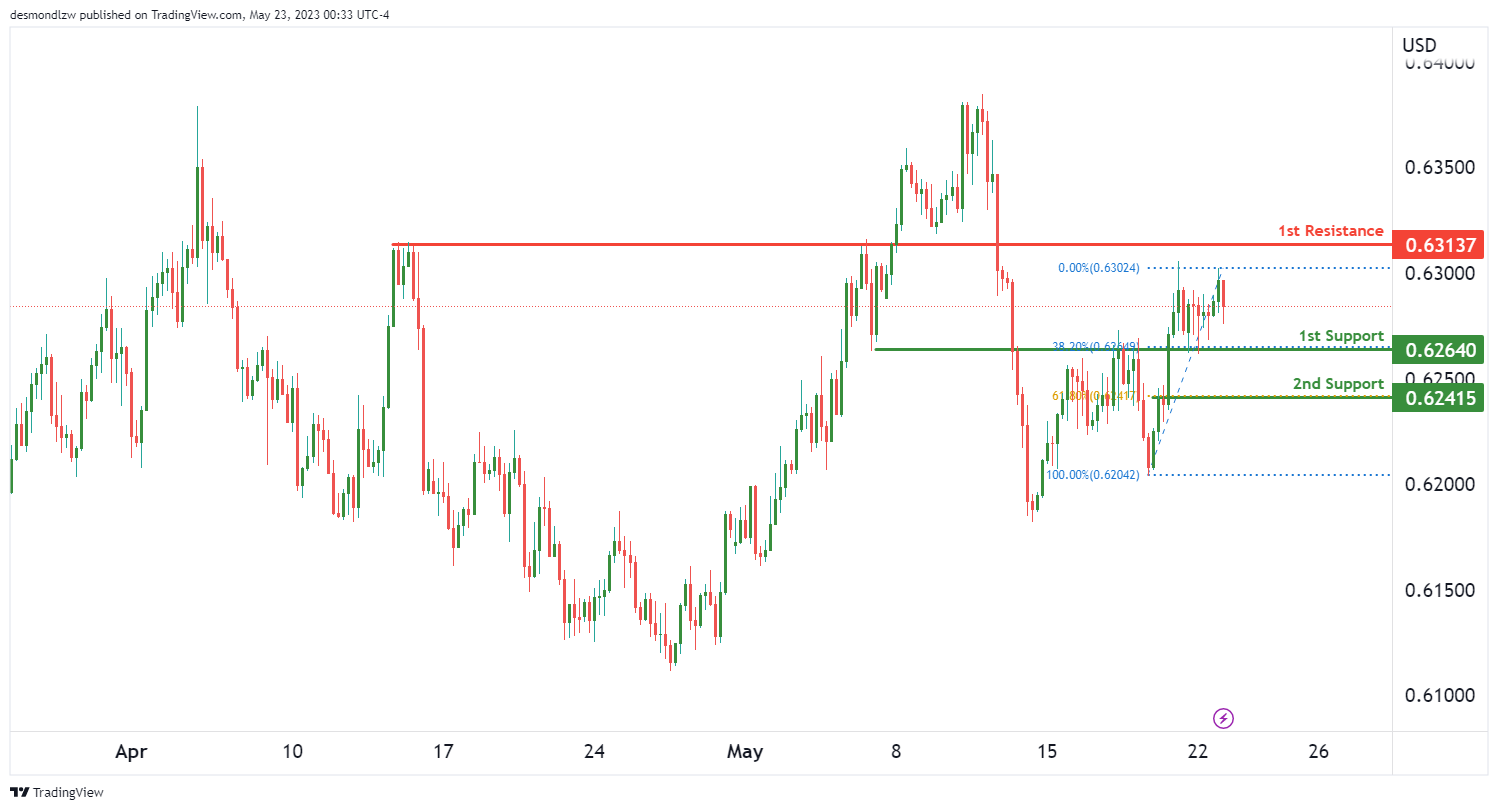
The NZD/USD pair currently exhibits a neutral trend, suggesting that the price might oscillate between the first resistance and first support levels.
The first support level is identified at 0.6264, which acts as an overlap support. This level has historical significance, acting as both resistance and support in the past. It also aligns with the 38.2% Fibonacci retracement level, adding further credibility to its potential as a support level.
The second support level is positioned at 0.6241, which aligns with the 61.8% Fibonacci retracement level. This is often considered a key level in market retracements and may be significant in halting further price decline.
On the upside, if the price experiences an upward movement, the first resistance level is at 0.6313. This level serves as a pullback resistance, indicating that it’s a point where the price has previously rebounded after a brief retracement.
.
USD/CAD:
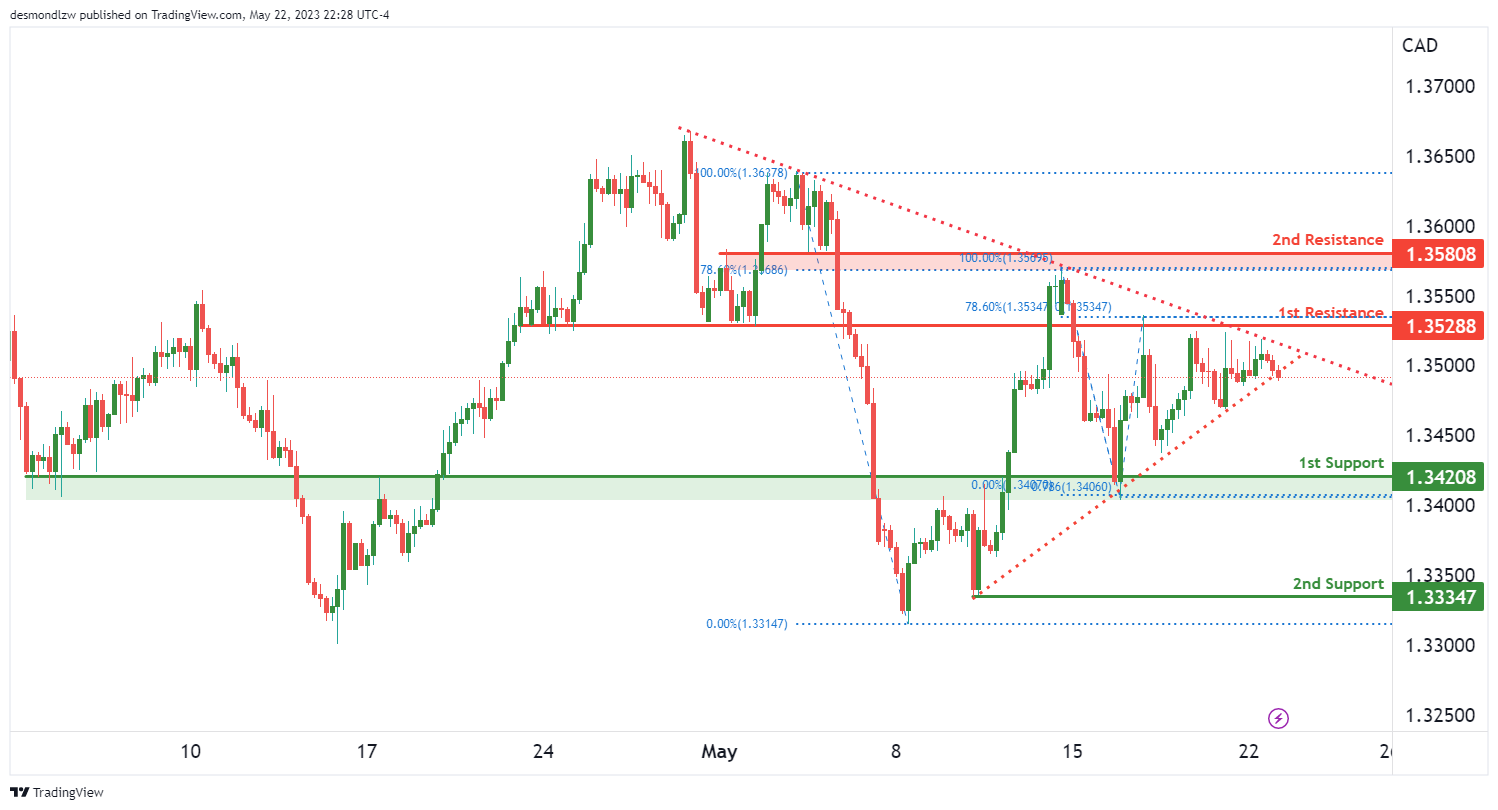
The USDCAD pair currently shows a neutral trend, with the possibility of price fluctuations between the first resistance and first support levels.
The first support level is found at 1.3420 and is considered an overlap support. Overlap supports have historically acted as both resistance and support, suggesting that this level could halt a price decline.
The second support level is at 1.3334, although the specific factors contributing to its significance have not been provided.
On the other hand, should the price increase, the first resistance level is at 1.3528. This level is recognized as an overlap resistance and aligns with the 78.6% Fibonacci retracement level, which could act as a significant barrier to price increases.
The second resistance level is at 1.3580, functioning as a swing high resistance and corresponding with the 78.6% Fibonacci retracement level. Swing high resistance levels are those that have capped price increases in the past, potentially indicating a reversal.
The chart presents a symmetrical triangle pattern, representing a period of consolidation before a breakout or breakdown occurs. A break above the upper trendline could signal a bullish breakout, whereas a break below the lower trendline might indicate a bearish breakdown.
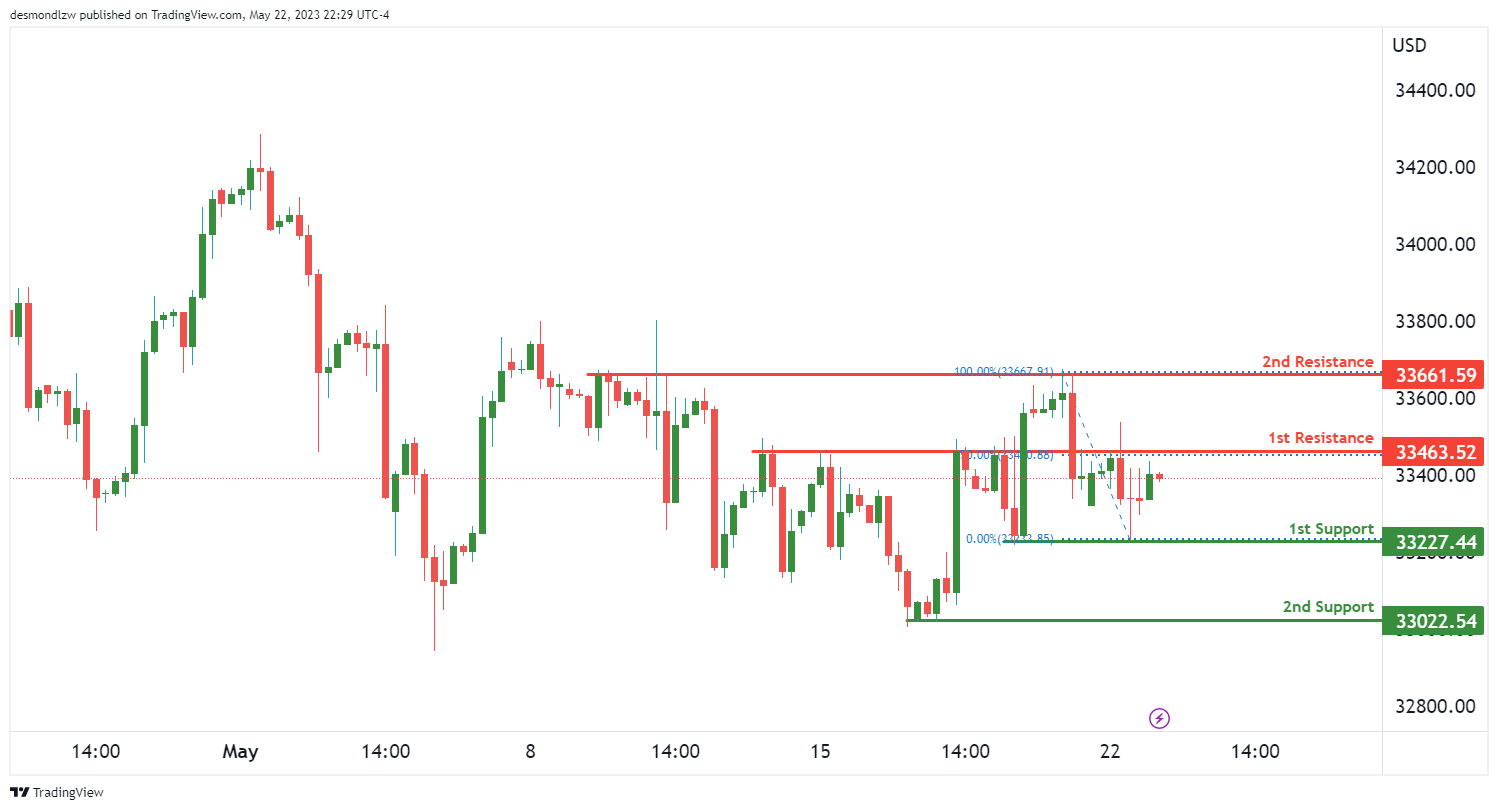
DJ30:
The DJ30 chart currently exhibits a weak bullish momentum with low confidence, indicating the potential for limited upward movement.
In the short term, there is a possibility of a bullish continuation towards the first resistance level at 33463.52.
The first support level at 33227.44 is identified as an overlap support, suggesting it could act as a price floor if the price were to decline.
Additionally, there is a second support level at 33022.54, recognized as an overlap support, providing further support in case of a price decline.
On the resistance side, the first resistance level at 33463.52 is an overlap resistance, which could present a barrier if the price attempts to rise.
There is also a second resistance level at 33661.59, identified as an overlap resistance, which adds to its significance in potentially restraining the price’s upward movement.
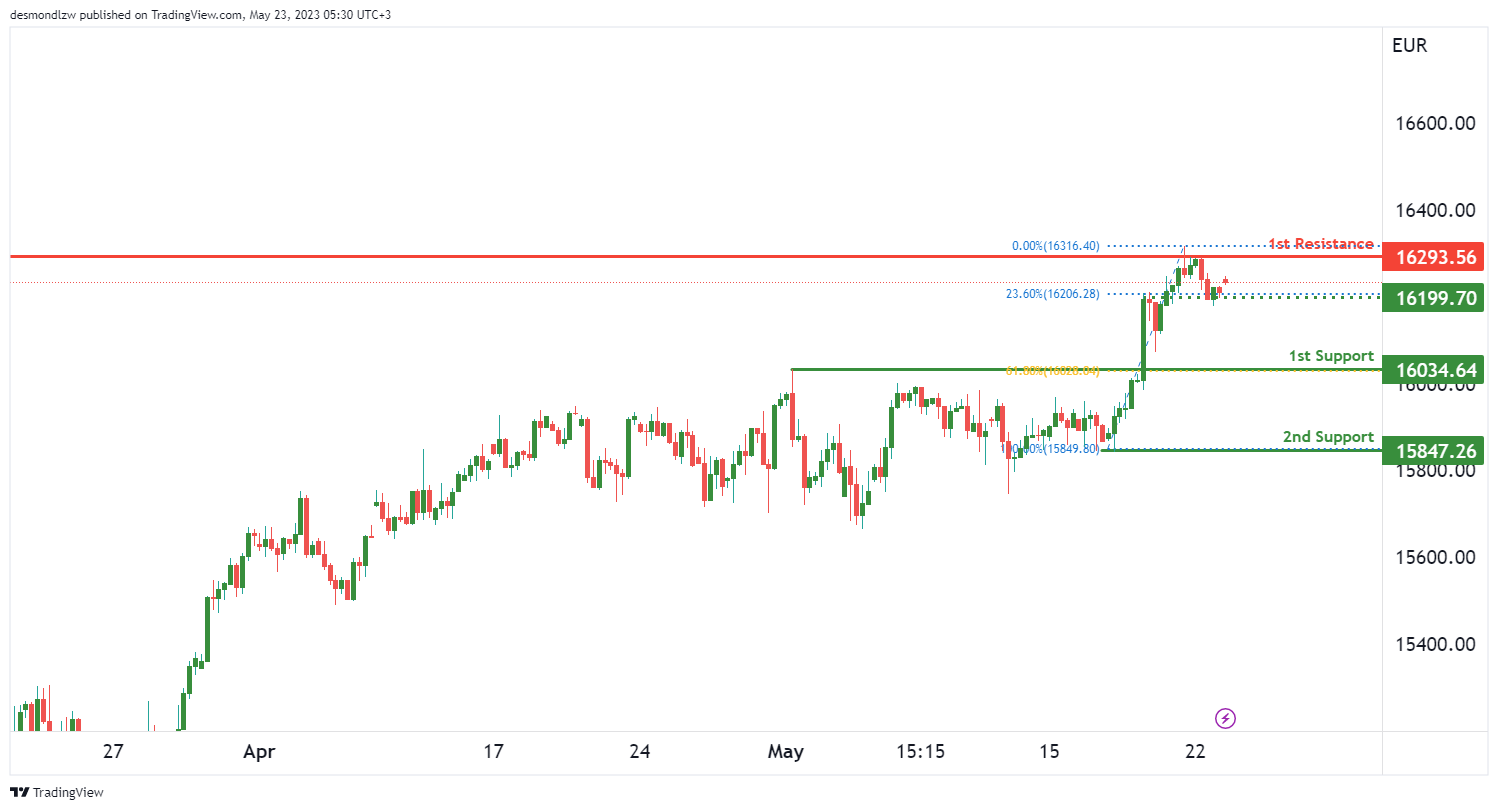
GER30:
The GER30 chart currently shows a weak bullish momentum with low confidence, indicating the potential for limited upward movement.
In the short term, there is a possibility of a bullish continuation towards the first resistance level at 16293.56.
The first support level at 16034.64 is identified as an overlap support, suggesting it could act as a price floor if the price were to decline.
Additionally, there is a second support level at 15847.26, recognized as an overlap support, providing further support in case of a price decline.
There is also an intermediate support level at 16199.70, identified as an overlap support, which adds to its significance in providing potential price support.
On the resistance side, the first resistance level at 16293.56 is an overlap resistance, which could present a barrier if the price attempts to rise.
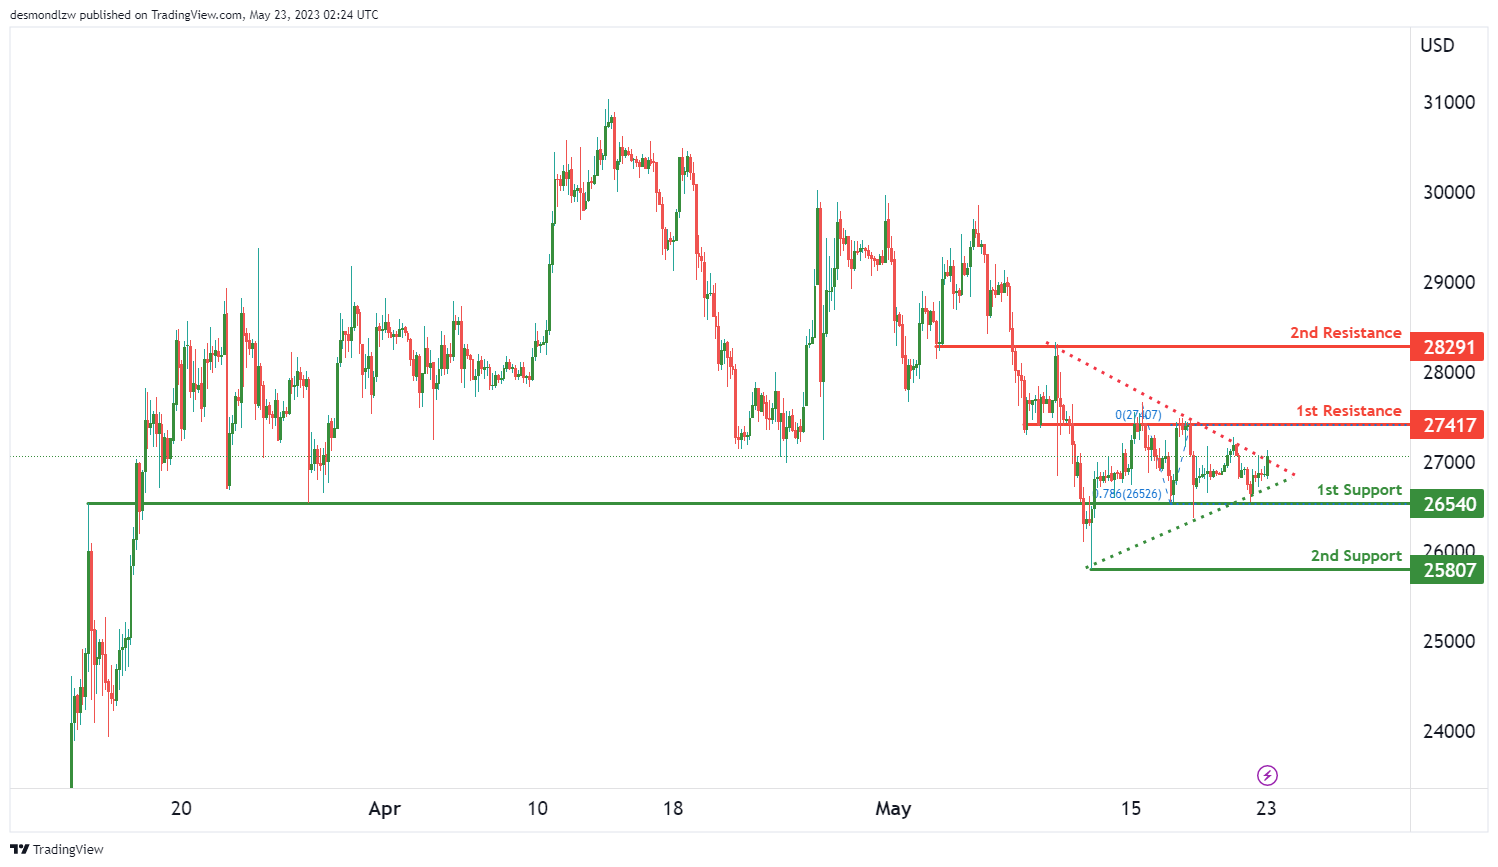
BTC/USD:
The BTC/USD pair is currently exhibiting a neutral trend, suggesting that price could oscillate between the first resistance and first support levels.
The first support level is established at 26540, and is classified as an overlap support, indicating it has served as both a resistance and support level in the past, which could halt a price drop.
The second support level is at 25807, serving as a swing low support. This is a price point where the price has historically rebounded, signifying it could potentially stop further price decline.
On the contrary, if the price increases, the first resistance level is located at 27417. This level is known as an overlap resistance, suggesting that it could act as a significant barrier to price increases.
The second resistance level stands at 28291 and is also an overlap resistance, implying it could resist further price ascension.
The chart also displays a symmetrical triangle pattern, which represents a period of consolidation before a breakout or breakdown. A break above the upper trendline could indicate a bullish breakout, while a break below the lower trendline might signal a bearish breakdown.
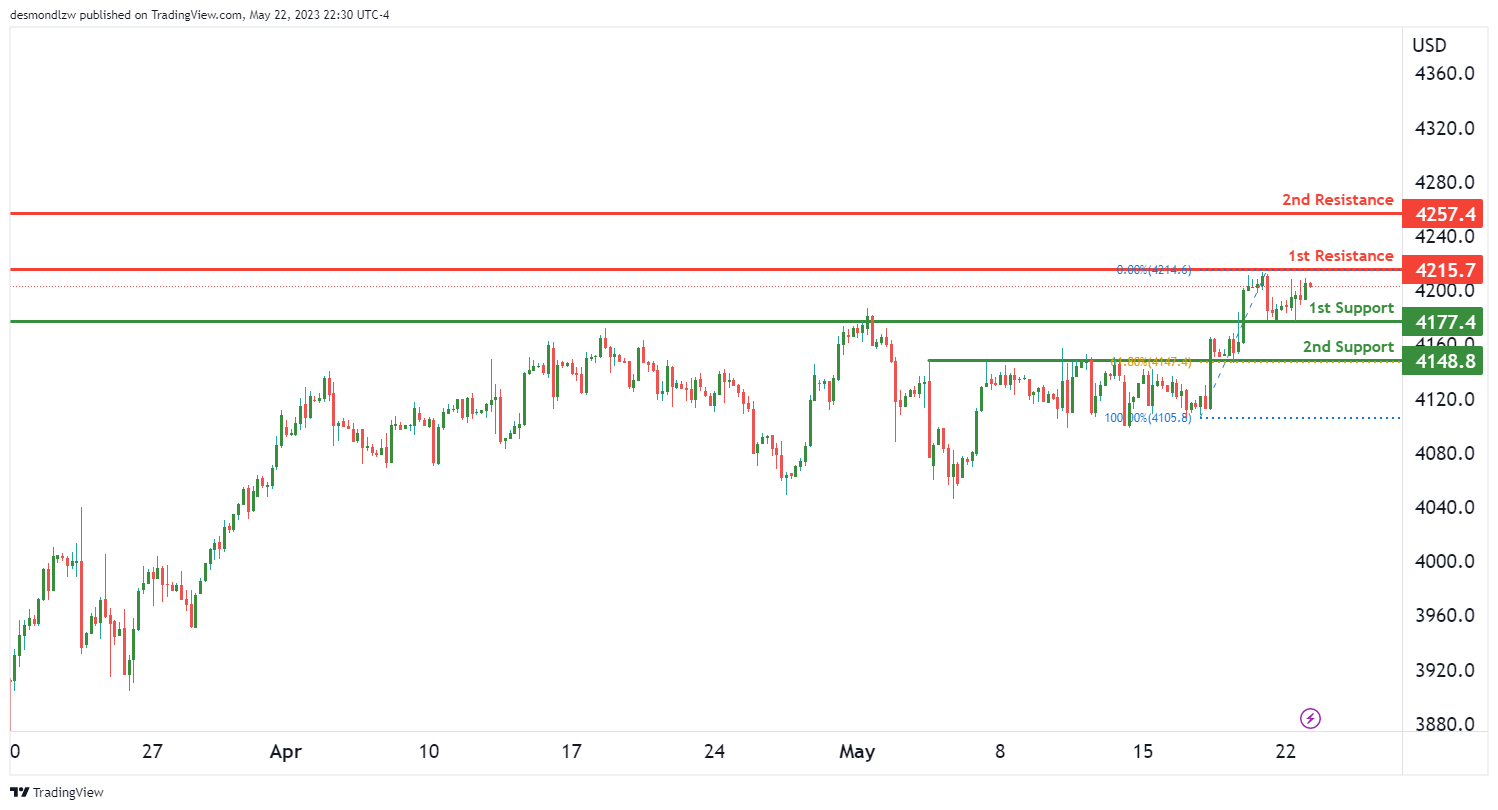
US500
The US500 chart currently shows a weak bullish momentum with low confidence, suggesting the potential for limited upward movement.
In the short term, there is a possibility of a bullish continuation towards the first resistance level at 4215.70.
The first support level at 4177.40 is identified as an overlap support, indicating its significance as a potential price floor.
Additionally, there is a second support level at 4148.80, recognized as an overlap support, providing further support if the price were to decline.
On the resistance side, the first resistance level at 4215.70 is an overlap resistance, which could act as a barrier if the price attempts to rise.
There is also a second resistance level at 4257.40, identified as an overlap resistance.
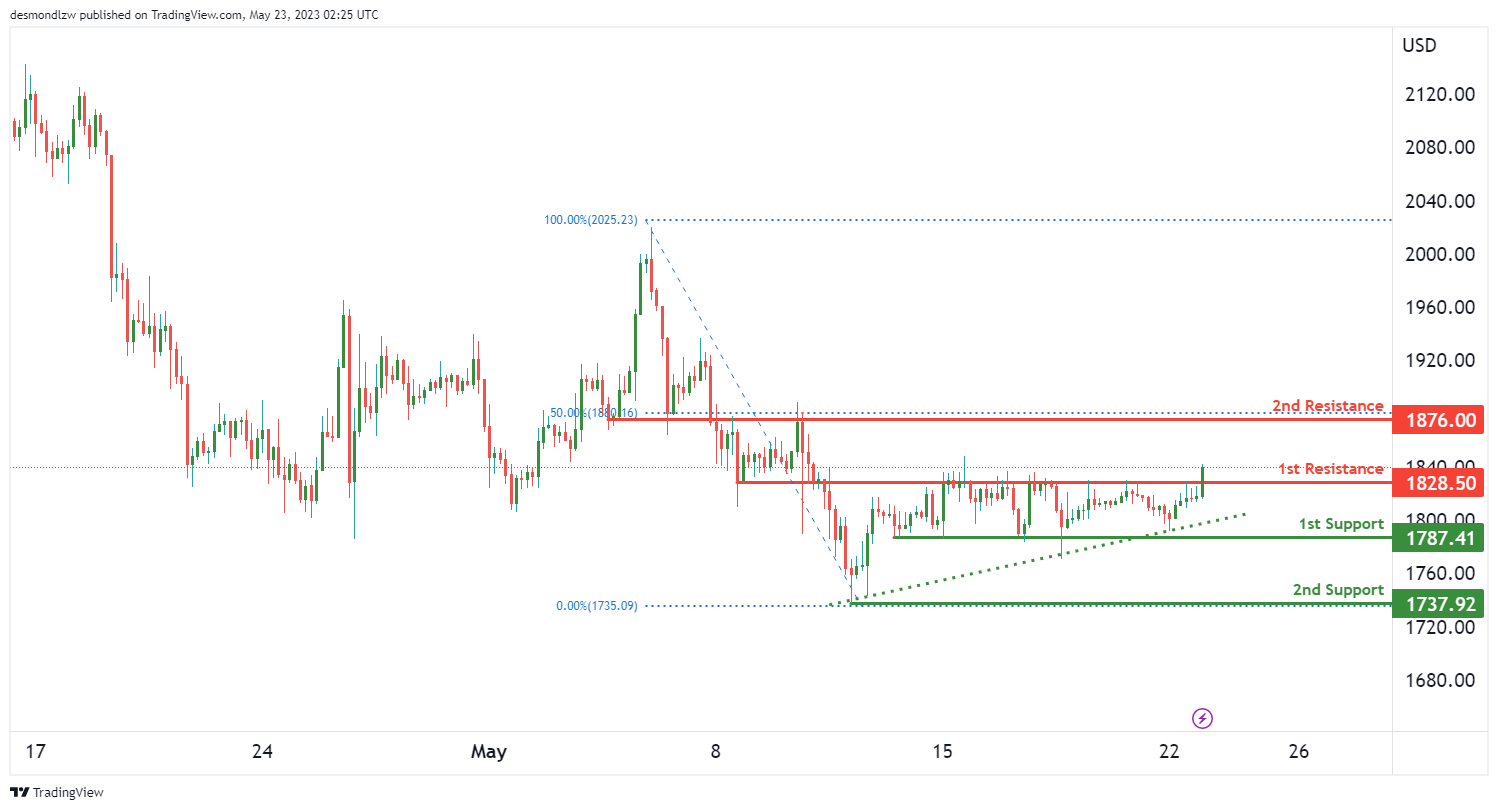
ETH/USD:
The ETH/USD pair is currently exhibiting a bullish trend, indicating that the price may continue to rise, potentially breaking through the first resistance level and advancing towards the second resistance level.
The first support level is situated at 1787.41, and is classified as an overlap support, demonstrating its previous role as both resistance and support, and its potential to halt a price drop.
The second support level is at 1737.92 and serves as a swing low support, a point where the price has historically rebounded, indicating it could potentially stop further price decline.
Conversely, if the price increases, the first resistance level stands at 1828.50. This level is an overlap resistance, suggesting it could act as a significant barrier to price increases.
The second resistance level is located at 1876.00 and is also classified as an overlap resistance, further supported by its alignment with the 50% Fibonacci retracement level, emphasizing its potential to impede further price ascension.
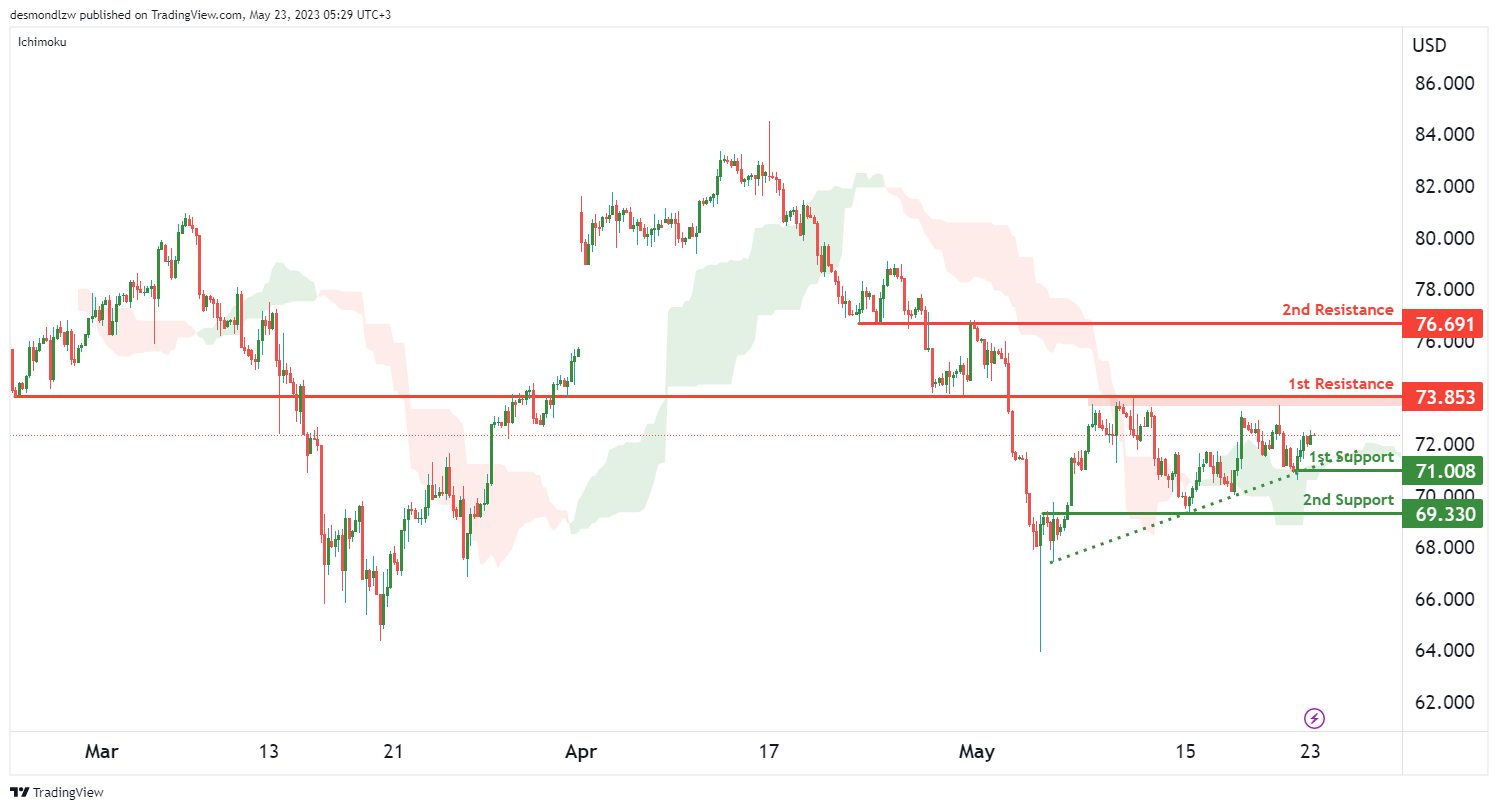
WTI/USD:
The WIT pair is currently displaying a bullish trend, suggesting that the price could potentially continue its upward trajectory towards the first resistance level. This bullish momentum is reinforced by the price being above a major ascending trend line and above the bullish Ichimoku cloud, two strong indicators of a possible continued upward movement.
The first support level is set at 71.00, acting as an overlap support, a price level that has functioned as both resistance and support in the past, and therefore may provide significant support to the price.
The second support level is located at 69.33, which is also classified as an overlap support, indicating it may serve as a robust barrier to a price decline.
Conversely, if the price continues to rise, the first resistance level stands at 73.85. This level functions as an overlap resistance, suggesting it could pose a challenge for the price to surpass.
Furthermore, the second resistance level is positioned at 76.69, which is also identified as an overlap resistance, emphasizing its potential to halt further price increases.
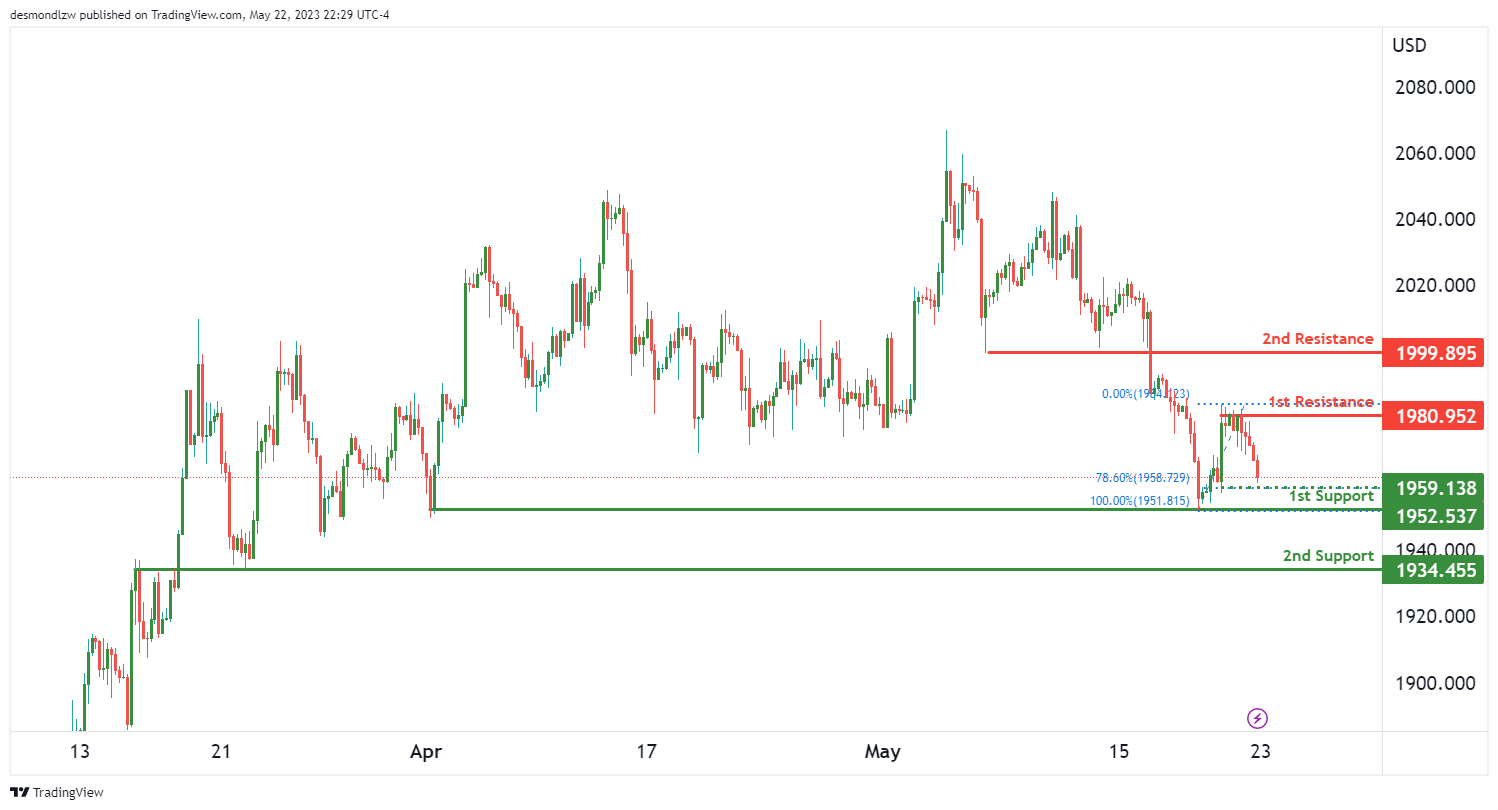
XAU/USD (GOLD):
The XAU/USD pair is currently on a bearish trend, suggesting a potential further decline towards the first level of support.
The first support level is at 1952.53 and represents a multi-swing low support, indicating that it is a price point where the value has historically bottomed out multiple times, making it a strong potential support.
The second support level, located at 1934.45, is an overlap support, a level that has historically served as both resistance and support, providing a reliable cushion against further price drops.
Conversely, if the price reverses direction, the first resistance level stands at 1980.95, acting as a pullback resistance, a level where the price has previously rebounded following a brief retracement.
The second resistance level is at 1999.89 and is also identified as a pullback resistance, indicating its potential to halt further price increases.
In addition, there is an intermediate resistance level at 1959.13, which is significant due to its alignment with the 78.6% Fibonacci retracement level, a key level in market retracements.
The accuracy, completeness and timeliness of the information contained on this site cannot be guaranteed. IC Markets does not warranty, guarantee or make any representations, or assume any liability regarding financial results based on the use of the information in the site.
News, views, opinions, recommendations and other information obtained from sources outside of www.icmarkets.com, used in this site are believed to be reliable, but we cannot guarantee their accuracy or completeness. All such information is subject to change at any time without notice. IC Markets assumes no responsibility for the content of any linked site.
The fact that such links may exist does not indicate approval or endorsement of any material contained on any linked site. IC Markets is not liable for any harm caused by the transmission, through accessing the services or information on this site, of a computer virus, or other computer code or programming device that might be used to access, delete, damage, disable, disrupt or otherwise impede in any manner, the operation of the site or of any user’s software, hardware, data or property.


