
Key risk events today:
Canada Core Retail Sales m/m and Retail Sales m/m; Parliament Brexit Vote; BoC Business Outlook Survey; RBA Assist Gov Kent Speaks.
EUR/USD:
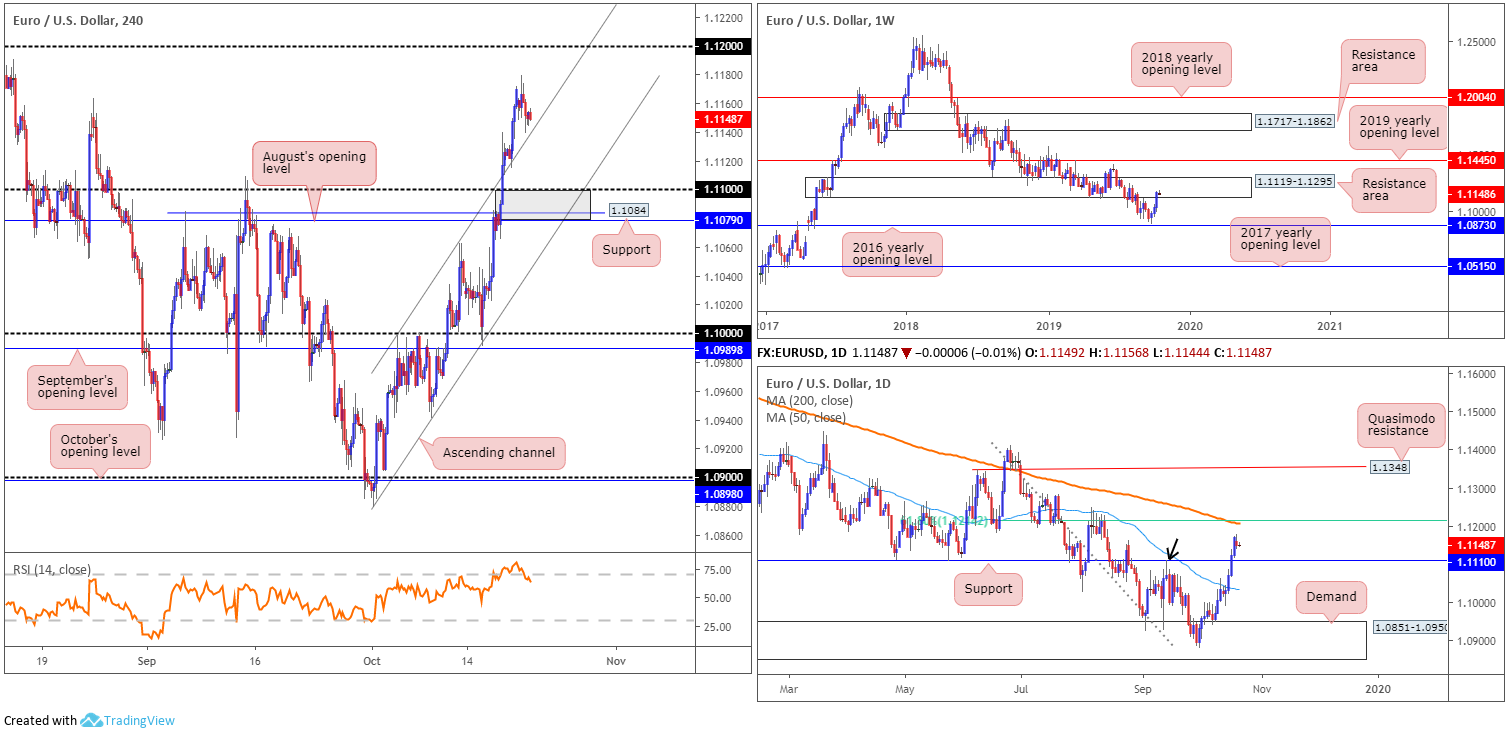
With limited macroeconomic data or central bank speakers on the slate, a quiet feel to trade was seen Monday. Europe’s shared currency clocked session highs of 1.1179 early London, though concluded a shade lower against the buck, erasing 20 points, or 0.18%.
Evidently, weekly flow remains within the walls of a resistance area coming in at 1.1119-1.1295. Concerning trend direction, the primary downtrend has been (and remains) in motion since topping in early 2018 at 1.2555. Therefore, the recent recovery ahead of the 2016 yearly opening level at 1.0873 could merely be a correction within the overall trend.
As underlined in Monday’s weekly analysis, resistance on the daily timeframe at 1.1110 gave way last Thursday and was, according to the M30 chart, retested as support shortly after. 1.1109 also marks an important swing high on the daily chart (black arrow). The breaking of this level suggests an easing of the primary trend may be on the cards. In terms of the next daily resistance points to be aware of, chart studies have the 61.8% Fibonacci retracement ratio at 1.1214 in sight, which happens to intersect with a 200-day SMA (orange – 1.1206).
H4 action retreated from multi-month peaks at 1.1179 Monday, snapping a four-day bullish phase. The day settled a touch north of a channel resistance-turned support (extended from the high 1.0999). Aside from yesterday’s high, the next point of resistance falls in around the 1.12 handle, which, according to the daily timeframe, merges closely with the 61.8% Fibonacci retracement ratio at 1.1214 and 200-day SMA. Indicator-based traders may also want to acknowledge the relative strength index (RSI) recently exited overbought terrain.
Areas of consideration:
Outlook unchanged.
With a possible trend change on the daily timeframe and a reasonably clear run to 1.12 on the H4 timeframe/the 61.8% Fibonacci resistance on the daily timeframe at 1.1214, this may be enough to entice buyers into the market towards at least 1.12. The only downside to further buying, of course, is weekly price testing its resistance area, and the overall trend.
Potential support on the H4 timeframe may develop off the H4 channel support highlighted above. Alternatively, a deeper pullback to daily support at 1.1110 might be in store. Note 1.1110 also converges closely with a H4 support area in grey between 1.1079/1.11. Despite October’s strong uptrend, nevertheless, traders are still urged to consider waiting for additional candlestick confirmation to form (entry and risk levels can be calculated based on this structure) before pulling the trigger at either of the above said supports.
GBP/USD:
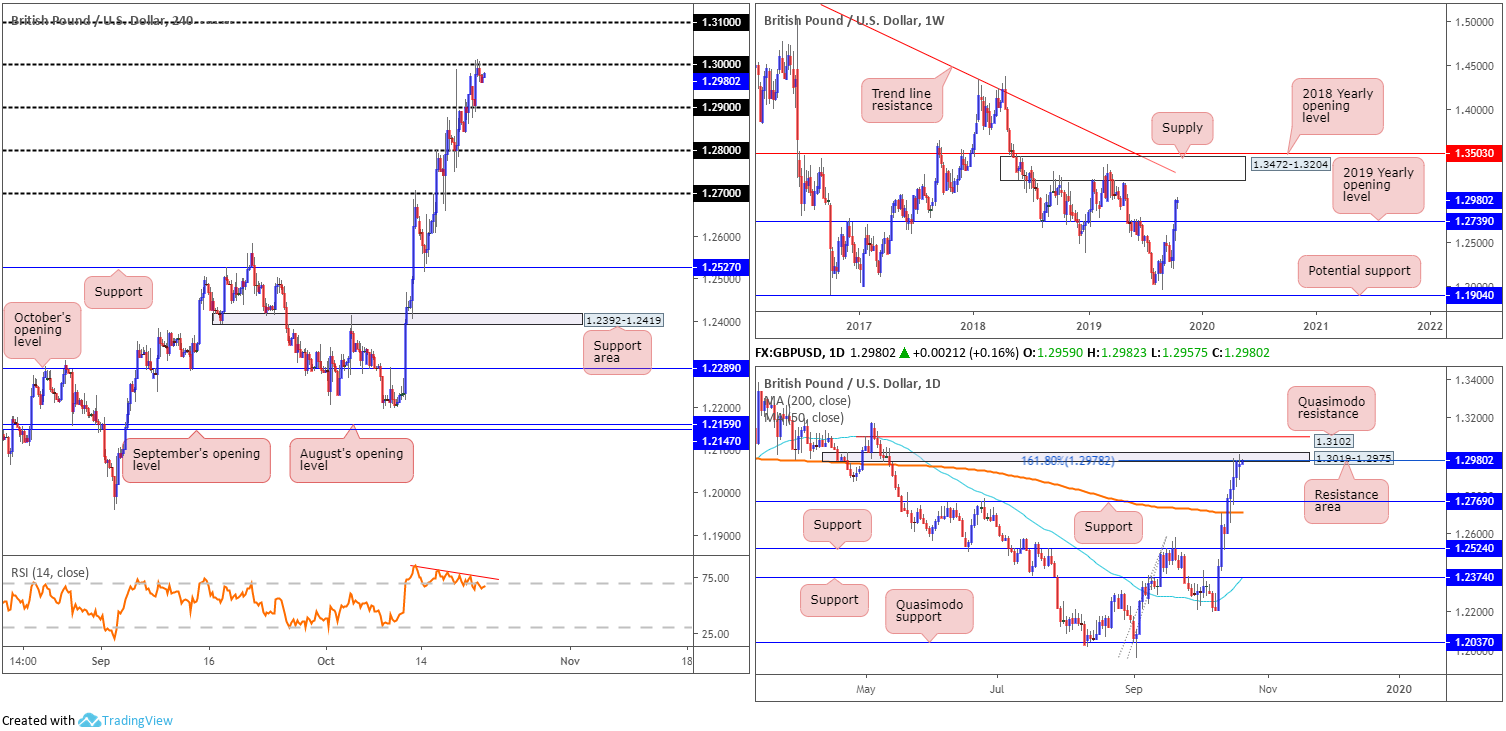
Sterling attempted to overthrow the key figure 1.30 Monday, though failed to muster enough oomph to sustain gains as further delays were put into the Brexit process.
(Bloomberg) Prime Minister Boris Johnson will find out Tuesday evening whether he has any chance of getting his Brexit deal through Parliament – and whether he can do it ahead of his Oct. 31 deadline. Having twice been denied a vote on whether members of Parliament support his deal, Johnson has introduced the Withdrawal Agreement Bill, which would implement the deal in law, and plans to push it through Parliament at a breakneck pace. His moment of truth will come at around 7 p.m. in London, with what’s known as the Second Reading vote – on whether Parliament agrees with the general principles of the bill.
From a technical standpoint, higher-timeframe flow remains unchanged from Monday’s weekly report.
Weekly focus shifted to supply at 1.3472-1.3204 and long-term trend line resistance (etched from the high 1.5930), following last week’s dominant push through the 2019 yearly opening level at 1.2739. Before reaching 1.3472-1.3204, nevertheless, a pullback to retest 1.2739 is certainly a possibility.
Interestingly, price action on the daily timeframe shook hands with a resistance area coming in at 1.3019-1.2975 in the later stages of last week, which aligns with a 161.8% Fibonacci ext. point at 1.2978 (pencilled in from the low 1.1958). Beyond 1.3019-1.2975, Quasimodo resistance at 1.3102 is visible as the next port of call. A pullback, on the other hand, could witness support at 1.2769 enter the fray, closely shadowed by the 200-day SMA (orange – 1.2713) which is currently showing signs of flattening (the 50-day SMA [blue – 1.2374] is pointing north).
Given 1.30 offered strong support through March and early April this year, active sellers recently showed interest in this psychological threshold, backed by the H4 relative strength index (RSI) displaying signs of bearish divergence within overbought territory (red line). Note 1.30 also occupies a portion of the daily resistance area highlighted above at 1.3019-1.2975.
Areas of consideration:
Although 1.30 is demonstrating signs of holding, as is its connecting daily resistance area at 1.3019-1.2975, the weekly timeframe exhibiting scope to press as far north as 1.3472-1.3204 may hamper selling. A break of 1.30, therefore, would be a strong bullish indication we’re heading for 1.31 and consumption of the current daily resistance area may then be on the cards. In this case, longs would likely be favoured, either as a simple breakout scenario (entering long at the breakout candle and positioning stops beneath the lower shadow) or a break and retest theme off 1.30, in which case traders have the option of locating entry and risk levels off the rejection candle’s structure.
With UK politics set to grab headlines, traders and investors will also be keeping a close tab on Parliamentary proceedings for fresh impulse.
AUD/USD:
Monday, despite marginally extending gains, entered a somewhat subdued phase given limited macroeconomic data or central bank speakers. Considering this, much of Tuesday’s outlook will echo thoughts put forward in Monday’s technical briefing.
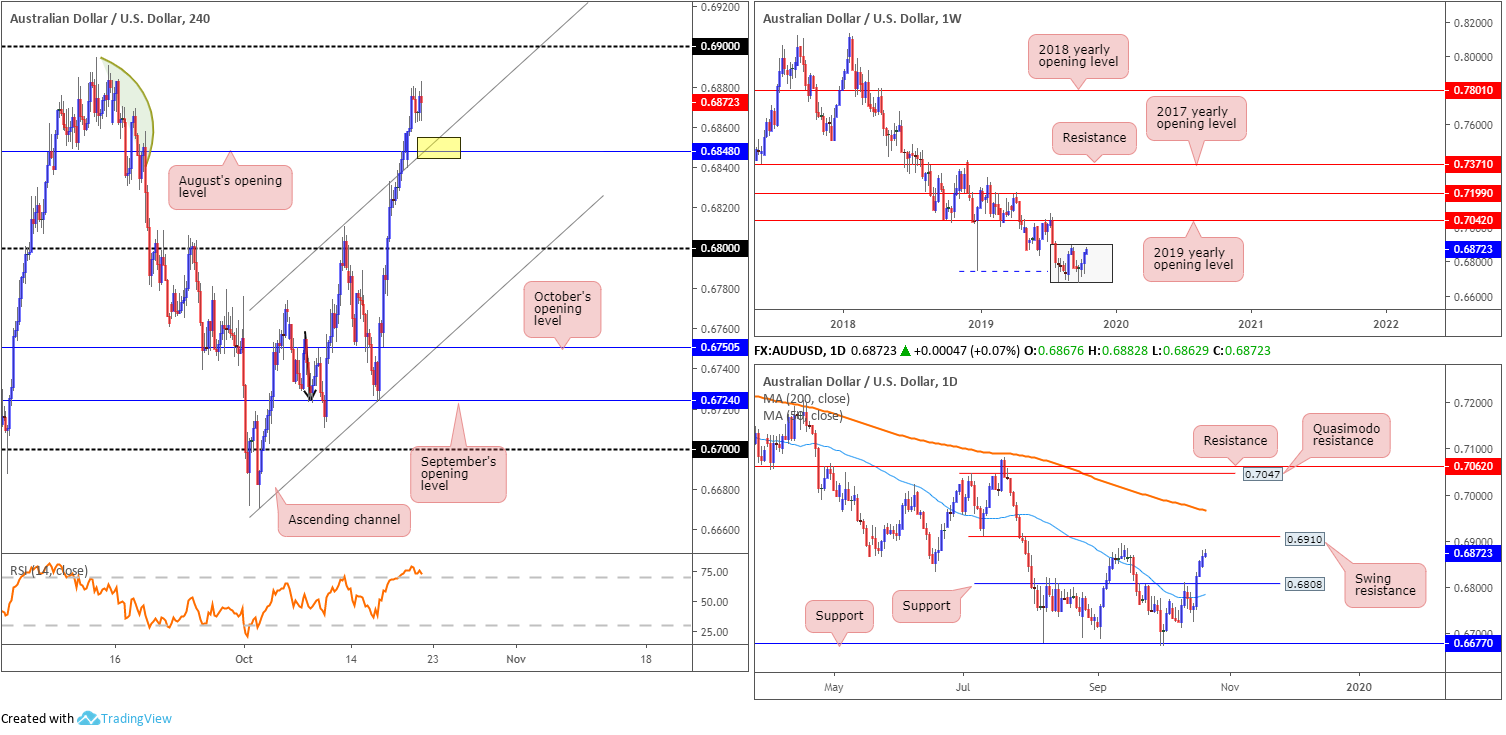
From the weekly timeframe, we can see that since engulfing 0.6744 (blue dashed) in early August, the AUD/USD has been carving a consolidation zone between 0.6894/0.6677 (grey). With the primary downtrend in play since early 2018, the current consolidation may eventually breakout to the downside, despite recent buying. A decisive push lower likely clears the runway to as far south as 0.6359 (not visible on the screen).
After dethroning resistance at 0.6808 on the daily timeframe (now acting support), battle lines going forward rest at swing resistance drawn from 0.6910, set just north of the September 12th high 0.6894. Overhead, it may also interest some traders to note the 200-day SMA (orange – 0.6966) is seen lurking nearby.
H4 movement recently engulfed channel resistance (extended from the high 0.6773) as well as August’s opening level at 0.6848. With limited supply evident to the left of current price (green), a test of 0.6894 could be in store, closely followed by the 0.69 handle.
Areas of consideration:
Outlook unchanged.
According to H4 and daily structure, additional medium-term buying could emerge. A retest at the point H4 channel support and August’s opening level at 0.6848 unite (yellow) is a possibility for potential longs. Failure here could imply a dip to daily support at 0.6808 and the 0.68 handle on the H4.
As underscored above, the 0.69ish region represents a logical upside target off 0.6848, whereas buying from 0.6808, in the event of a dip lower, 0.6848 would then be considered the initial take-profit target.
Irrespective of the support area selected, conservative traders threatened by the overall downtrend might opt to wait for additional confirmation before committing funds to a long position. This could be as simple as a bullish candlestick pattern forming, or even drilling down to the lower timeframes and attempting to trade local structure, a trend line break/retest formation, for example.
USD/JPY:
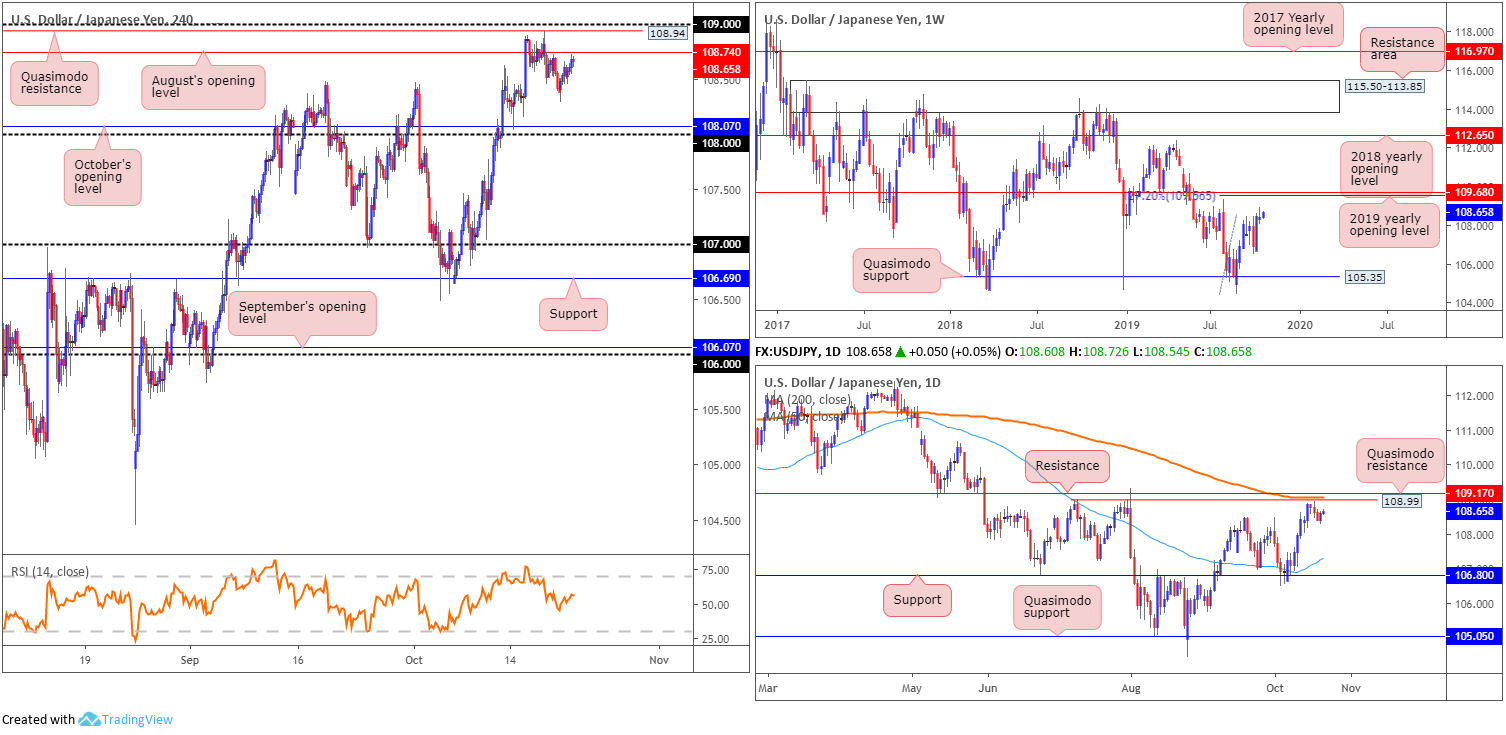
Snapping a three-day losing streak, USD/JPY action modestly recovered Monday and erased most of Friday’s losses. As can be seen from the H4 timeframe this morning, the unit concluded the session just south of August’s opening level at 108.74 on the H4 scale. A break of this level will draw Quasimodo resistance at 108.94 into the fight, along with the 109 handle. To the downside, however, we have October’s opening level at 108.07, set a few points ahead of 108.
In terms of areas to keep an eye on the weekly timeframe, Quasimodo support at 105.35 remains the next obvious downside target, while to the upside, the 2019 yearly opening level falls in as the next resistance at 109.68, merging closely with a 127.2% Fibonacci ext. point at 109.56 (taken from the low 104.44).
Daily price, on the other hand, has a collection of resistances in view between 109.17/108.99, comprised of a resistance level, the 200-day SMA (seen flattening) and a Quasimodo resistance. In the event further selling is seen, support at 106.80 is in sight, set just south of the 50-day SMA (blue – 107.19) which is currently facing north.
Areas of consideration:
Monday’s recovery reignited the possibility of a 109 test on the H4 scale. Knowing this round number comes with a H4 Quasimodo resistance level at 108.94, and a daily resistance area formed at 109.17/108.99, a selloff from 109 is certainly a possibility. Some traders may elect to simply set protective stop-loss orders above 109.17; others might require additional candlestick confirmation before committing funds, in which case the selected candlestick structure can be used to define entry/risk levels.
The accuracy, completeness and timeliness of the information contained on this site cannot be guaranteed. IC Markets does not warranty, guarantee or make any representations, or assume any liability regarding financial results based on the use of the information in the site.
News, views, opinions, recommendations and other information obtained from sources outside of www.icmarkets.com.au, used in this site are believed to be reliable, but we cannot guarantee their accuracy or completeness. All such information is subject to change at any time without notice. IC Markets assumes no responsibility for the content of any linked site.
The fact that such links may exist does not indicate approval or endorsement of any material contained on any linked site. IC Markets is not liable for any harm caused by the transmission, through accessing the services or information on this site, of a computer virus, or other computer code or programming device that might be used to access, delete, damage, disable, disrupt or otherwise impede in any manner, the operation of the site or of any user’s software, hardware, data or property.


