
Key risk events today:
German PPI m/m; Canadian Manufacturing Sales m/m.
EUR/USD:
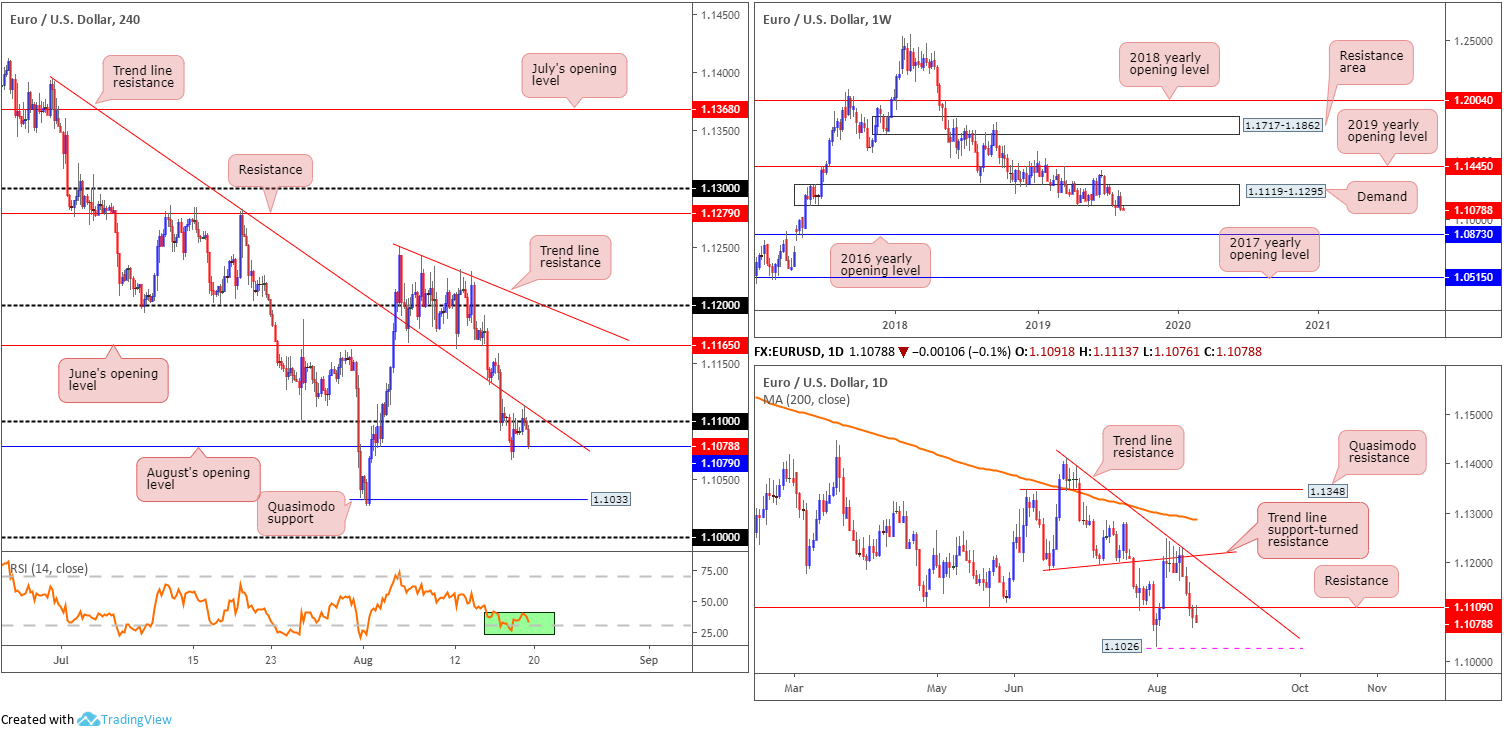
The euro was a shade lower on the dollar Monday, incapable of gathering steam above 1.11. Measured against a basket of six major currencies, the US dollar index explored higher ground, currently poised to approach 98.50. This strong-armed the EUR/USD lower from H4 trend line resistance (extended from the high 1.1393) to August’s opening level at 1.1079. Beyond here, the research team notes support at a Quasimodo formation drawn from 1.1033, closely shaded by the key figure 1.10. Indicator-based traders might also find use in noting the RSI indicator attempting to rotate from oversold territory (green).
Expanding the technical view, long-standing weekly demand at 1.1119-1.1295 had the lower edge of its base engulfed last week. Continued selling may witness the unit knock on the 2016 yearly opening level’s door at 1.0873, which houses strong historical significance. In addition to this, traders may want to acknowledge the long-term trend remains facing a southerly bearing since topping in early 2018. In conjunction with weekly movement, daily price failed to reclaim resistance at 1.1109 in recent trading. On track to register its fifth consecutive daily loss, the stage appears set for a run towards 1.1026 (the 2019 low), followed by demand (not visible on the screen) at 1.0851-1.0950.
Areas of consideration:
The pair is clearly vulnerable, with the odds of additional downside evolving. With weekly price attempting to clear out the last of any buyers in demand at 1.1119-1.1295, alongside daily price rejecting resistance at 1.1109, a H4 close beyond August’s opening level at 1.1079 could be on the cards.
Focus, therefore, shifts to a move sub 1.1079, targeting H4 Quasimodo support at 1.1033, the 2019 low at 1.1026 and then the key figure 1.10. Traders have the option of selling a H4 breakout candle with protective stop-loss orders positioned above the candlestick’s wick, whereas conservative traders may opt to wait and see if a retest develops following a close lower, and enter on the back of the rejecting candle’s structure.
GBP/USD:
UK’s pound was marginally weaker against its US counterpart Monday, failing to build on last week’s attempted recovery just north of the key figure 1.20. Meanwhile, it was confirmed UK Prime Minister Boris Johnson will visit Berlin and Paris for talks next week with Chancellor Merkel and President Macron, respectively.
Kicking the technical picture off from the top this morning, weekly structure remains unchanged:
Extracted from Monday’s weekly report:
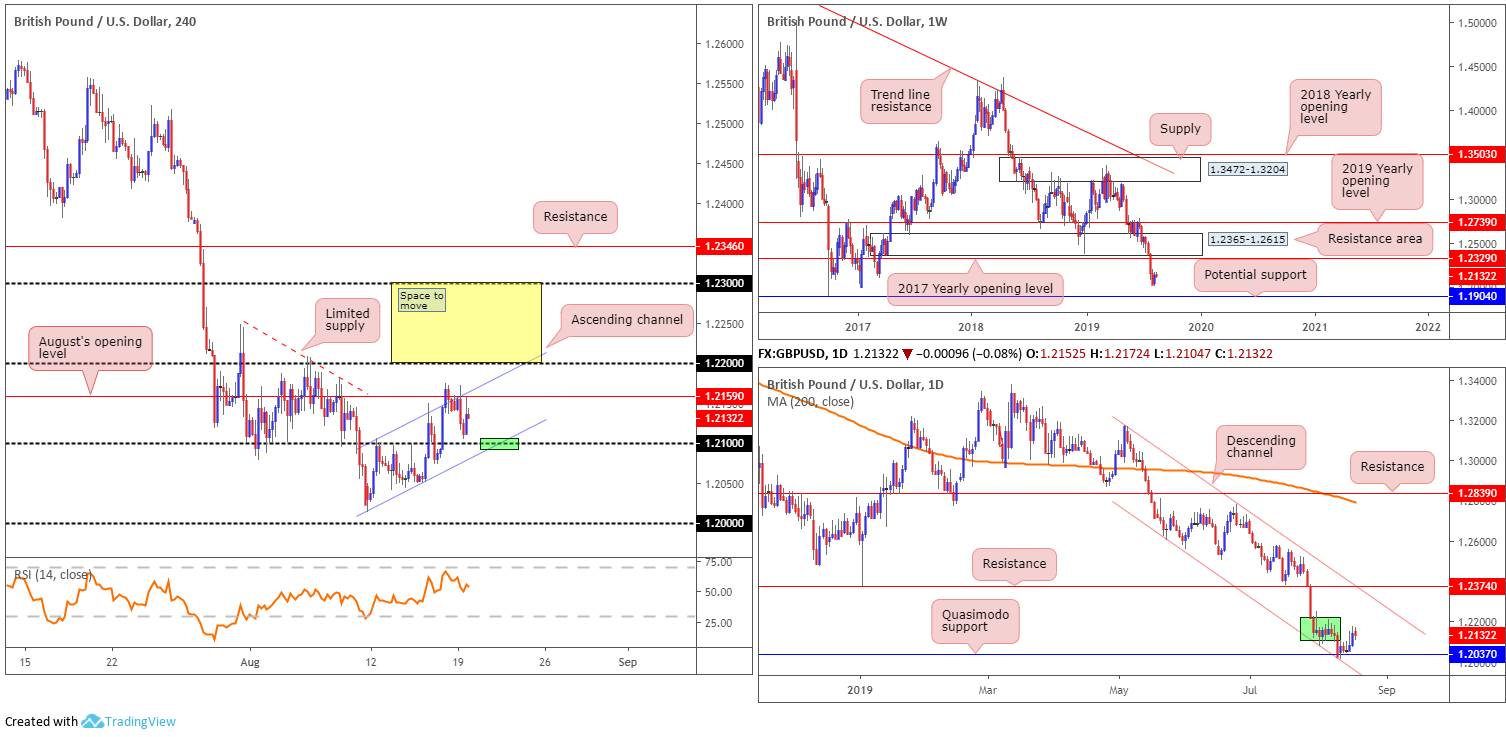
GBP/USD bulls went on the offensive last week, adding more than 115 points and snapping a four-week losing streak. For a currency that has been so beleaguered in recent months, this is a notable event. Further upside could have the unit shake hands with the 2017 yearly opening level at 1.2329 (resistance), set a couple of points south of a major resistance area at 1.2365-1.2615. Renewed selling interest, however, may lead to support entering the fold from 1.1904: a standout low clocked in early October 2016.
Elsewhere, gains built from the daily Quasimodo formation at 1.2037/channel support (taken from the low 1.2605) in the early stages of last week are in question. Although scope for additional upside is certainly plausible on the daily timeframe, with north of the page relatively free until reaching resistance at 1.2374 (aligns with channel resistance etched from the high 1.3176), traders must contend with a local block of supply shaded in green around the 1.2150ish area.
A closer reading of price action on the H4 timeframe has the candles languishing below August’s opening level at 1.2159/channel resistance taken from the high 1.2106. The 1.21 handle maintains a strong position as the next viable support, serving well as support/resistance over the past couple of weeks. The research team also favours the point (green) channel support (extended from the low 1.2014) merges with the round number. Above 1.2159, aside from 1.22 potentially offering resistance, limited supply is visible until 1.23. Therefore, a H4 close above 1.22 is certainly something to keep an eye out for.
Areas of consideration:
Owing to the lacklustre performance yesterday, the outlook remains unchanged:
A H4 close above 1.22 delivers an opportunity to enter long, targeting 1.23 as the initial take-profit zone, closely followed by the 2017 yearly opening level on the weekly timeframe at 1.2329 and then H4 resistance at 1.2346. Depending on risk appetite, traders have the option of entering long on the breakout candle (with a protective stop-loss order positioned beneath the tail) or conservatively waiting for a possible retest motion to occur (black arrows) before pulling the trigger, preferably in the form of a H4 bullish candlestick signal (entry and risk can then be set according to this structure).
In the event we dip lower, the point 1.21/channel support merge on the H4 timeframe is also an area active buyers likely reside, with the first upside objective set at 1.2159. Owing to psychological numbers often falling victim to stop runs (fakeouts), traders are urged to consider waiting for additional candlestick confirmation before committing funds.
AUD/USD:
Subsiding 0.15% vs. the buck, the Australian dollar remains pretty much unchanged regarding technical structure. With that being the case, much of the following analysis will echo thoughts aired from Monday’s weekly briefing.
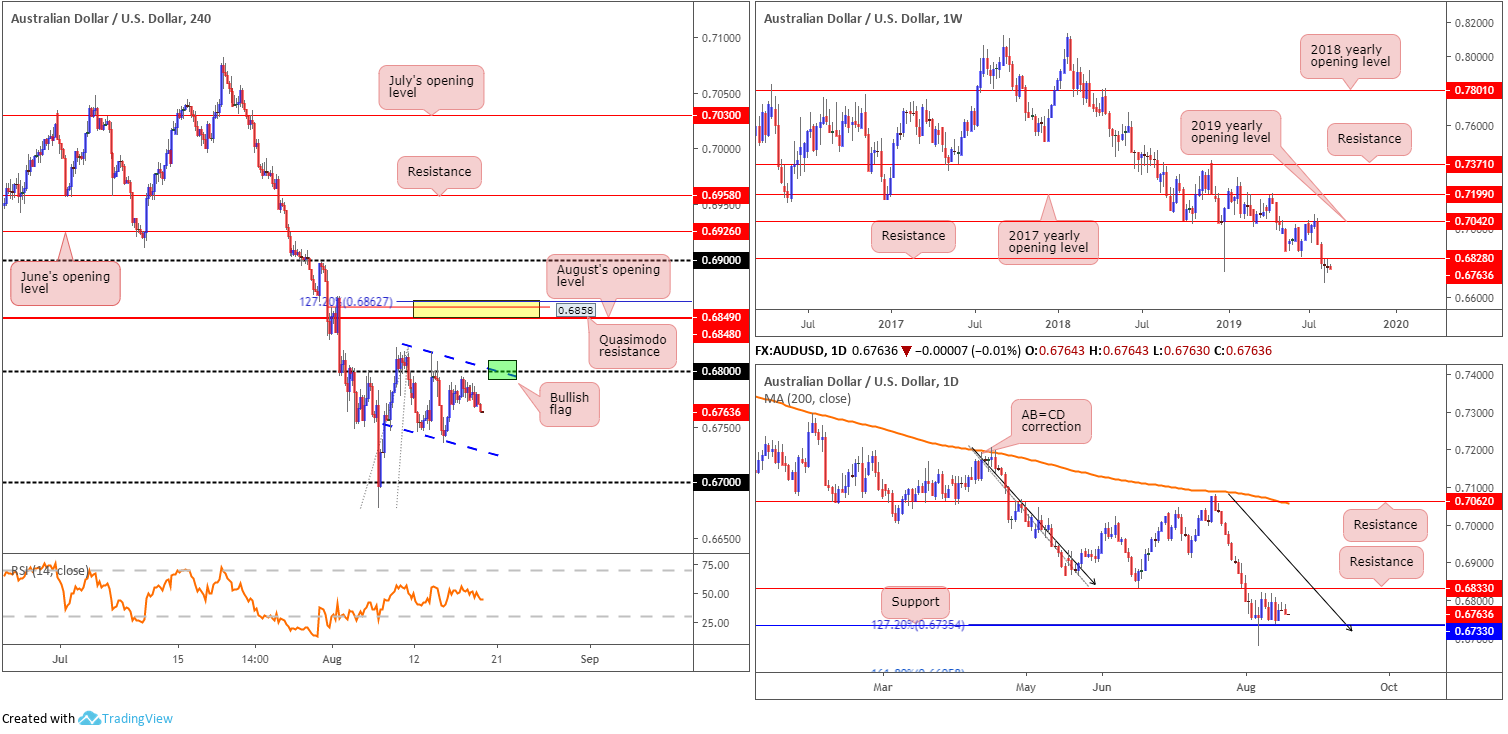
The weekly timeframe has its candles languishing beneath resistance at 0.6828, organised as two back-to-back indecision candles. The long-term downtrend, intact since the beginning of 2018, remains unbroken, with further selling towards support at 0.6395 being a real possibility (not seen on the screen).
Meanwhile, on the daily timeframe, since elbowing beneath weekly support mentioned above at 0.6828, support at 0.6733 on the daily timeframe, along with a 127.2% AB=CD (black arrows) formation at 0.6735, entered the fray and held things higher. Despite this, the pair remains deeply in bearish territory and may not have the firepower to cross swords with resistance at 0.6833 (June 18 low).
Analysing the H4 candles, gains have been contained by 0.68 since August 9, while compressing within a bullish flag formation (0.6817/0.6745). Flags typically slope in the opposite direction from the trend, which is clearly not the case here but may still form part of a correction. Beyond 0.68, a tight area of resistance (yellow) resides between a 127.2% Fibonacci ext. point at 0.6862, a Quasimodo resistance at 0.6858 and August’s opening level at 0.6848.
Areas of consideration:
Although the target for the bullish flag configuration will come in much higher, overlooking H4 resistance at 0.6862/0.6848 is chancy. Further to this, though, between 0.68 and the aforesaid H4 resistance zone, traders must contend with not only daily resistance at 0.6833, but also weekly resistance at 0.6828.
On account of the above, the research team feel longs above the current H4 flag formation/0.68 are dicey. Excessive resistance from all three timeframes analysed will likely hamper any upside attempt. With this taken on board, two sell zones remain in view:
- The point the upper limit of the H4 channel flag merges with 0.68 may prompt a selloff (green). With higher-timeframe structure positioned nearby, though, which could promote a fakeout above 0.68, waiting for additional candlestick confirmation to form before entering a trade is recommended (entry and risk parameters can be set according to the selected candlestick formation).
- The yellow H4 area of resistance between 0.6827/0.6848. Granted, while this zone is a touch above higher timeframe-resistance, a fakeout above these levels to the said H4 zone is a strong possibility. Entry at 0.6848 is, therefore, valid, with a tight protective stop-loss order plotted above 0.6862, but if you prefer waiting for additional confirmation, a bearish candlestick pattern would suffice.
USD/JPY:
Monday had the US dollar moderately higher versus the Japanese yen, up 0.28% at the close of trade. A constructive risk tone, attributed to optimism after the Huawei license extension, lifted the USD/JPY higher for a third consecutive session.
Technically, however, we remain unmoved and, therefore, a large portion of the following analysis will air vibes put forward in Monday’s weekly report.
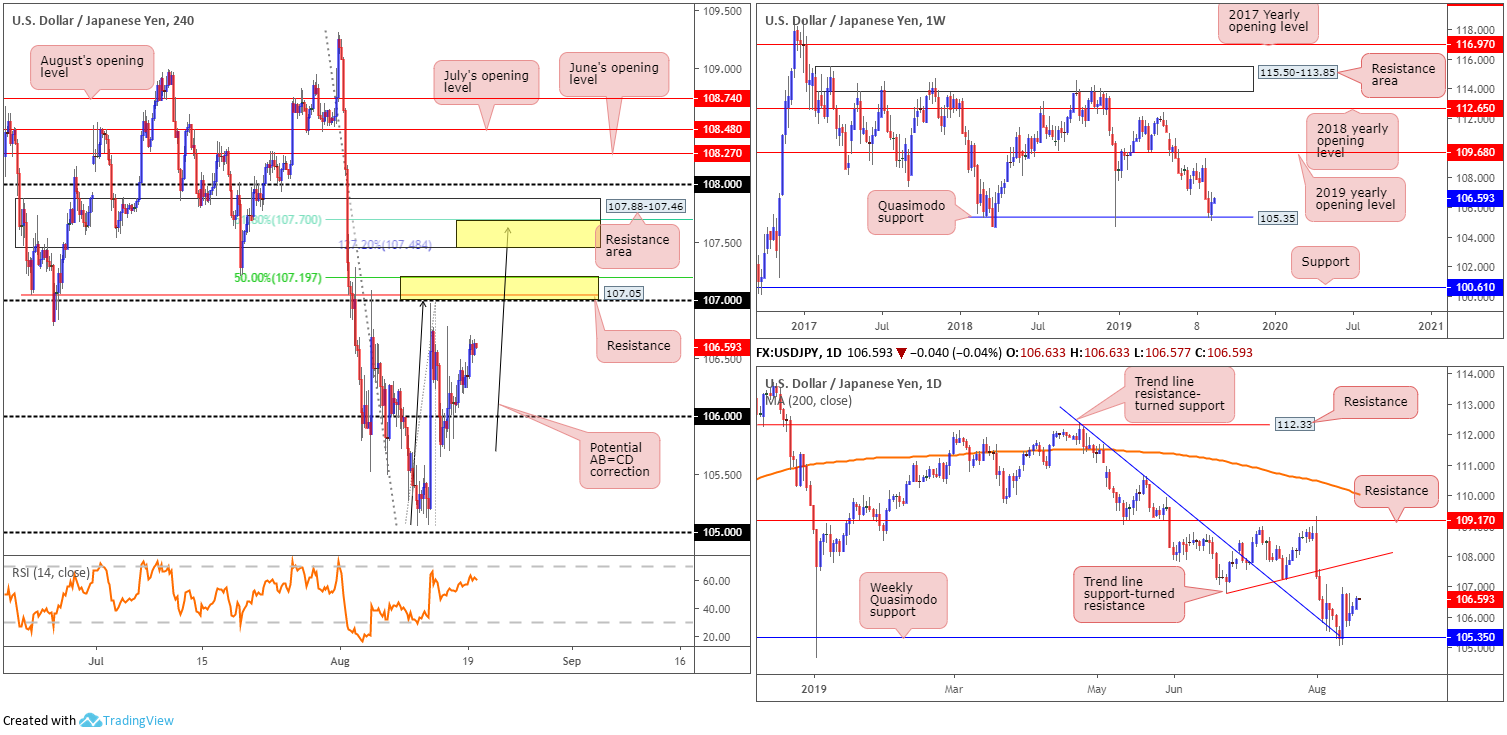
Weekly Quasimodo support at 105.35 – a level that already proved its worth by holding the unit higher at the beginning of the year – contained losses last week, encouraging a run higher that snapped a two-week losing streak. Outside of this base, limited support is evident until 100.61, whereas a push north has the 2019 yearly opening level at 109.68 to target.
In tandem with the weekly Quasimodo support, daily trend line resistance-turned support (extended from the high 112.40) also entered the mix last week. The convergence of these two higher-timeframe levels witnessed a strong recovery take shape Tuesday last week. This foundation supports further buying, according to the technical studies, at least until we reach trend line support-turned resistance (etched from the low 106.78).
Monday’s session saw the pair settle at 106.63, establishing a firm floor above 106. Overhead, resistance resides at 107.19/107, comprised of a 50.0% retracement value at 107.19, a resistance level at 107.05 and the round number 107 (lower yellow zone). Above here, we also have another area of resistance formed at 107.88-107.46, with specific emphasis on the 107.70/107.48 region (upper yellow zone), comprised of a 61.8% Fibonacci retracement value at 107.70 and an AB=CD (black arrows) 127.2% Fibonacci extension at 107.48.
Areas of consideration:
While the lower yellow H4 zone at 107.19/107 could contain price action today, the research team feels the area holding the ‘juice’ in this market is 107.88-107.46, given it merges closely with the daily trend line support-turned resistance. A short from the upper yellow zone held within at 107.70/107.48, therefore, is an ideal location to seek shorting opportunities, should we press this high.
USD/CAD:
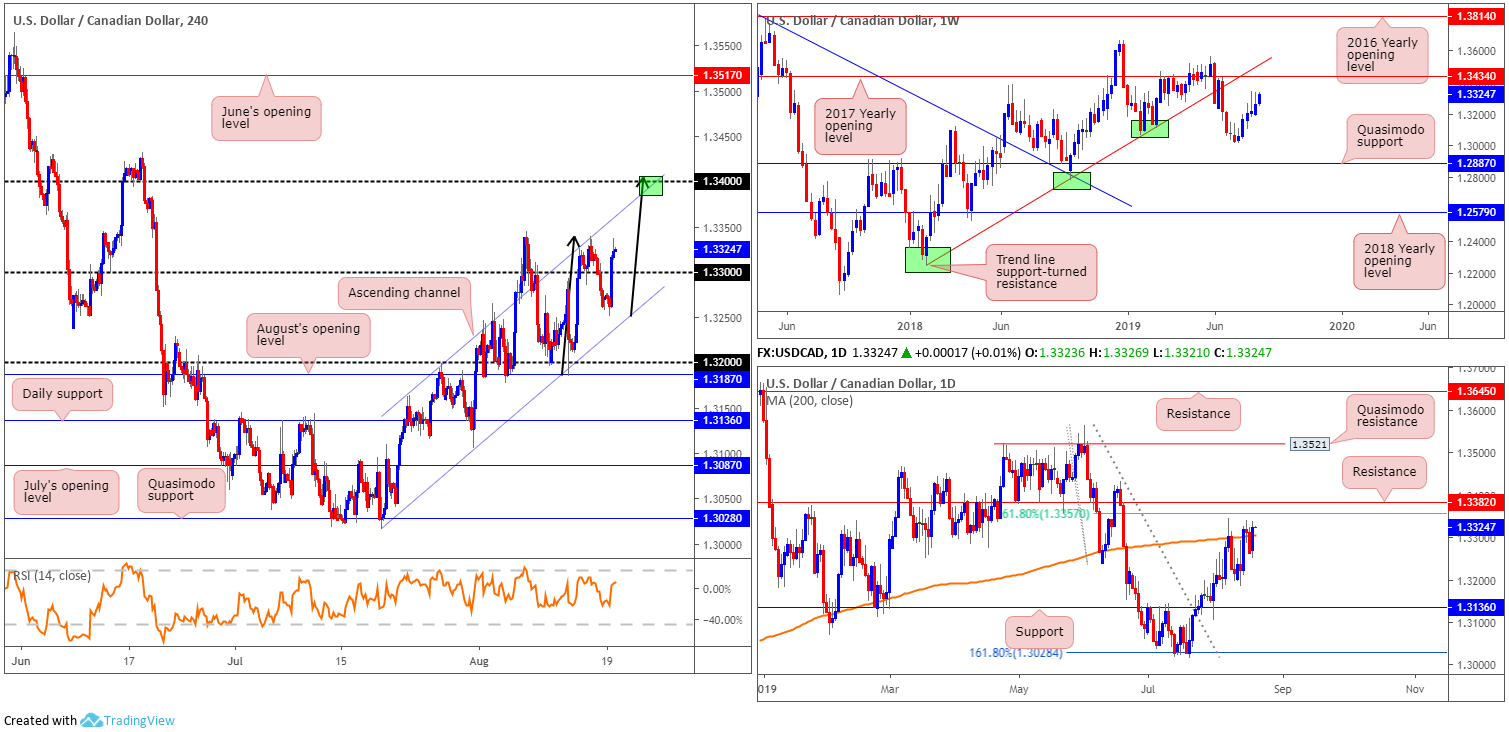
Broad-based US dollar bidding reinforced USD/CAD buying Monday, hauling the market beyond the 1.33 handle to highs at 1.3337. Gains were likely limited due to WTI rallying more than 2.00%, though recent moves potentially unlocked the door to H4 channel resistance etched from the high 1.3186, and possibly 1.34. What’s also notable from a technical perspective is a possible ABCD correction (black arrows) forming that terminates a shade above 1.34.
Focus on the weekly timeframe remains to the upside. Since bottoming at 1.3018 in the form of an inverted hammer pattern, the pair has been steadily grinding higher. Last week’s movement, as evident from the chart, clocked highs of 1.3339. Continued buying from this point has the 2017 yearly opening level at 1.3434 in sight, closely shadowed by trend line support-turned resistance etched from the low 1.2247.
A closer reading of price action on the daily timeframe reveals the 200-day SMA (currently circulating around 1.3305) gave way yesterday, unbolting upside towards resistance drawn from 1.3382 and a closely converging 61.8% resistance at 1.3357.
Areas of consideration:
Daily resistance at 1.3382 houses strong historical significance, and will likely hold price action lower if approached. Whether the rejection will inspire additional selling is difficult to interpret, due to the possibility of a run towards the 2017 yearly opening level at 1.3434.
In regards to the H4 timeframe, the point 1.34 and the channel resistance merge (green) will likely entice active selling, with the expectation of daily price ending the session back beneath resistance at 1.3382. For that reason, between 1.34 and daily resistance at 1.3382 is a particularly interesting sell zone. Since round numbers are prone to fakeouts, nevertheless, traders are urged to wait and see if H4 action prints a H4 bearish candlestick signal before trading the zone.
USD/CHF:
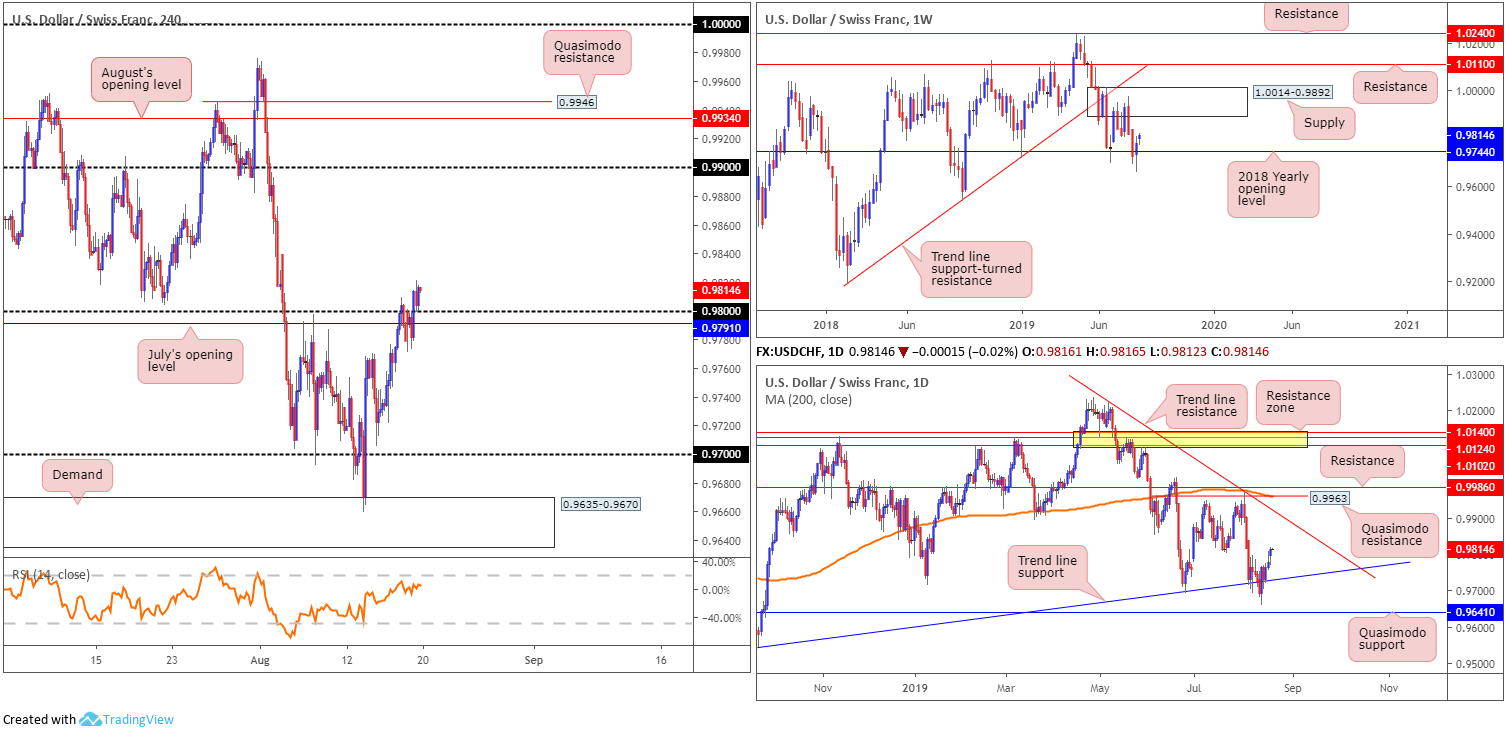
Demand for the safe-haven Swiss franc diminished Monday as the US dollar went on to clock its third consecutive daily gain. Up 0.38%, recent bidding lifted the H4 candles above 0.98, which, shortly after, was retested in the shape of a strong bullish candle. According to the H4 timeframe, further upside from this point is a possibility towards the 0.99 neighbourhood.
This is further supported on the higher timeframes, with weekly price establishing firm ground above the 2018 yearly opening level at 0.9744 and poised to approach supply coming in at 1.0014-0.9892. Further to this, traders may want to acknowledge daily price stands in good stead off trend line support etched from the low 0.9542, with the possibility of further upside materialising to a trend line resistance extended from the high 1.0226, closely shadowed by another layer of resistance between 0.9986/0.9963 (comprised of resistance at 0.9986, the 200-day SMA [orange] and Quasimodo resistance at 0.9963)
Areas of consideration:
Keeping things simple this morning, a long at current price is an option with a protective stop-loss order plotted below July’s opening level at 0.9791. The first upside target can be found at 0.9892 (the underside of weekly supply), followed by the 0.99 handle on the H4 timeframe.
Dow Jones Industrial Average:
Major US equity indexes climbed Monday amid hopes of global economic stimulus. Encouraging comments from President Donald Trump on trade talks as well as China lowering borrowing costs for companies witnessed the Dow Jones Industrial Average dethrone 26000. The Dow added 249.78 points, or 0.96%; the S&P 500 also added 34.97 points, or 1.21% and the Nasdaq advanced 115.21 points, or 1.52%.
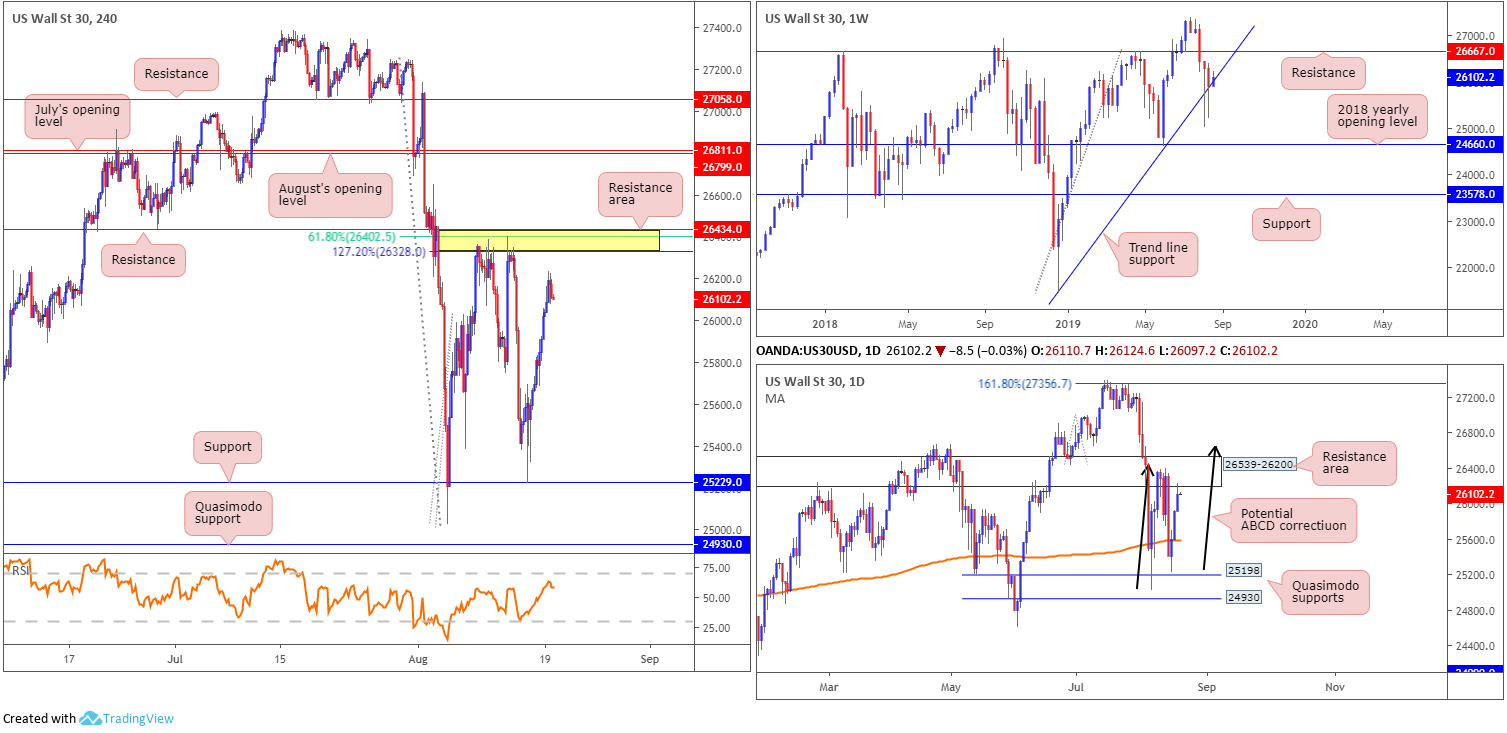
From a technical standpoint, however, buyers appear fragile on the weekly timeframe, struggling to gain a foothold around trend line support extended from the low 21452. A move higher from here has resistance at 26667 in view, whereas a break southbound could sink to depths not visited since early June 2019 at the 2018 yearly opening level drawn from 24660.
Price action on the daily timeframe is currently bounded by a Quasimodo support coming in at 25198 and a resistance area forged at 26539-26200, which, as you can see, entered the mix yesterday. What’s notable is the said resistance zone is sited just south of weekly resistance underlined above at 26667, which happens to fuse closely with a daily ABCD correction (black arrows).
Between resistance at 26434, a 127.2% Fibonacci ext. point at 26328 and a 61.8% Fibonacci retracement value at 26402, this zone, 26434/26328, held price action lower at the beginning of last week and on Wednesday. It is also worth noting the current daily resistance area merges with the said H4 area.
Areas of consideration:
Having seen H4 price approaching its resistance zone at 26434/26328, and knowing it converges with the daily resistance area, a sell from here, once again, could be of interest to some traders. While there’s a chance weekly price may make a play for resistance at 26667, the odds of a reaction being seen from the H4 resistance is strong, though positioning protective stop-loss orders beyond the daily resistance zone is recommended. This simply adds another layer of protection from a whipsaw through the narrow H4 resistance area. As for downside targets, limited support is in view until 25229 on the H4 timeframe, closely trailed by the daily Quasimodo support at 25198.
XAU/USD (GOLD):
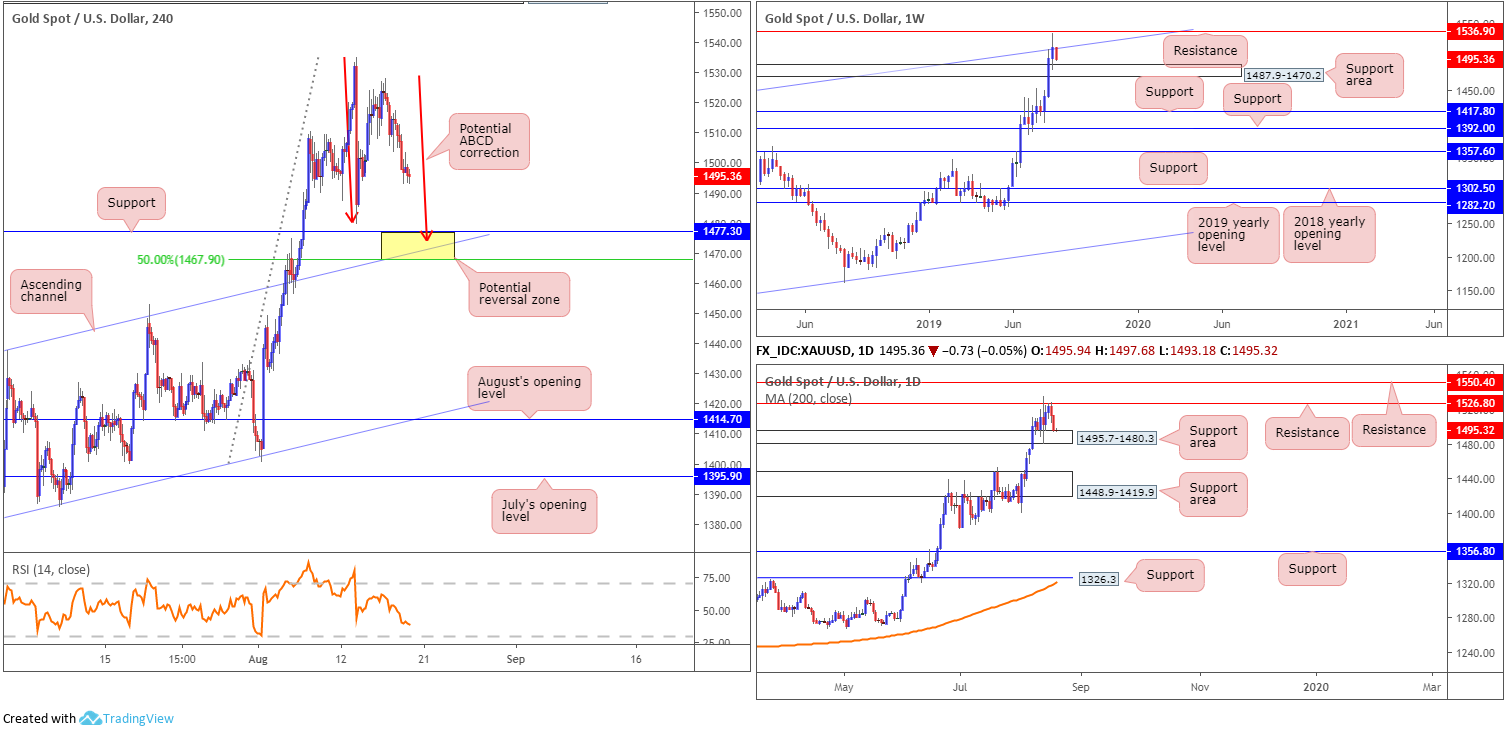
Bullion ceded further ground to its US counterpart Monday, down 1.13%. In reaction to a stronger dollar across the board, the yellow metal is visibly inching towards a potential reversal zone on the H4 timeframe at 1467.9/1477.3. Comprised (yellow) of a potential ABCD correction at 1473.8 (red arrows), a channel resistance-turned support extended from the high 1437.7 and a 50.0% retracement ratio at 1467.9, 1467.9/1477.3 stands a good chance of holding price action higher if tested. In addition, it might also be worth noting the H4 support area is sited around the lower edge of a weekly support area at 1487.9-1470.2, though is positioned outside of the borders of a daily support area at 1495.7-1480.3, which happened to enter the fray yesterday.
The higher timeframes has weekly price exhibiting a selloff beneath channel resistance pencilled in from the high 1375.1, targeting the support area mentioned above at 1487.9-1470.2. The daily timeframe, as highlighted above, has a support area in the mix at 1495.7-1480.3, after meeting strong selling from long-term support-turned resistance at 1526.8.
Areas of consideration:
Outlook unchanged:
Entry at 1477.3 is an option at the H4 support area, with a protective stop-loss order placed at 1465.2. Traders wanting to add a little more confirmation may opt to wait and see if H4 price chalks up a candlestick signal before committing funds to the market. That way, buyer intent is visible, as well as having a base (the candlestick structure) to set entry and risk levels.
In terms of initial upside targets, the research team suggests considering the 38.2%/61.8% Fibonacci retracements of the A-D legs, once the ABCD formation completes.
The accuracy, completeness and timeliness of the information contained on this site cannot be guaranteed. IC Markets does not warranty, guarantee or make any representations, or assume any liability regarding financial results based on the use of the information in the site.
News, views, opinions, recommendations and other information obtained from sources outside of www.icmarkets.com.au, used in this site are believed to be reliable, but we cannot guarantee their accuracy or completeness. All such information is subject to change at any time without notice. IC Markets assumes no responsibility for the content of any linked site.
The fact that such links may exist does not indicate approval or endorsement of any material contained on any linked site. IC Markets is not liable for any harm caused by the transmission, through accessing the services or information on this site, of a computer virus, or other computer code or programming device that might be used to access, delete, damage, disable, disrupt or otherwise impede in any manner, the operation of the site or of any user’s software, hardware, data or property.


