Key risk events today:
RBA Cash Rate and Rate Statement; UK Final Manufacturing PMI; Canada GDP m/m; Fed Chair Powell Testifies; US ISM Manufacturing PMI; ECB President Lagarde Speaks.
(Previous analysis as well as outside sources – italics).
EUR/USD:
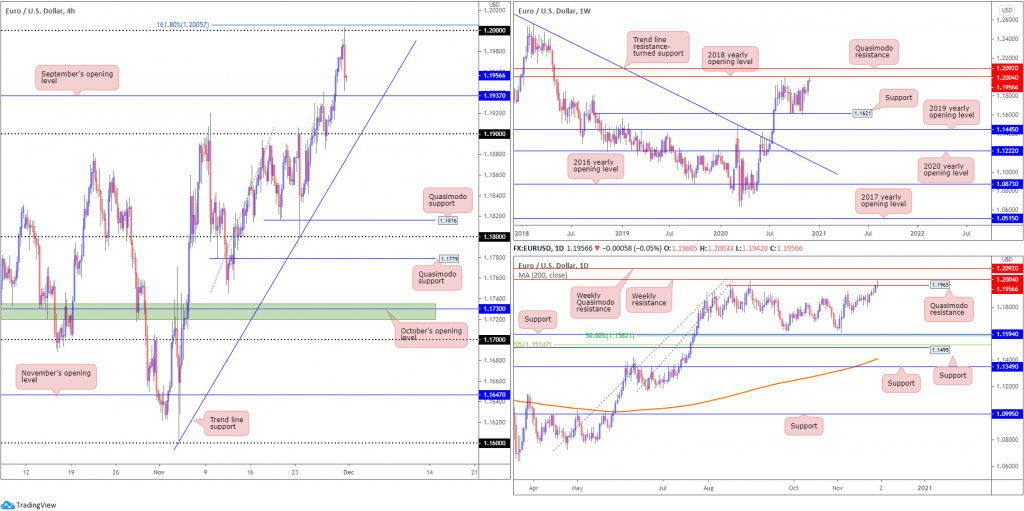
Despite the DXY gliding to fresh YTD troughs at 91.50, the index finished Monday substantially off worst levels. This coincided with EUR/USD also reaching for fresh YTD highs. However, EUR/USD technicals show price also shook hands with the 2018 yearly opening value at 1.2004 on the weekly timeframe, in addition to daily price testing Quasimodo resistance at 1.1965 and the H4 scale connecting with the key figure 1.20 (sited beneath a 161.8% Fibonacci projection point at 1.2005).
EUR/USD, as you can see, sailed lower from 1.20 in strong form, with the pair currently hovering just north of September’s opening value at 1.1937. A break below here could move 1.19 into play along with trend line support, taken from the low 1.1602.
Areas of consideration:
- Although the trend (see weekly timeframe) points to higher prices, weekly and daily timeframes are seen fading resistances at 1.2004 and 1.1965, respectively.
- Although September’s opening value on the H4 at 1.1937 signifies possible support, traders might want to take into account this level is in a vulnerable position after having noted higher timeframe resistances.
- Intraday bearish themes on the H4 could emerge south of 1.1937, targeting 1.19 and H4 trend line support.
GBP/USD:
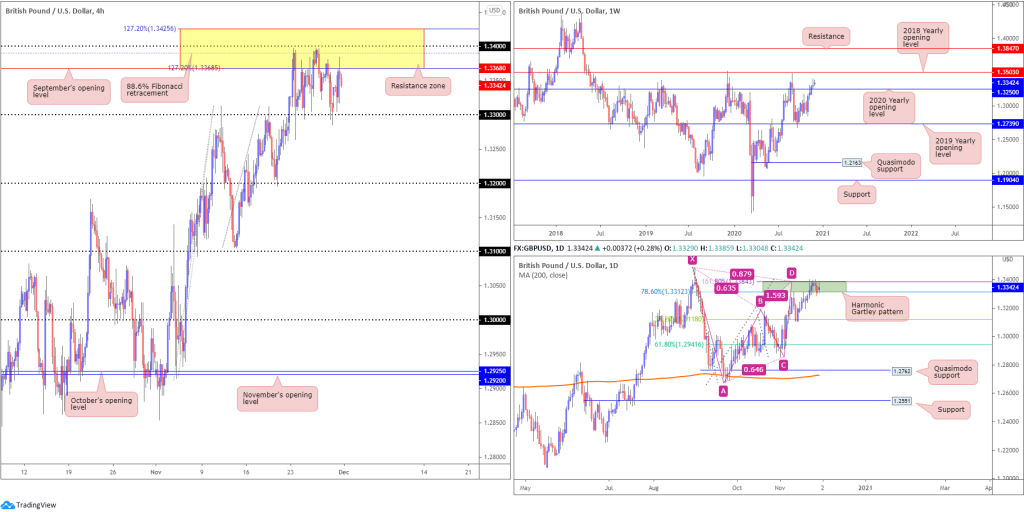
Since the beginning of last week, H4 has been busy carving out a consolidation between resistance (yellow) at 1.3425/1.3368 (made up of two 127.2% Fibonacci projection points at 1.3425/1.3368, the round number 1.34, an 88.6% Fibonacci retracement ratio at 1.3390 and September’s opening value at 1.3368) and the 1.33 handle. Should sellers work through 1.33 bids, the 1.32 handle is visible, whereas a push through 1.3425 targets 1.3483, September’s high.
Buyers on the weekly scale remain above the 2020 yearly opening value at 1.3250, with further buying to draw in the 2018 yearly opening value at 1.3503. The technical picture on the daily timeframe has price feeling its way around a bearish harmonic Gartley pattern’s PRZ at 1.3384/1.3312. Should sellers emerge, the 38.2% Fibonacci retracement ratio at 1.3118 is lying in wait (arranged from legs A-D of the Gartley), while overthrowing the aforementioned PRZ could be viewed as an early cue we’re headed for the 2018 yearly opening value at 1.3503 on the weekly scale.
Areas of consideration:
- Lower timeframe range traders may find use in noting the H4 consolidation forming between 3425/1.3368 and the 1.33 handle.
- Below 1.33 clears room for a possible bearish approach towards weekly support at 1.3250 (2020 yearly opening value) and then the 1.32 handle.
- Above 1.3425 unlocks a potential bullish theme to September’s high at 1.3483, the 1.35 handle and weekly resistance at 1.3503.
AUD/USD:
The Australian dollar kicked off the week lower against the US dollar, guided by a DXY recovery off YTD troughs.
Technical resistance visible on AUD/USD charts, however, is quite something:
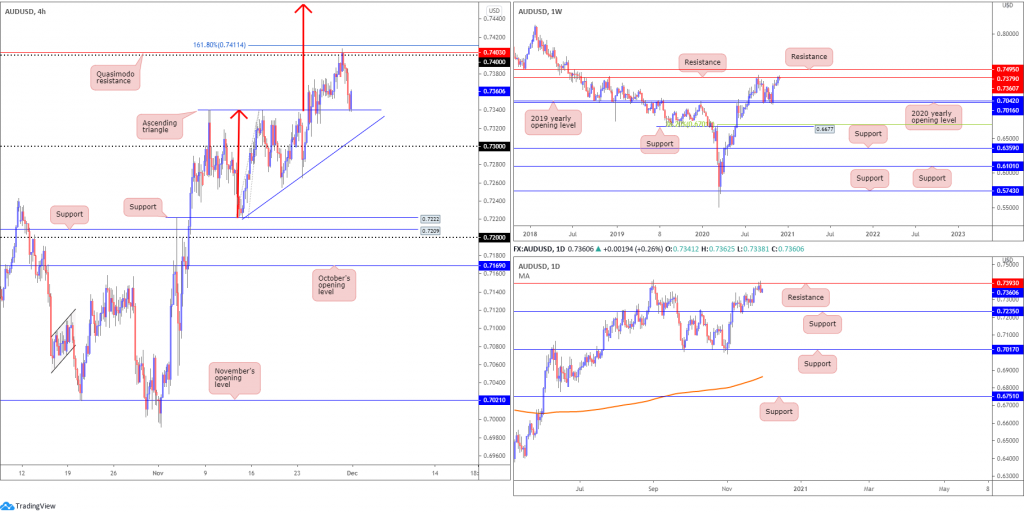
- The weekly timeframe shows resistance in play at 0.7379, active following a strong showing off the 2020 (0.7016) and 2019 (0.7042) yearly opening values (supports) in early November. In view of this market trending higher since early 2020, buyers may also be eyeballing resistance parked at 0.7495.
- Following November 13 retest of support at 0.7235, buyers eventually found some grip and crossed swords with resistance at 0.7393 on Friday (positioned above weekly resistance) and stirred sellers Monday. This represents a level that has capped upside since December 2018. Clearance of this base fuels the prospect of a rally to weekly resistance mentioned above at 0.7495.
- Recent action breached the top side of a H4 ascending triangle pattern (0.7340), leading to a test of the 74 handle, as well as Quasimodo resistance at 0.7403 and the 161.8% Fibonacci projection point at 0.7411.
Areas of consideration:
- The reaction from 0.7400 on the H4 has brought forth a possible retest of the recently broken ascending triangle resistance at 0.7340, which may be enough to generate bullish interest. However, buyers from here, despite a clear uptrend, are likely to be cautious having seen higher timeframe resistances recently enter the fold (0.7379 [weekly] 0.7393 [daily]).
- Pushing through 0.7340 could signal a 0.73 test today (H4).
USD/JPY:
Monday’s risk-averse tone witnessed the US dollar index correct from YTD troughs. Profit taking and the usual month-end flows also appear to have bolstered the buck.
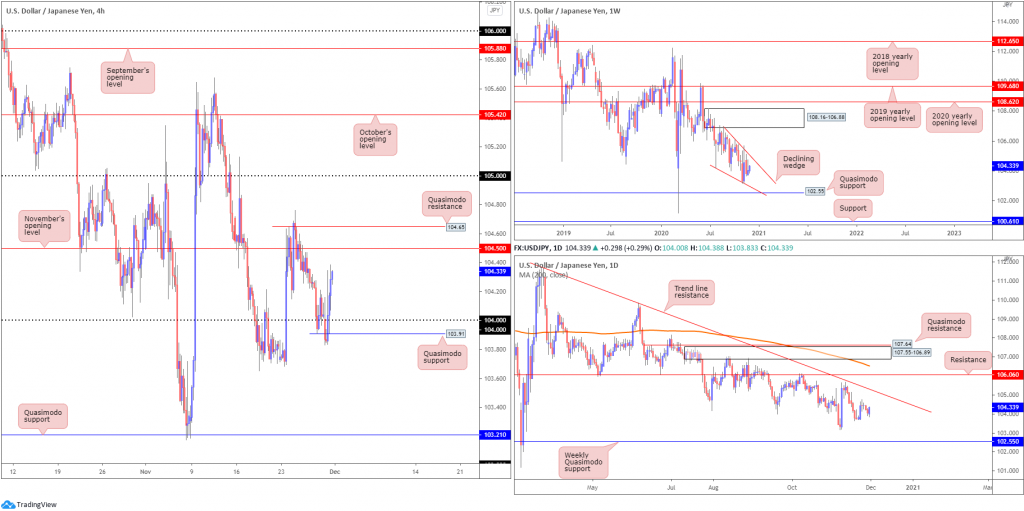
USD/JPY reacted positively, reclaiming 104+ status and shining the spotlight on November’s opening value at 104.50 on the H4 timeframe, followed by Quasimodo resistance plotted at 104.65. Note also there’s a reasonably clear runway visible north of 104.65 towards the 105 region.
From the weekly timeframe (unchanged – italics):
Since connecting with the underside of supply at 108.16-106.88 in August, price has gradually shifted lower and developed a declining wedge (106.94/104.18).
Quasimodo support at 102.55 is in the picture this week, with a break revealing support plotted at 100.61. A strong bounce from 102.55 may provide enough impetus for buyers to attempt a breakout above the current declining wedge.
Daily timeframe (unchanged – italics):
The technical landscape from the daily timeframe reveals scope to close in on trend line resistance, extended from the high 111.71.
Sellers taking over, though, could lead price to the 103.17 November 6 low, followed by the noted weekly Quasimodo support at 102.55.
Areas of consideration:
- H4 Quasimodo resistance at 104.65 and November’s opening value at 104.50 offers an area of possible resistance to work with. The lack of higher timeframe confluence here, however, may trigger a cautious bearish tone.
- Newly formed Quasimodo support at 103.91 on the H4 is also noteworthy, posted just under the 104 handle. However, this area also lacks a higher timeframe connection.
USD/CAD:
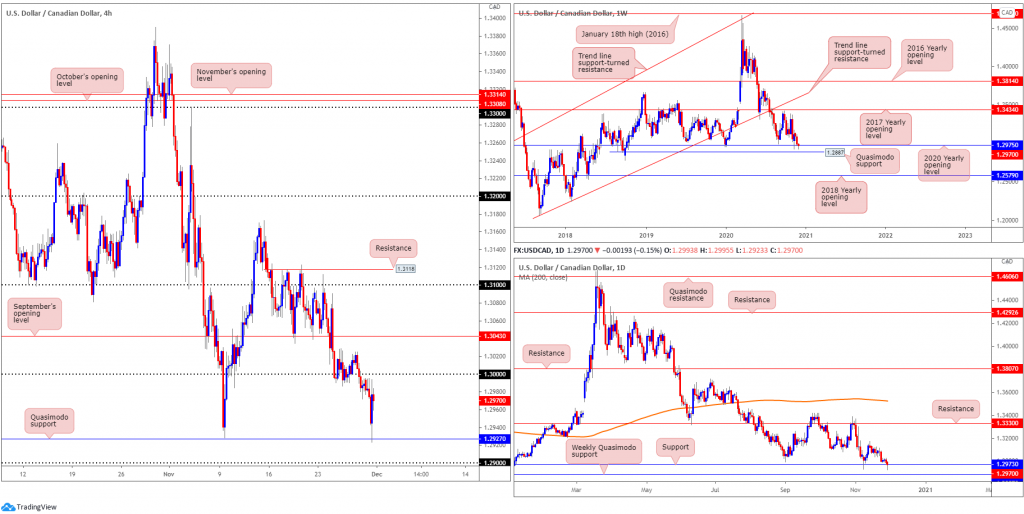
The US dollar, alongside the US dollar index, recovered strongly against its Canadian counterpart heading into US hours on Monday. Bolstered by technical buying off H4 Quasimodo support at 1.2927, the key figure 1.30 may offer resistance. A break above here, however, throws September’s opening value at 1.3043 into the mix.
Higher up on the curve, weekly price remains flirting with the 2020 yearly opening value at 1.2975, arranged north of Quasimodo support priced in at 1.2887. Breaking 1.2975, nevertheless, remains an option. Not only did the 1.2975 bullish rejection in early November fail to attract follow-through interest, this market has traded lower since topping at 1.4667 in early 2020. So, while buyers could still make an appearance, technical evidence favours a dip to Quasimodo support at 1.2887, according to chart structure.
With weekly price channelling into support at 1.2975, as well as daily price also recently joining support at 1.2973 (essentially marking the same area), an approach to the 1.3172 November 13 peak is possible on the daily scale. Lack of bids off 1.2973, on the other hand, shines the spotlight on weekly Quasimodo support mentioned above at 1.2887.
Areas of consideration:
- Many intraday participants are likely to seek bearish themes off the 1.30 level on the H4. While sellers may attempt to make a stand, traders are urged to pencil in the possibility of another upside attempt off higher timeframe supports.
- As a result, removing 1.30 resistance could trigger a wave of intraday interest to the upside, targeting September’s opening value from 1.3043.
USD/CHF:
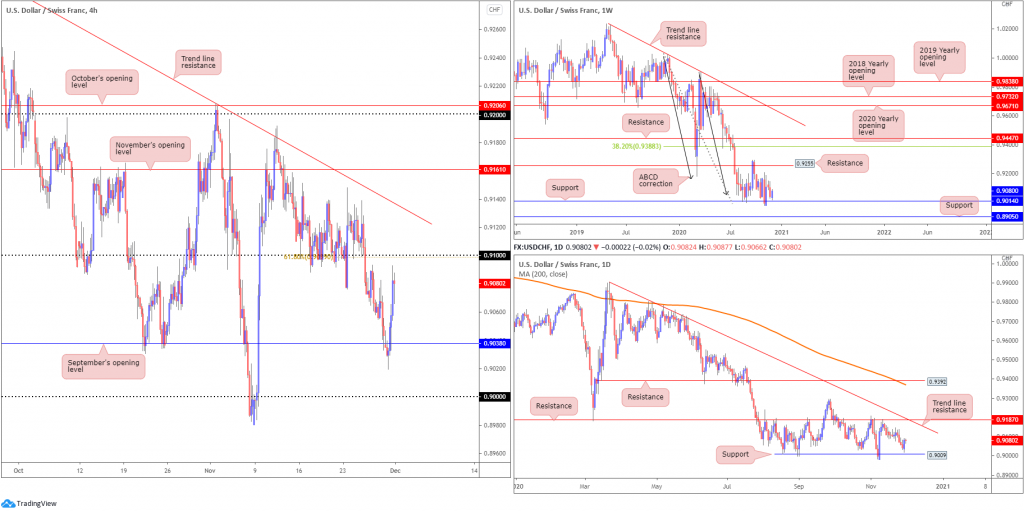
USD/CHF chalked up a strong bullish picture on Monday, reinforced on the back of healthy USD upside across the board. Despite a fleeting push to lows at 0.9019, H4 reclaimed September’s opening value at 0.9038 and is poised to approach the 0.91 handle (and a 61.8% Fibonacci retracement ratio at 0.9099), with a break exposing trend line resistance, taken from the high 0.9296.
From the weekly timeframe, buyers are showing some interest north of support at 0.9014 (dovetailing closely with ABCD support at 0.9051 [black arrows]). Additional energy to the upside points towards 0.9255 resistance (a prior Quasimodo support). Clearance of 0.9014 exposes support at 0.8905. It should also be noted this market has been trending lower since April 2019.
Daily movement, on the other hand, chalked up a bullish engulfing pattern on Monday as buyers found their feet ahead of support at 0.9009. Snapping a four-day bearish phase, further upside could see trend line resistance, taken from the high 0.9901, and resistance at 0.9187, make an appearance.
Areas of consideration:
- 91 serves as immediate resistance to be aware of on the H4 scale. Although a key figure, and reinforced by a 61.8% Fibonacci retracement ratio, the daily bullish engulfing candle could spark bullish interest today and overrun 0.91.
- Breakout buying scenarios north of 0.91 (H4), targeting trend line resistance, taken from the high 0.9296, and possibly November’s opening value at 0.9161.
Dow Jones Industrial Average:
US equities moderately corrected Monday following a sizzling month-long rally. The Dow Jones Industrial Average shed 271.73 points, or 0.91%; the S&P 500 traded lower by 16.72 points, or 0.46% and the Nasdaq finished lower by 7.11 points, or 0.06%.
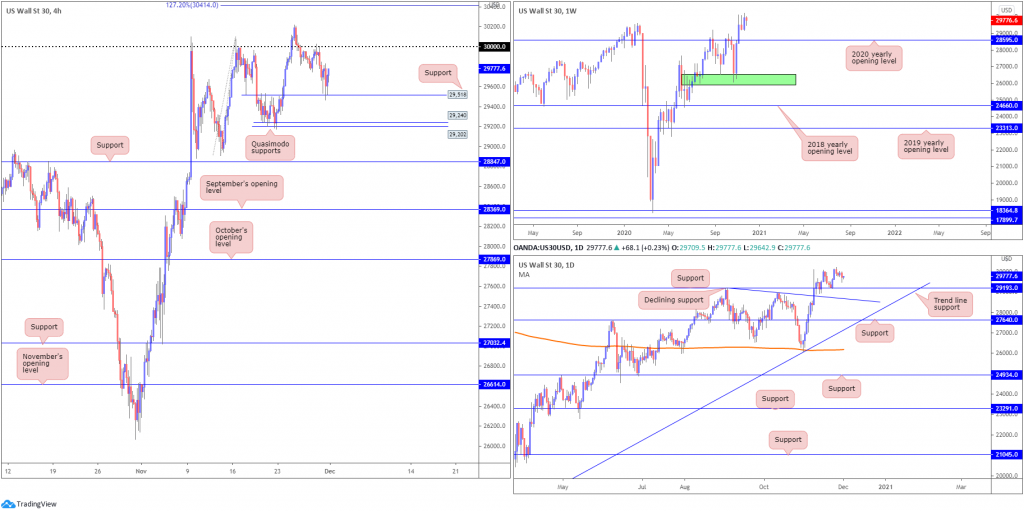
The widely watched 30,000 figure on the H4 was, as you can see, retested as resistance heading into the close last week, with sellers entering strongly on Monday. Consequently, support entered play at 29,518 and held, with Quasimodo supports at 29,202 and 29,240 lying in wait should a break lower arise.
The weekly timeframe remains lingering around all-time peaks at 30,217. In the event a correction materialises, the 2020 yearly opening value from 28595 could be an area dip-buyers find interest in. According to the daily timeframe, however, support is seen at 29,193, positioned above a declining support, taken from the high 29,193 (merges closely with 28595 on the weekly scale).
Areas of consideration:
- Having recently witnessed fresh all-time highs, dip-buyers may extend gains off H4 support at 29,518. Failure to respond, nonetheless, focus will likely shift to H4 Quasimodo supports at 29,202 and 29,240.
- Crossing back above 30,000 may also ignite breakout strategies.
XAU/USD (GOLD):
The DXY modestly recovering into the close Monday, as you can see, weighed on the precious metal.
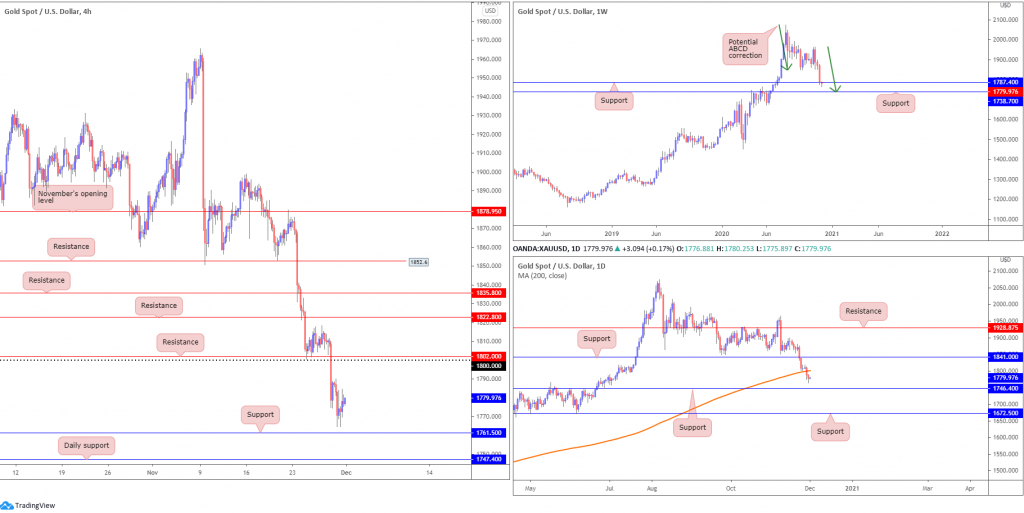
Weekly support at $1,787 is under pressure, throwing $1,738 into the mix as possible support and a potential ABCD correction (green arrows). Adding to the bearish narrative, daily price crossed below its 200-day SMA (orange – $1,800) on Friday and shined the headlights on support coming in at $1,746.
Across the page on the H4 scale, price movement discovered interest ahead of support from $1,761. $1,800 and resistance at $1,802 are also levels in view on this chart.
Areas of consideration:
- $1,800 and H4 resistance at $1,802, together with the 200-day SMA at $1,800, shapes relatively healthy resistance to keep a close eye on.
- Weekly support at $1,738 is another noteworthy horizontal base, likely to gather additional interest on the back of the weekly ABCD correction and daily support priced in at $1,746.
The accuracy, completeness and timeliness of the information contained on this site cannot be guaranteed. IC Markets does not warranty, guarantee or make any representations, or assume any liability regarding financial results based on the use of the information in the site.
News, views, opinions, recommendations and other information obtained from sources outside of www.icmarkets.com.au, used in this site are believed to be reliable, but we cannot guarantee their accuracy or completeness. All such information is subject to change at any time without notice. IC Markets assumes no responsibility for the content of any linked site.
The fact that such links may exist does not indicate approval or endorsement of any material contained on any linked site. IC Markets is not liable for any harm caused by the transmission, through accessing the services or information on this site, of a computer virus, or other computer code or programming device that might be used to access, delete, damage, disable, disrupt or otherwise impede in any manner, the operation of the site or of any user’s software, hardware, data or property
