
Key risk events today:
RBA Monetary Policy Meeting Minutes; BoJ Monetary Policy Statement and Press Conference; UK Employment Data; US Core Retail Sales m/m and Retail Sales m/m; Fed Chair Powell Testifies.
(Previous analysis as well as outside sources – italics).
EUR/USD:
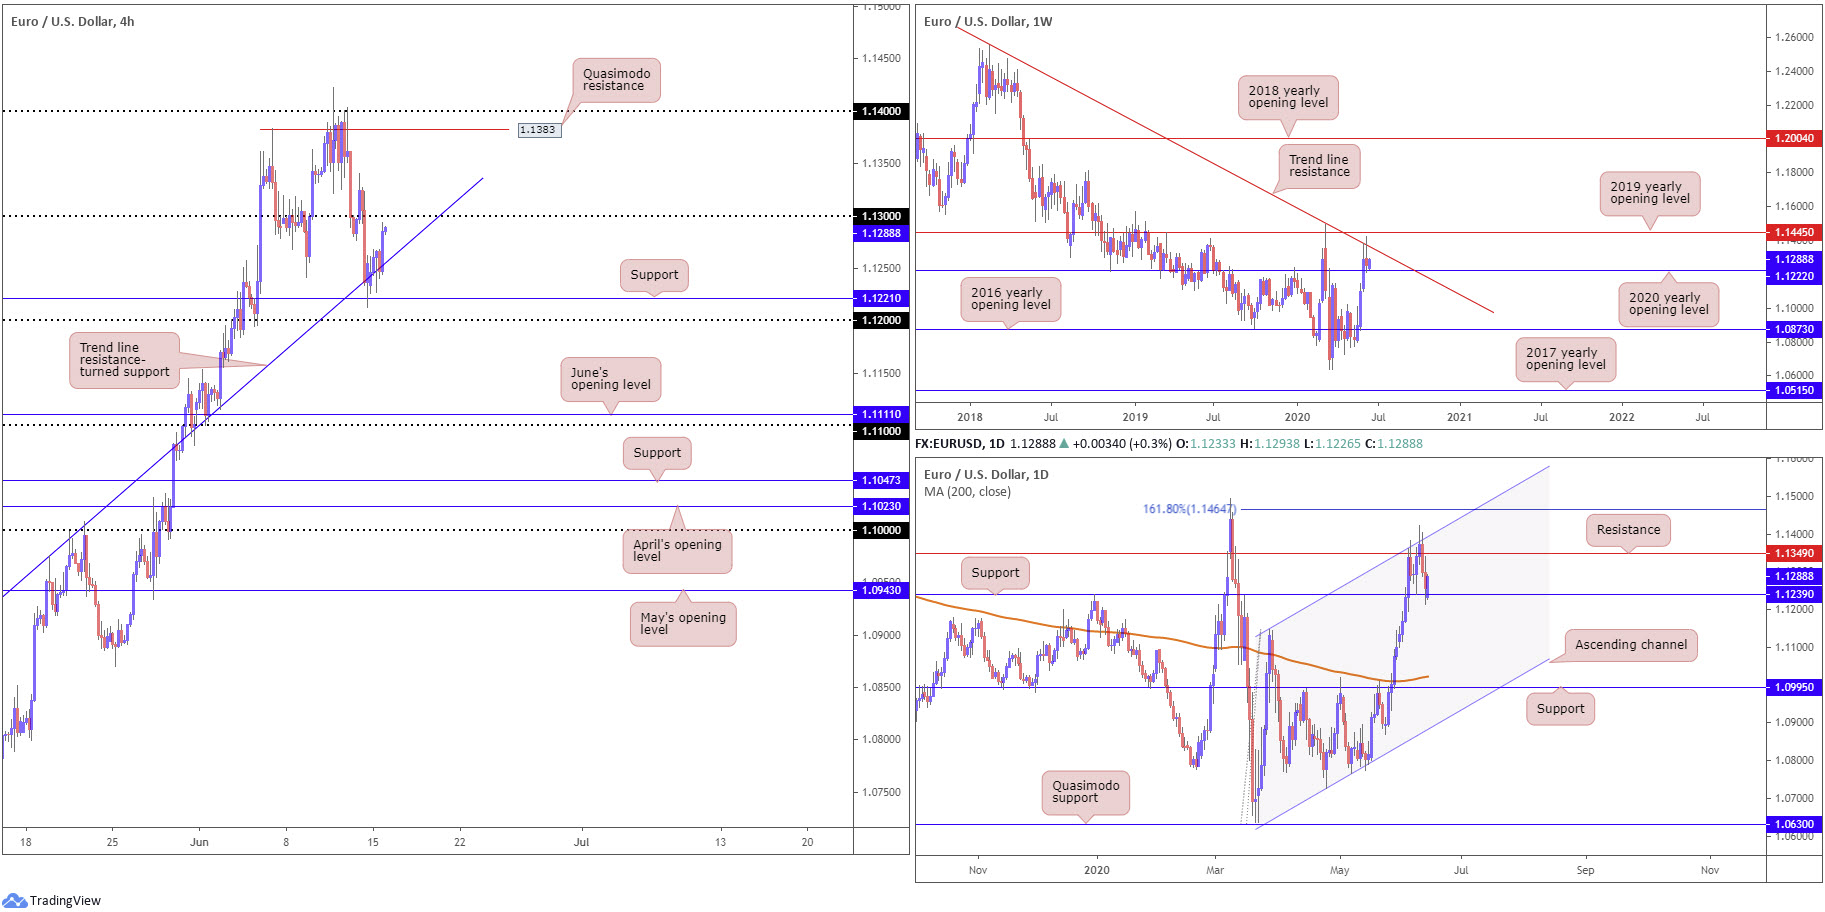
The US dollar, represented by the US dollar index, switched gears Monday and turned lower, consequently snapping a two day-bullish phase. On the EUR/USD front, H4 support at 1.1221 (a prior Quasimodo resistance), maintained its presence, bolstered by H4 trend line support, taken from the low 1.0727. This may invite an approach to 1.13 in upcoming trade, with a break potentially steering price to H4 Quasimodo resistance at 1.1383.
Further afield, weekly price is currently supported by the 2020 yearly opening level at 1.1222, despite facing rejection off long-standing trend line resistance, extended from the high 1.2555. Continued bidding could override the aforementioned trend line resistance for the 2019 yearly opening level at 1.1445. In view of the long-term trend, the pair has remained under pressure since topping in early February 2018.
Hefty resistance also emerged on the daily timeframe last week at 1.1349, a level converging closely with channel resistance, taken from the high 1.1147. Friday took the currency pair to daily support at 1.1239, a level that held firmly into Monday’s close. A break of this support would be quite significant, perhaps exposing downside to the 200-day SMA (orange – 1.1022), which is on the point of turning higher after drifting south for several months.
Areas of consideration:
Weekly and daily support at 1.1222 and 1.1239 holding ground is likely to make H4 sellers off 1.13 nervous. A break through the round number would, therefore, likely be viewed as a bullish signal with daily resistance at 1.1349 set as the initial upside target, closely tied with the current weekly trend line resistance. Territory above here may have price seek H4 Quasimodo resistance at 1.1383.
Conservative traders will look for at least a retest at 1.13 to form as support, following a break higher. A retest formed in the shape of a H1/H4 bullish candlestick signal would also be appealing.
GBP/USD:
For traders who read Monday’s technical briefing you may recall the following (italics):
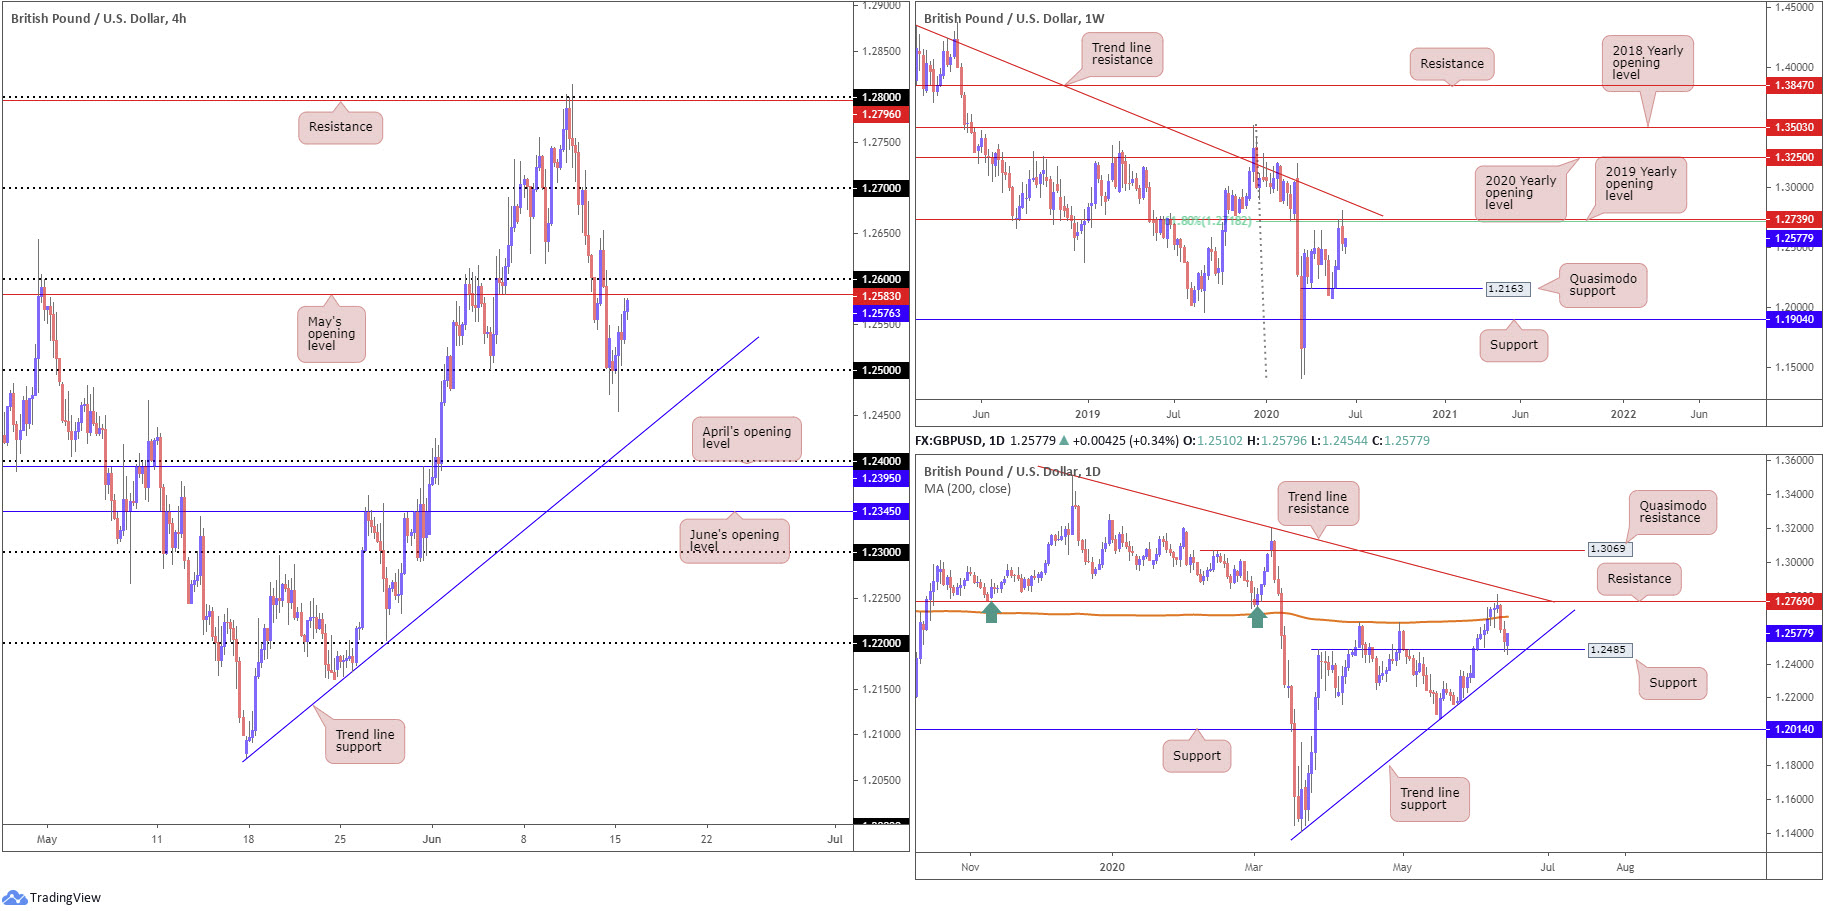
With H4 mildly surpassing 1.25, albeit holding by the close, and daily price bringing in daily support at 1.2485, a fakeout scenario (running stops under 1.25) likely occurred. This could generate additional buyer interest early week back to 1.26ish.
As evident from the chart, further upside occurred north of 1.25 on the H4 timeframe Monday, poised to grapple with May’s opening level at 1.2583, closely followed by the 1.26 handle. Extending gains north of the aforementioned structure is also a possibility, having seen the 200-day SMA (orange – 1.2679) set as the next upside target on the daily timeframe.
The problem with the above is weekly price (italics – taken from Monday’s technical briefing):
Snapping a three-week bullish phase, healthy selling developed from the 61.8% Fibonacci retracement ratio at 1.2718 and 2019 yearly opening level at 1.2739 in recent movement. It should also be emphasised these levels are positioned beneath a long-term trend line resistance, extended from the high 1.5930.
Increased selling this week, in line with the overall trend, throws Quasimodo support at 1.2163 in the pot as a feasible downside target on this timeframe.
Areas of consideration:
According to the overall technical picture, weekly price may hinder upside attempts above 1.26 on the H4 timeframe today. In view of this, hitting 1.26/1.2583 will likely have H4 buyers off 1.25 liquidate a large portion of their positions, leaving only a small percentage to run in case we do break 1.26 and head for the 200-day SMA.
On account of the above, bearish strategies formed around 1.26 may also appeal.
USD/JPY:
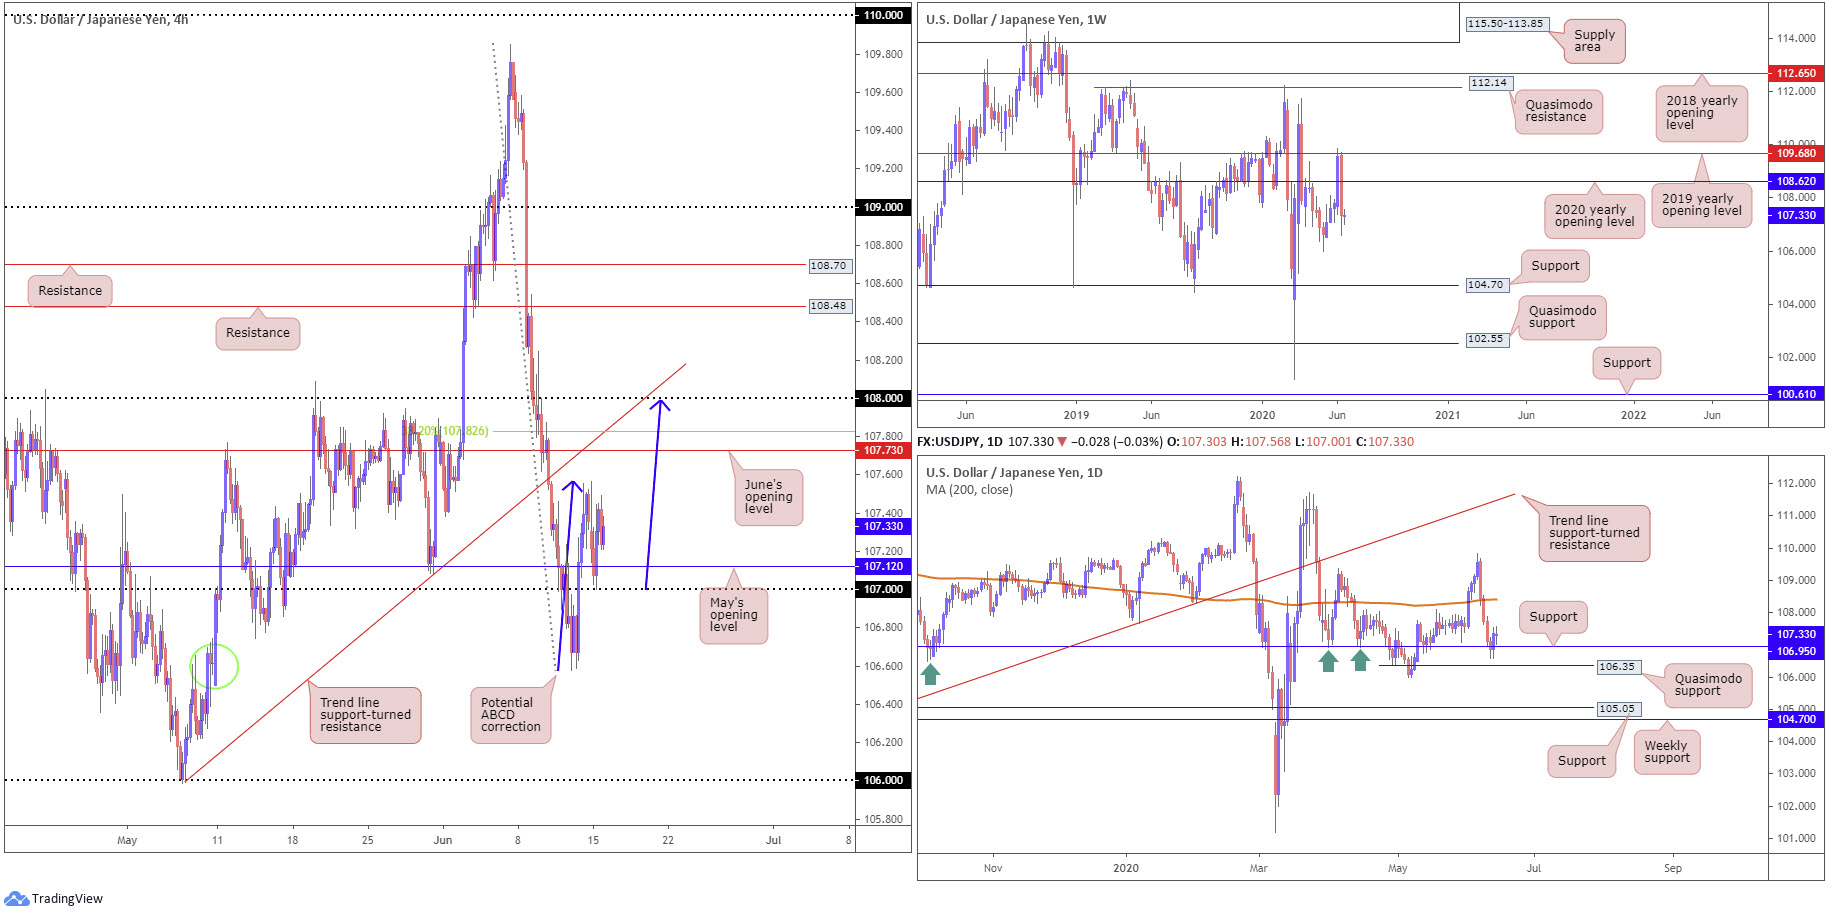
USD/JPY exhibited a relatively subdued tone Monday, putting forward a daily indecision candle.
H4 price dipped through May’s opening level at 107.12 and retested 107, which held to the pip. This brings out June’s opening level at 107.73 as possible resistance, stationed close by trend line support-turned resistance (extended from the low 105.99) and the 38.2% Fibonacci retracement ratio at 107.82. 108 is also a level to keep an eye on here, given the potential formation of an ABCD correction (blue arrows).
From the weekly timeframe, due to the lack volatility Monday, our outlook remains unchanged into Tuesday (italics):
Erasing all the prior week’s gains and snapping a four-week bullish phase, last week’s swing lower may reinforce further selling this week.
Down more than 200 pips into the week’s wrap, after firmly rejecting the 2019 yearly opening level at 109.68 and cruising through the 2020 yearly opening level at 108.62, this shifts focus to the 105.98 6th May low as the next downside target on this timeframe.
Aside from Monday’s daily indecision candle, the daily timeframe’s structure also remains unchanged (italics):
Contrary to the weekly timeframe’s position, end-of-week trade had daily movement cross swords with support at 106.95, missing Quasimodo support at 106.35 by a hair.
Friday observed buyers make a comeback off support at 106.95, swinging the 200-day SMA (orange – 108.41) back on to the radar.
So, while weekly price suggests sellers govern action, daily price indicates buyers are unlikely to give up without a fight. It might also be worth pointing out the 105.98 6th May low underlined on the weekly timeframe forms the low to the aforementioned daily Quasimodo support.
Areas of consideration:
For those who read Monday’s technical briefing you may recall the following (italics):
Having seen both H4 and daily timeframes suggest scope for an extension to the upside, early week could find bulls push for a test of 107.73 on the H4. However, entering long at current price positions buyers in an awkward stance in terms of risk/reward, therefore a retest at 107.12 may be required before traders feel comfortable pulling the trigger.
Well done to any traders who managed to jump aboard the 107 retest, with an initial upside target set at 107.73.
Going forward, bearish scenarios, thanks to weekly price displaying room to explore lower ground, may also be seen between 108/107.73 on the H4.
USD/CAD:
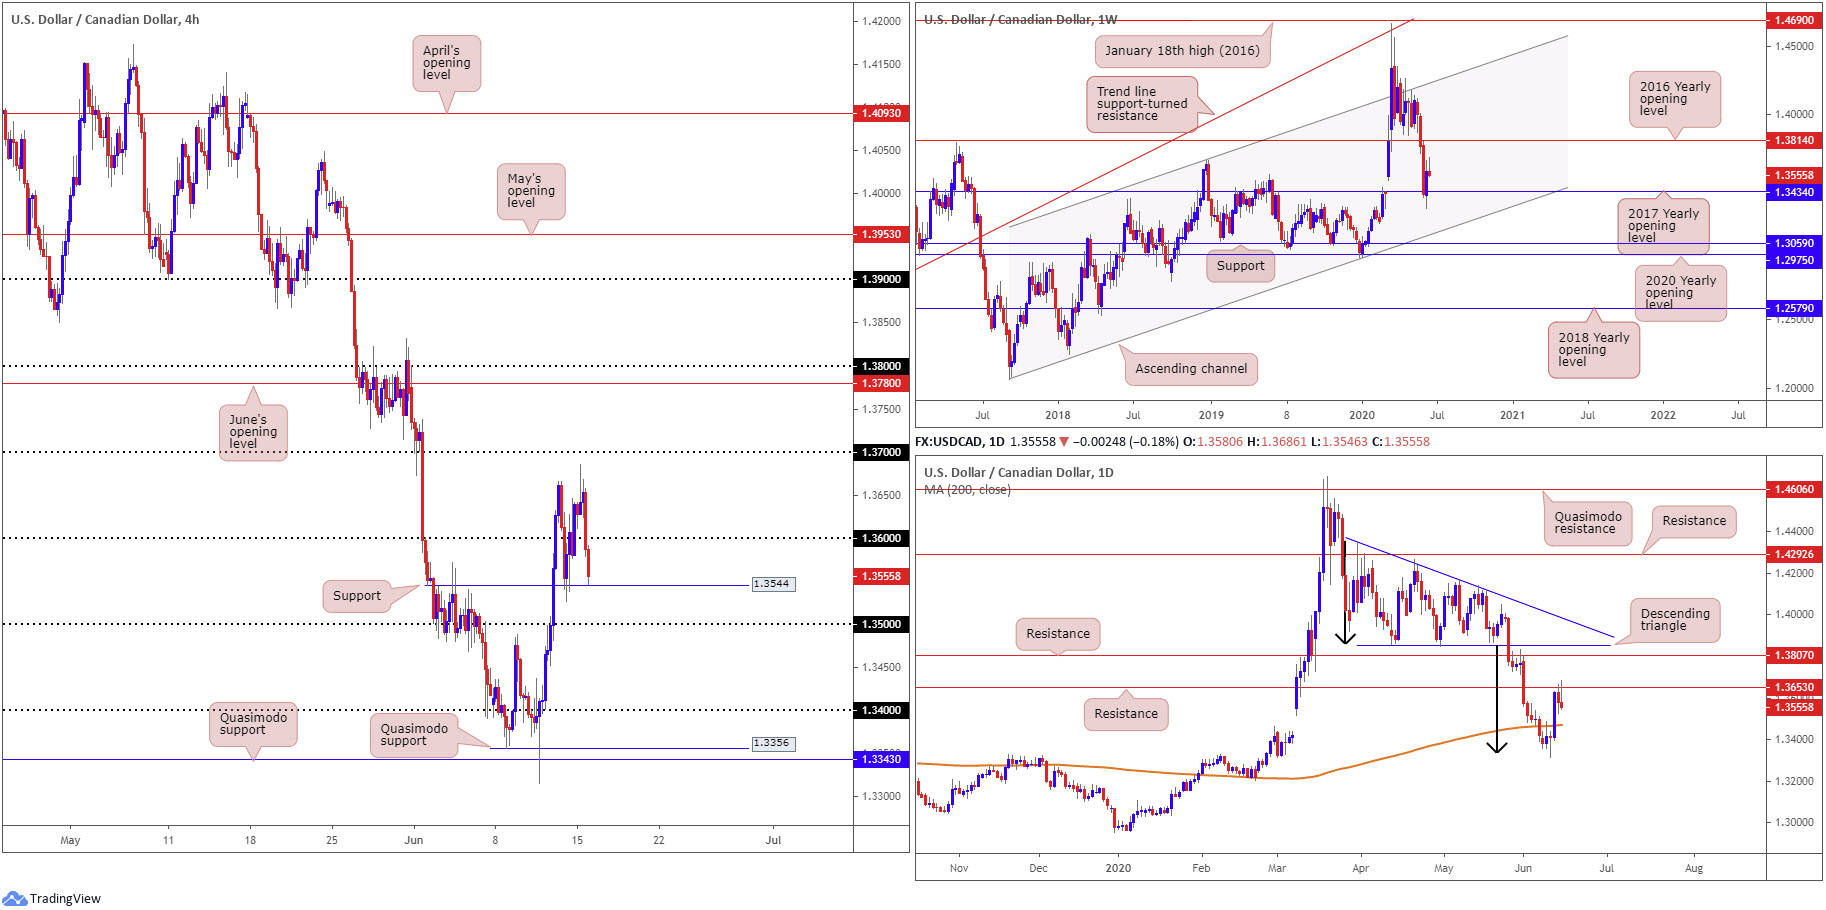
Early Europe latched onto a reasonably firm bid Monday, reaching highs just ahead of 1.37 on the H4 timeframe, shaped in the form of a shooting star candlestick pattern, before turning lower. H4 traded through 1.36, likely running stops, to test waters just ahead of support coming in at 1.3544 (prior Quasimodo resistance). Beyond here, we have a relatively clear run to 1.35.
From the weekly timeframe, Monday’s technical briefing had the following to say (italics):
USD/CAD bulls, following three consecutive weeks of losses, went on the offensive last week, drawing impetus from the 2017 yearly opening level at 1.3434.
Theoretically, this promotes the possibility of additional bullish sentiment this week, targeting resistance by way of the 2016 yearly opening level at 1.3814. Clearing 1.3434, on the other hand, places channel support, taken from the low 1.2061, into the limelight.
In contrast to the weekly timeframe, daily price, after retaking control of the 200-day SMA (orange – 1.3470) out of the descending triangle’s (between 1.4349 and 1.3855) take-profit base at 1.3332 (black arrows), recently landed at resistance drawn from 1.3653. Evident from the chart, sellers are making their presence known here, though whether it is enough to hold the base is difficult to judge, given the weekly timeframe suggesting higher moves. Above current resistance, another layer of resistance at 1.3807 is seen, set just south of the underside of the aforementioned descending triangle.
Areas of consideration:
Higher-timeframe buyers are unlikely to commit to the weekly timeframe’s push off support at 1.3434 until we crack daily resistance from 1.3653.
Shorter-term action appears set to challenge H4 support at 1.3544. A break of here may entice breakout sellers to 1.35ish. Another potential scenario to keep an eye is a fakeout through 1.35 into the 200-day SMA (1.3470). A H4 close back above 1.35 from the SMA will likely be a welcomed sight for buyers.
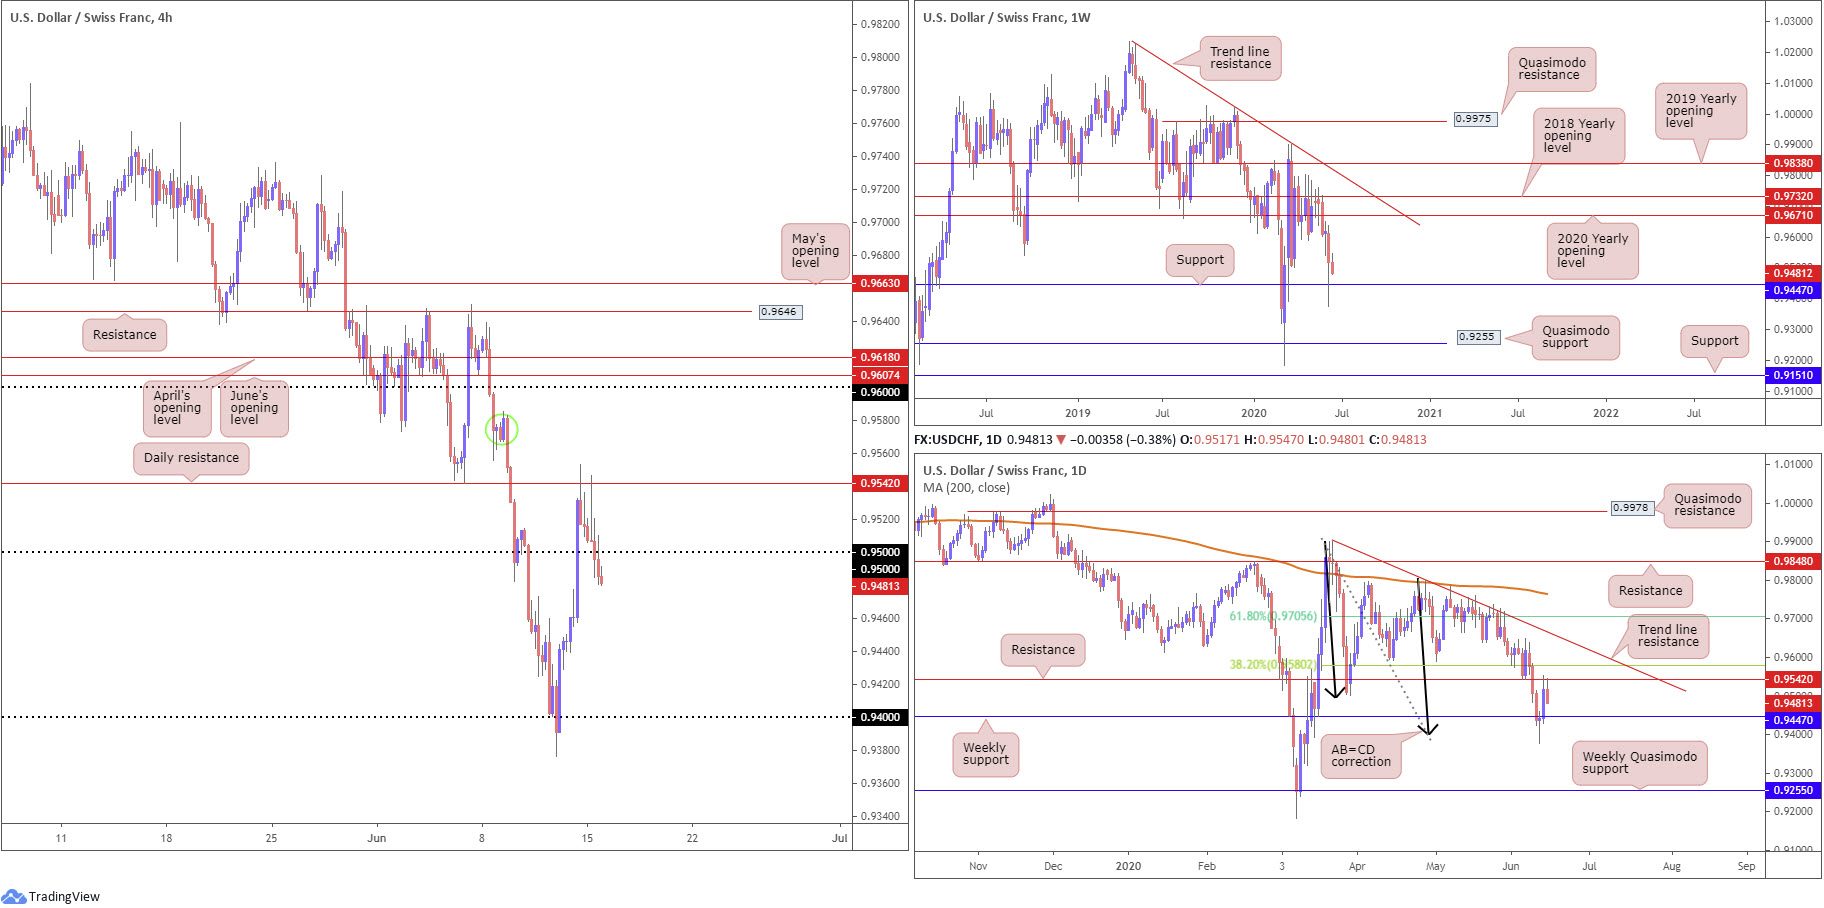
USD/CHF:
Daily resistance at 0.9542 remained in the fight Monday, dropping H4 candles through the 0.95 handle as we transitioned into US hours. Technically, the research team sees little on the H4 timeframe stopping further downside from taking over until we reach 0.94.
While the break of 0.95, considering the immediate trend faces south, may have drawn in sellers, traders are urged to pencil in the possibility of buyers making an appearance off weekly support at 0.9447.
It is also worth reminding ourselves of the daily timeframe’s overall picture, pointing to a possible move above daily resistance (italics):
The break of current weekly support threw breakout sellers into a bear trap as daily buyers vigorously defended AB=CD structure (black arrows) at 0.9395. The initial upside target out of the daily AB=CD pattern, traditionally speaking, can be found at the 38.2% Fibonacci retracement ratio at 0.9580 (derived from legs A-D), positioned above resistance plotted at 0.9542 which hit Friday. It is possible, according to traditional measures, the final AB=CD target might also be met at 0.9705, the 61.8% Fibonacci retracement ratio from legs A-D. This implies a push above trend line resistance, taken from the high 0.9901.
Areas of consideration:
As aired above, breakout sellers beneath 0.95 on the H4 timeframe may want to take into account weekly support at 0.9447 may hinder downside.
Should we react to 0.9447, this may also entice buyers back into the fray.
According to the AB-CD daily take-profit projections we may eventually head above the noted daily resistance (0.9542) for 0.9580ish, perhaps enough to draw in sellers off 0.9618/0.96 (April and June’s opening levels and the round number 0.96) on the H4. Therefore, 0.9618/0.96 is certainly a base to watch as a potential reversal area.
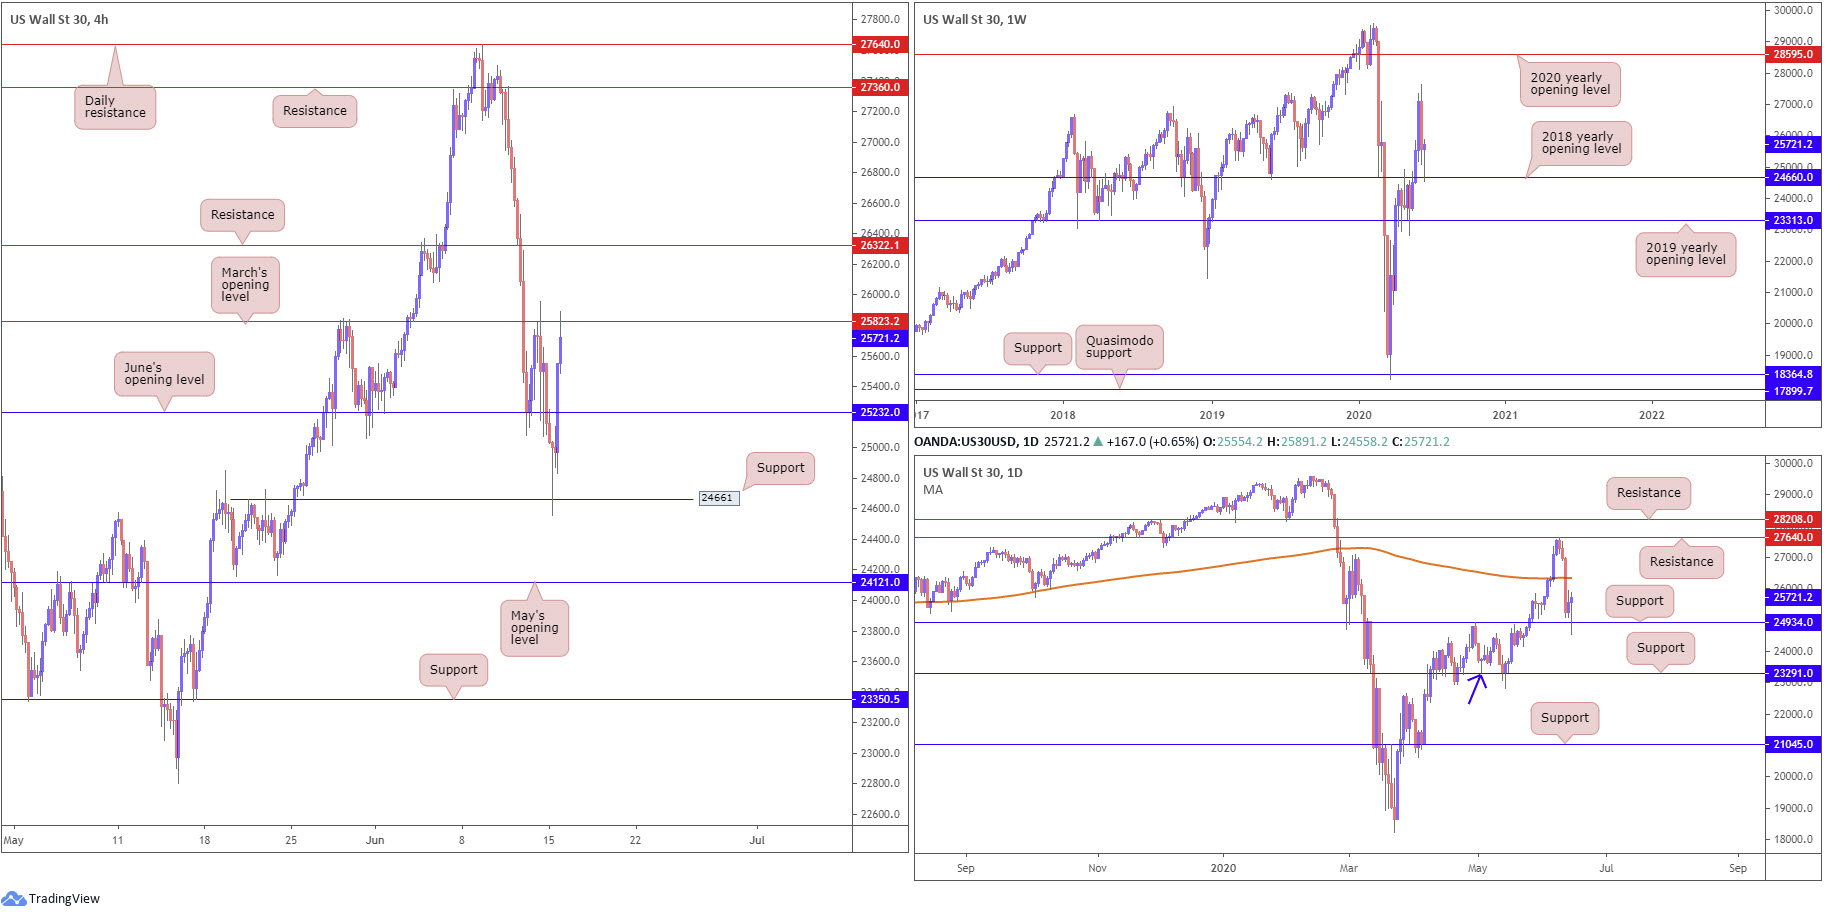
Dow Jones Industrial Average:
Global equity markets fell sharply in early trade Monday on increasing COVID-19 infections across US and China. Despite this, equities strongly recovered losses into afternoon trade. The Dow Jones Industrial Average climbed 157.62 points, or 0.62%; the S&P 500 rose 26.55 points, or 0.87%, and the tech-heavy Nasdaq 100 concluded higher by 113.12 points, or 1.17%.
From the weekly timeframe, technical traders will note the 2018 yearly opening level at 24660 was revisited as support and held beautifully in recent trade. Dipping under this base invites an approach to the 2019 yearly opening level at 23313, whereas an extension higher has the 27638 high to target, followed by the 2020 yearly opening level at 28595.
Daily movement also brought in support coming in from 24934 yesterday, eyeing the possibility of an extension to the 200-day SMA (orange – 26346). Moves lower, on the other hand, turns focus to support at 23291, also representing a Quasimodo formation (blue arrow).
Monday’s technical briefing underlined H4 support at 24661 as an interesting base, due to it combining with weekly support at 24660 (2018 yearly opening level). As you can see, the H4 level held into early Europe yesterday, enough to retake June’s opening level at 25232 and challenge March’s opening level at 25823 into the closing stages.
Areas of consideration:
Although the week kicked off on negative turf, buyers ended the day on the front foot. This, alongside higher timeframes, could see a H4 climb above March’s opening level at 25823 and put forward an approach to H4 resistance at 26322, followed closely by the 200-day SMA (orange – 26346).
With the above in mind, a H4 break above 25823 that’s followed up with a concrete retest may spark buyer interest.
Failing a break of 25823, a dip back to June’s opening level at 25232 that holds into a H4 close might also be worth considering as a bullish case, owing to where we’re coming from on the bigger picture.
The accuracy, completeness and timeliness of the information contained on this site cannot be guaranteed. IC Markets does not warranty, guarantee or make any representations, or assume any liability regarding financial results based on the use of the information in the site.
News, views, opinions, recommendations and other information obtained from sources outside of www.icmarkets.com.au, used in this site are believed to be reliable, but we cannot guarantee their accuracy or completeness. All such information is subject to change at any time without notice. IC Markets assumes no responsibility for the content of any linked site.
The fact that such links may exist does not indicate approval or endorsement of any material contained on any linked site. IC Markets is not liable for any harm caused by the transmission, through accessing the services or information on this site, of a computer virus, or other computer code or programming device that might be used to access, delete, damage, disable, disrupt or otherwise impede in any manner, the operation of the site or of any user’s software, hardware, data or property.


