
DXY:
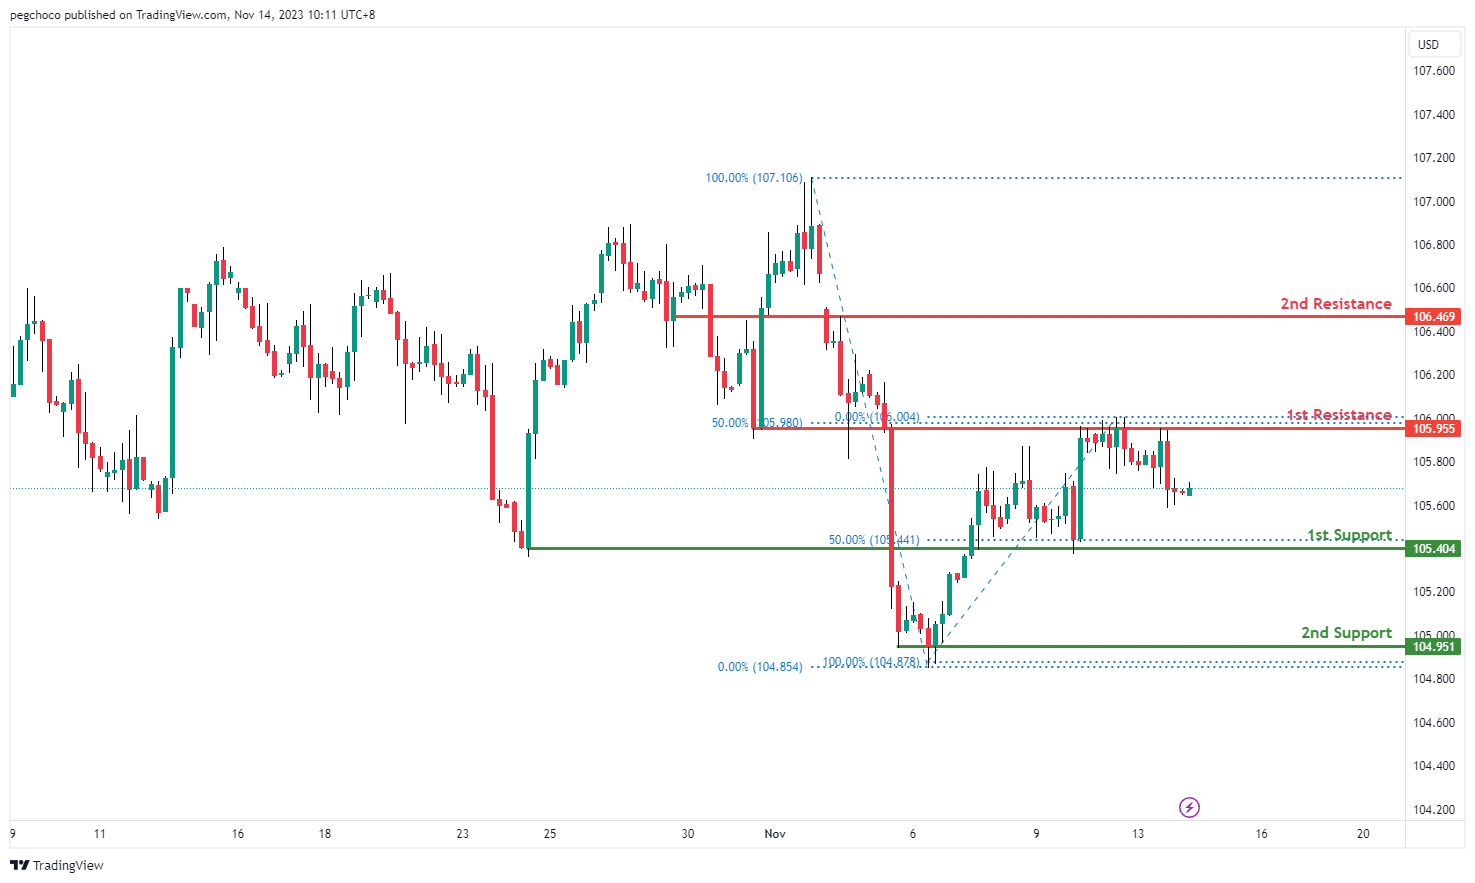
The DXY chart currently has a bearish overall momentum, suggesting the potential for a bearish continuation towards the 1st support level.
1st support at 105.40 is identified as an overlap support, and it also coincides with the 50% Fibonacci Retracement level. This level indicates that there could be a significant level of support, and traders may expect the price to find buying interest or a pause in the bearish movement around this area.
The 2nd support at 104.95 is considered a multi-swing low support, further reinforcing its potential as a support level. Multi-swing lows often indicate areas where buyers have stepped in previously, making it a relevant support level.
On the resistance side, the 1st resistance at 105.95 is categorized as an overlap resistance and also coincides with the 50% Fibonacci Retracement level. This level suggests that there could be selling interest in this area, potentially acting as a barrier to further upward movement.
The 2nd resistance at 106.46 is noted as a pullback resistance, indicating another potential level where the price may encounter selling pressure during its bearish continuation.
EUR/USD:
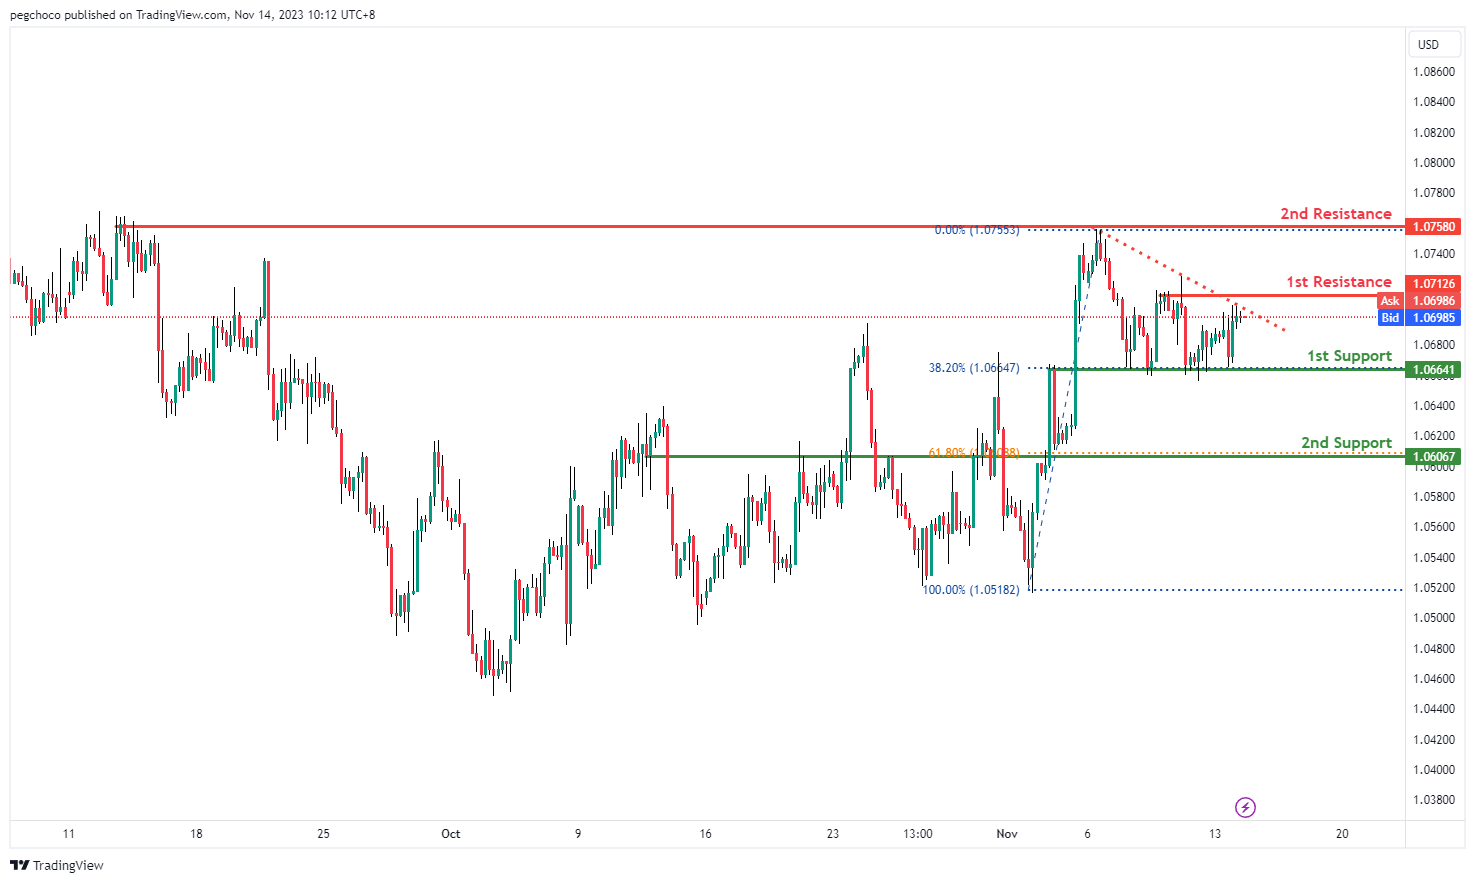
The EUR/USD chart currently has a bearish overall momentum, suggesting the potential for a bearish reaction off the 1st resistance level and a drop towards the 1st support.
1st support at 1.0664 is identified as an overlap support, and it also coincides with the 38.20% Fibonacci Retracement level. This level suggests that there could be a significant level of support, and traders may expect the price to find buying interest or a pause in the bearish movement around this area.
The 2nd support at 1.0606 is considered a pullback support and coincides with the 61.80% Fibonacci Retracement level. This level reinforces its potential as a support level. Fibonacci retracement levels are often watched by traders for potential reversal points.
On the resistance side, the 1st resistance at 1.0712 is categorized as a multi-swing high resistance. This level indicates that there could be selling interest in this area, potentially acting as a barrier to further upward movement.
The 2nd resistance at 1.0758 is also noted as a multi-swing high resistance, adding to the potential areas where the price might find resistance during its bearish reaction.
EUR/JPY:
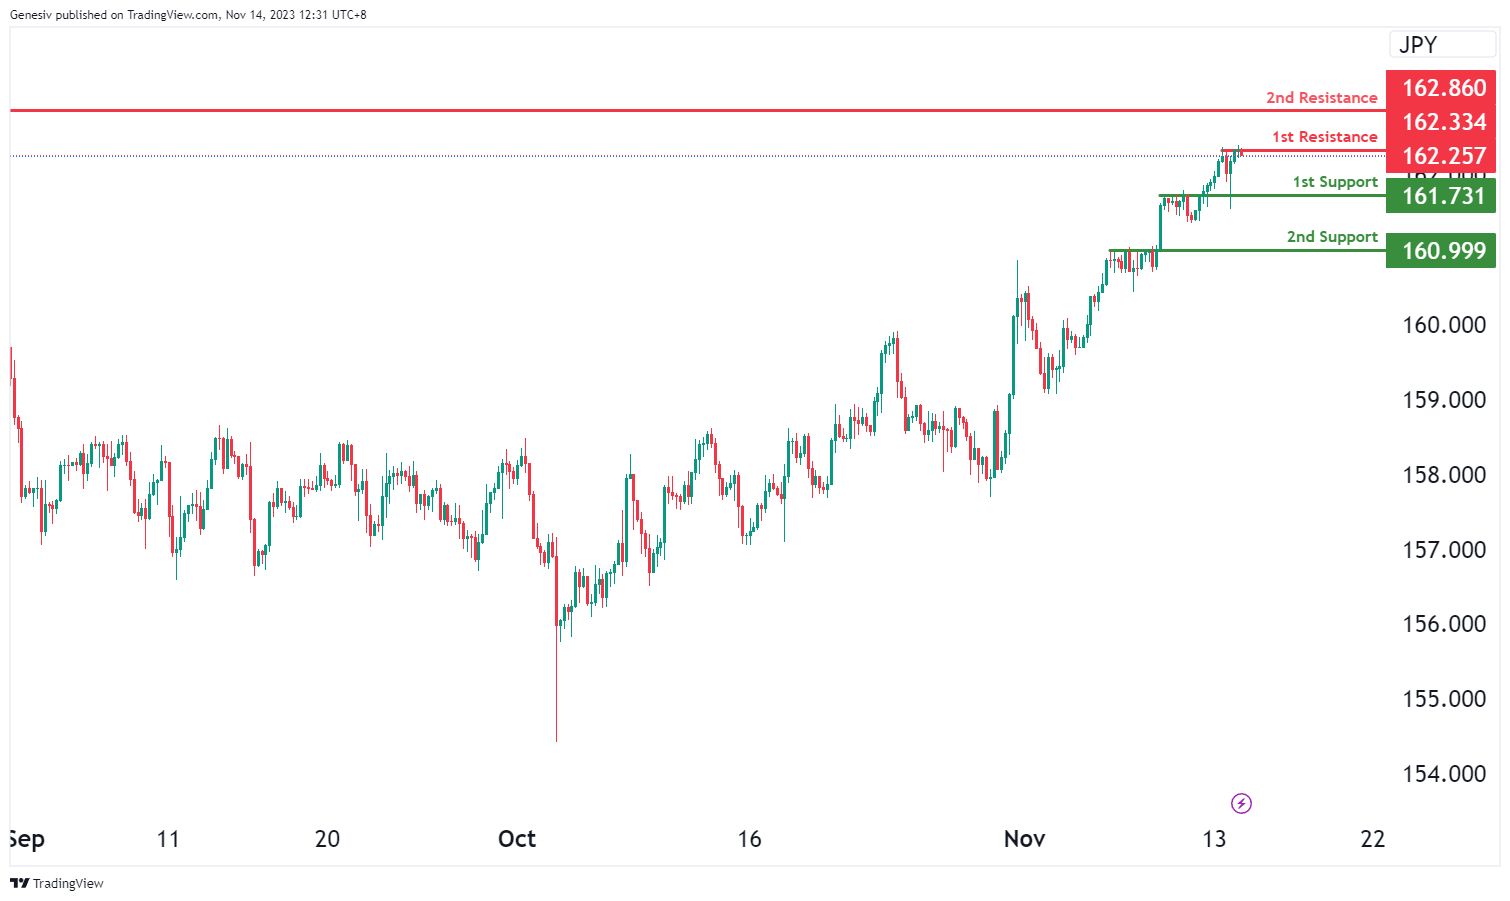
The EUR/JPY chart currently suggests a bearish momentum, indicating a potential bearish reaction off the first resistance at 162.33, with a subsequent drop towards the first support at 161.73.
The first support at 161.73 is identified as a pullback support, indicating a level where the price might find some buying interest. Additionally, the second support at 160.99 is recognized as another pullback support, reinforcing the potential strength of the support zone.
On the resistance side, the first resistance at 162.33 represents a point of multi-swing high resistance, marking a crucial level where the price might face selling pressure. Furthermore, the second resistance at 162.86 is characterized as a swing high resistance, suggesting another level where the price might encounter obstacles within its downward movement.
EUR/GBP:
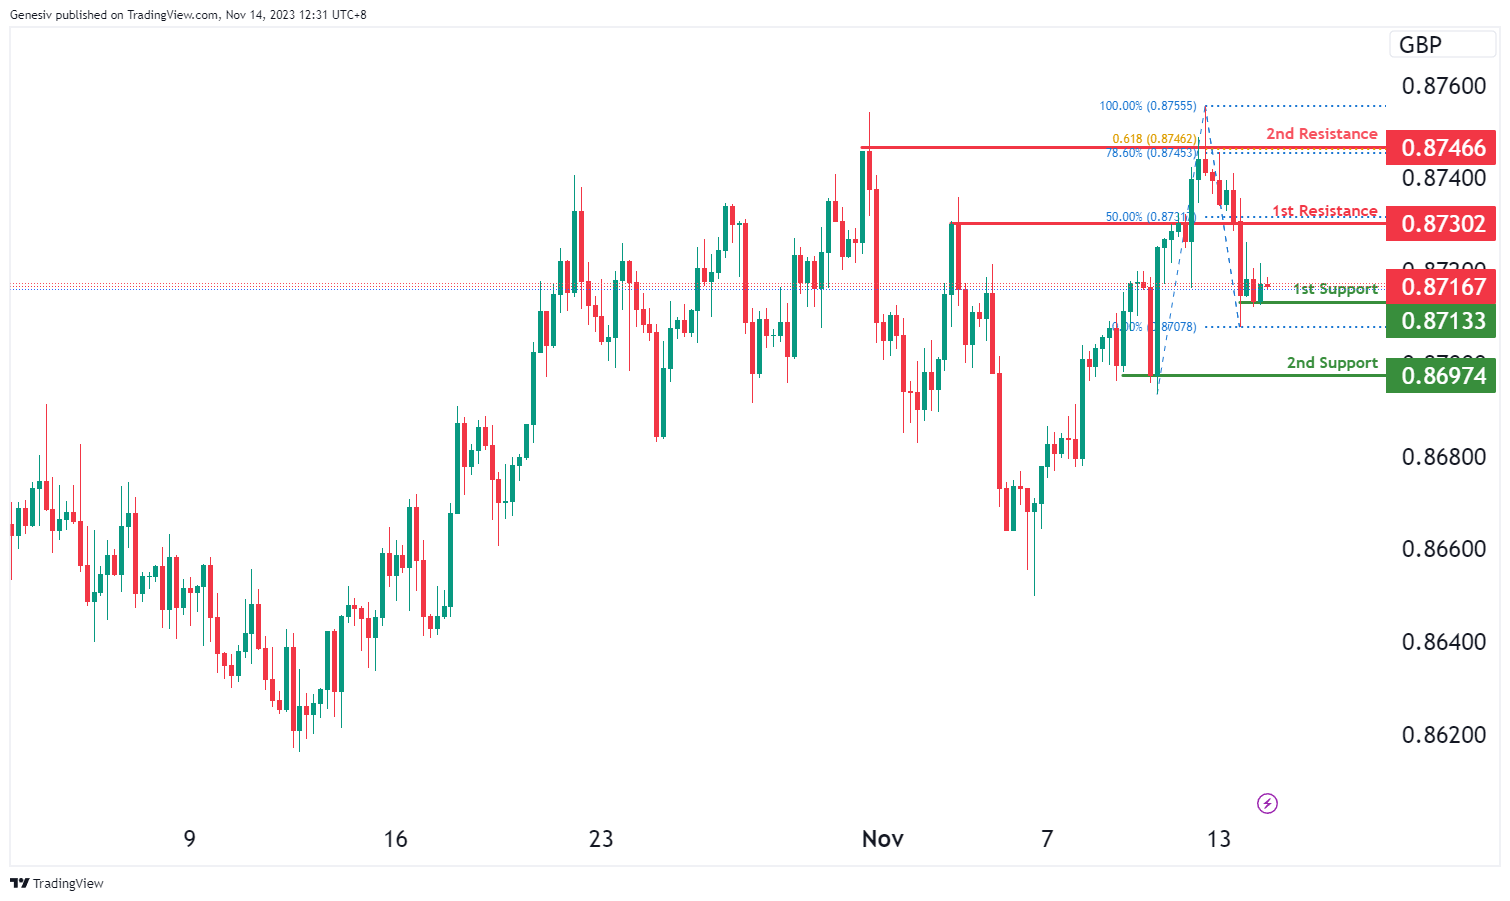
The EUR/GBP chart currently demonstrates a bullish momentum, suggesting a potential bullish bounce off the first support at 0.8713, with the potential to head towards the first resistance at 0.8730.
The first support at 0.8713 is identified as a swing low support, providing a foundational level for potential price rebounds. Additionally, the second support at 0.8697 is recognized as a multi-swing low support, reinforcing the potential strength of the support zone.
On the resistance side, the first resistance at 0.8730 represents a point of pullback resistance, coinciding with the 50% Fibonacci Retracement level. Furthermore, the second resistance at 0.8746 is identified as a multi-swing high resistance, demonstrating Fibonacci confluence with the 78.60% Fibonacci Retracement and the 61.80% Fibonacci Projection. This indicates a significant potential hurdle for the price and reinforces the importance of this resistance level.
.
GBP/USD:
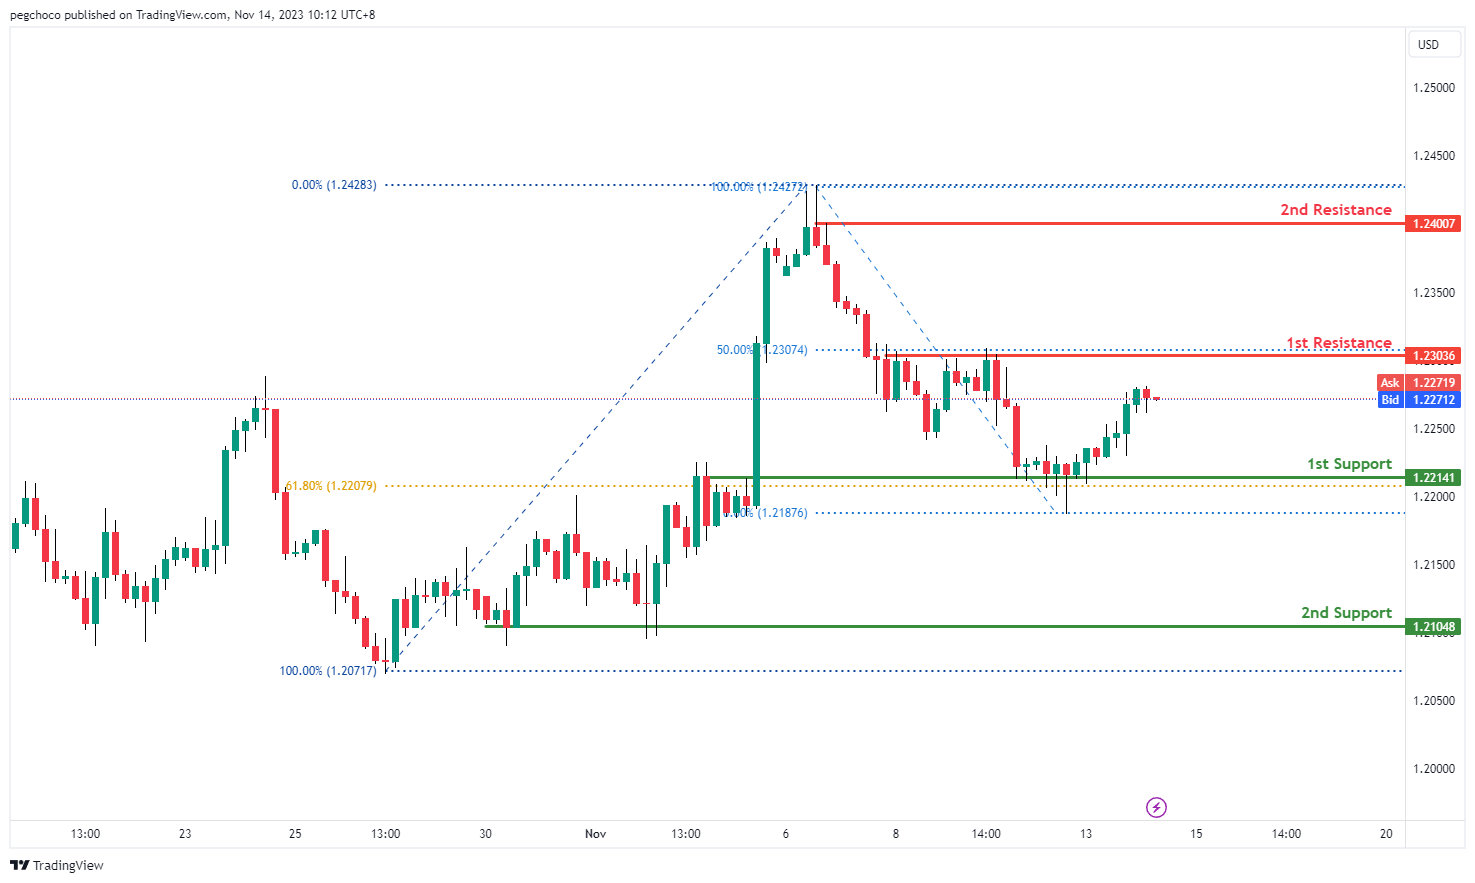
The GBP/USD chart currently has a bullish overall momentum, suggesting the potential for a bullish continuation towards the 1st resistance.
1st support at 1.2214 is identified as an overlap support, and it also coincides with the 61.80% Fibonacci Retracement level. This level suggests that there could be a significant level of support, and traders may expect the price to find buying interest or a pause in the bullish movement around this area.
The 2nd support at 1.2104 is considered a multi-swing low support, further reinforcing its potential as a support level. Multiple swing lows indicate an area where buyers have previously stepped in, making it a significant support zone.
On the resistance side, the 1st resistance at 1.2303 is categorized as a multi-swing high resistance. This level coincides with the 50% Fibonacci Retracement level, which adds to its significance. This area may act as a barrier to further upward movement, where sellers could be active.
The 2nd resistance at 1.2400 is noted as a swing high resistance, indicating another potential level where the price may encounter obstacles in its upward movement.
.
GBP/JPY:
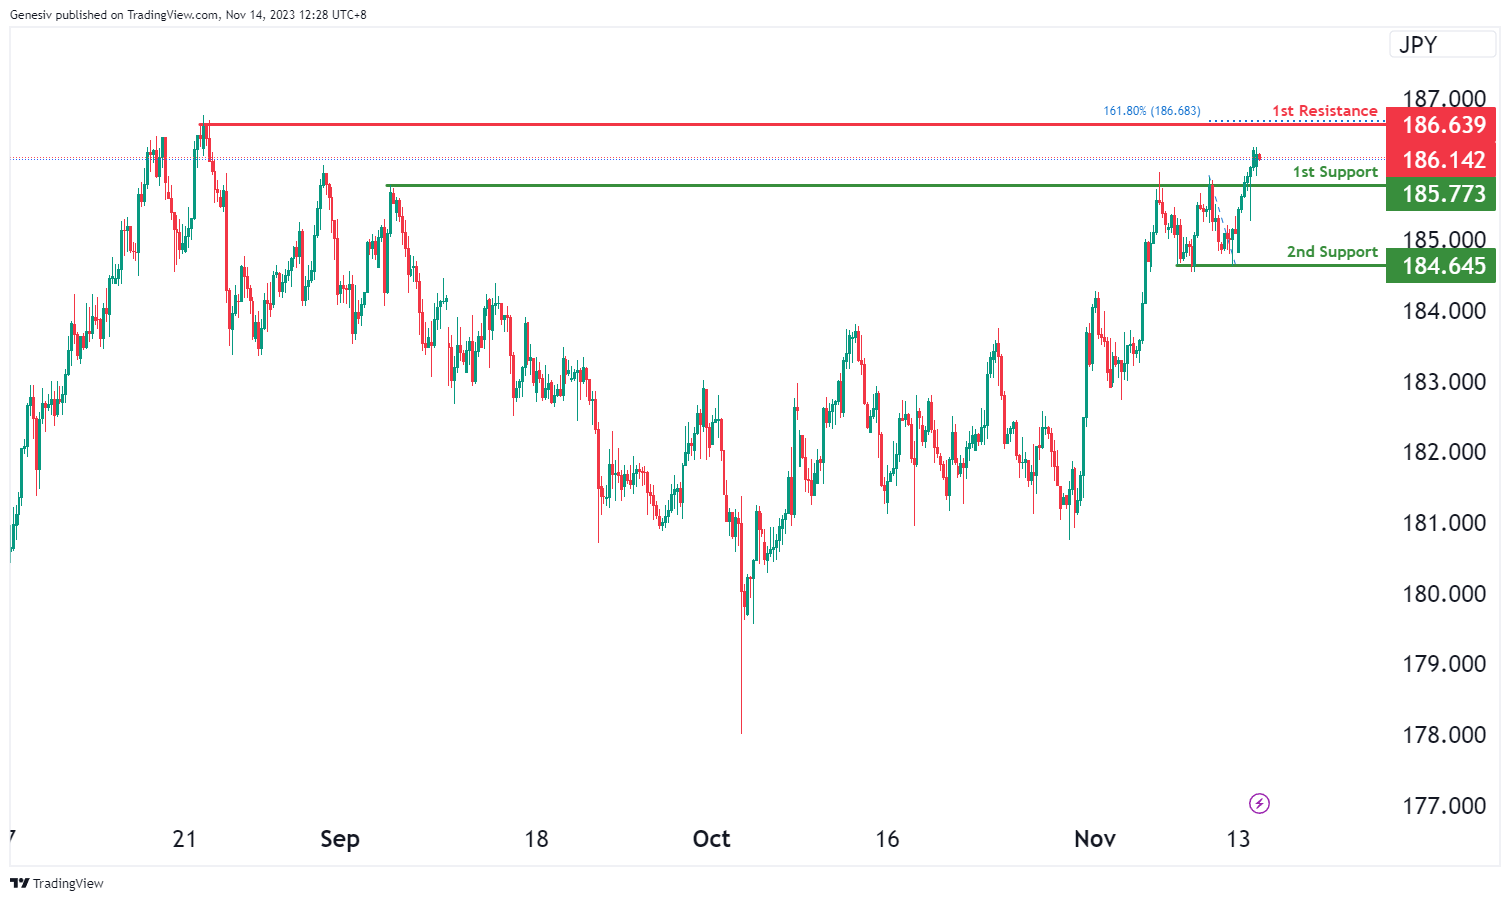
The GBP/JPY chart currently exhibits a bullish momentum, suggesting a potential bullish continuation towards the first resistance at 186.63.
The first support at 185.77 is identified as a pullback support, providing a potential foundation for the price to bounce higher. Additionally, the second support at 184.64 is recognized as a multi-swing low support, further reinforcing the potential strength of the support zone.
On the upside, the first resistance at 186.63 represents a point of swing high resistance, indicating a significant level where the price might face resistance or potential reversals within its upward movement. This level is crucial for traders to monitor as it could influence the continuation of the bullish trend.
USD/CHF:
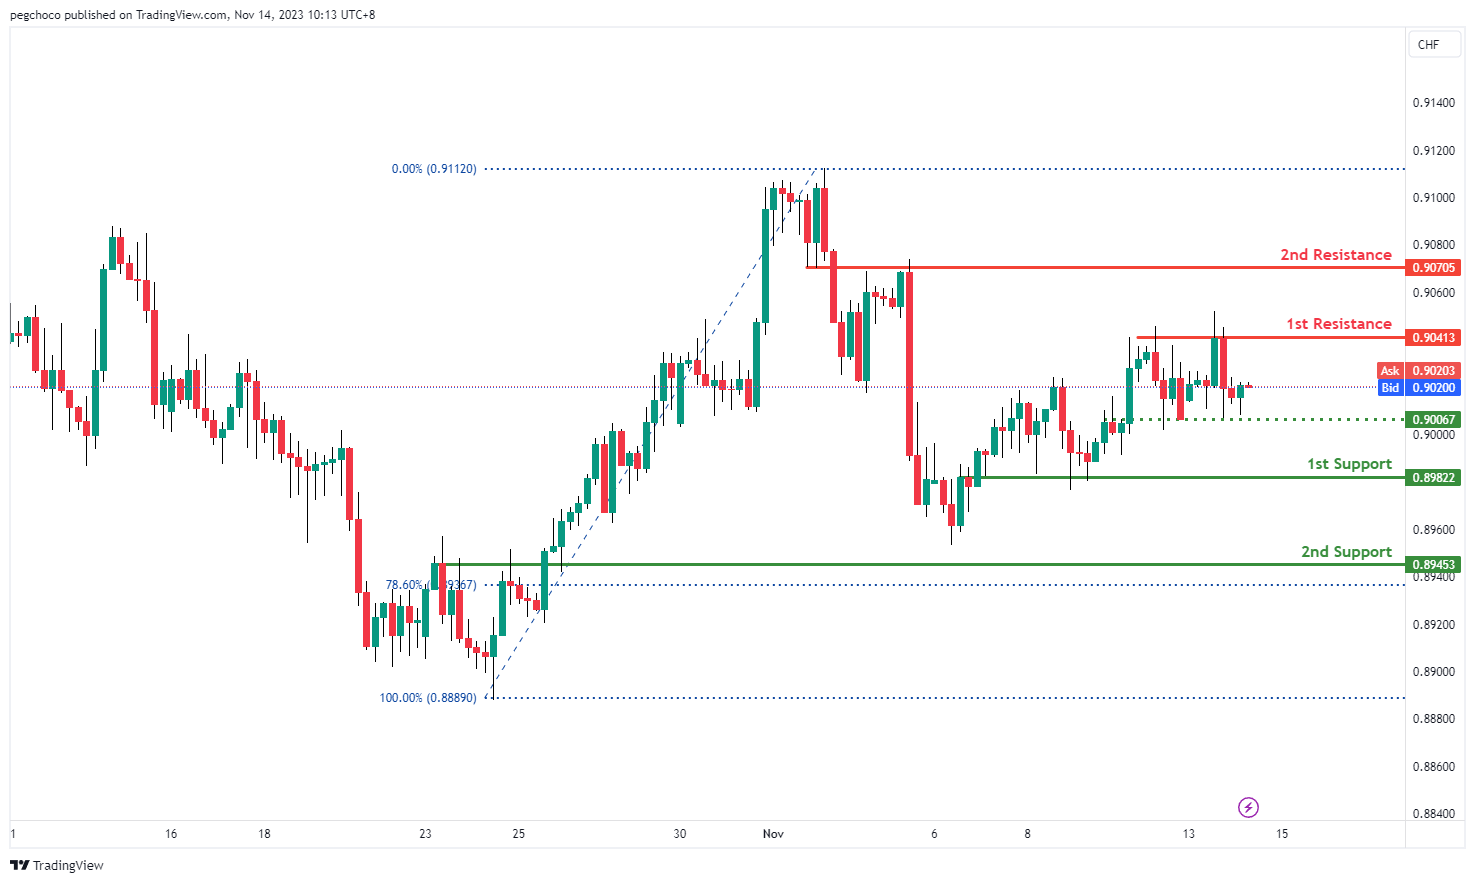
The USD/CHF chart exhibits a bearish overall momentum, indicating the potential for a continuation of the bearish trend. Here are the key levels to watch:
1st support at 0.8982: This level is considered an overlap support, which means it has previously acted as a support level and could attract buying interest or act as a barrier to further downside.
2nd support at 0.8945: This support level gains significance as it coincides with the 78.60% Fibonacci Retracement level. Fibonacci retracement levels often act as potential reversal or support levels in the market.
1st resistance at 0.9041: This level is categorized as a multi-swing high resistance, indicating that it has historically been a point where price faced selling pressure and reversed lower.
2nd resistance at 0.9070: This is an overlap resistance, suggesting it has previously served as a resistance level and could continue to do so.
Intermediate support at 0.9006: This level is identified as an overlap support, adding to its potential significance as a support zone.
USD/JPY:
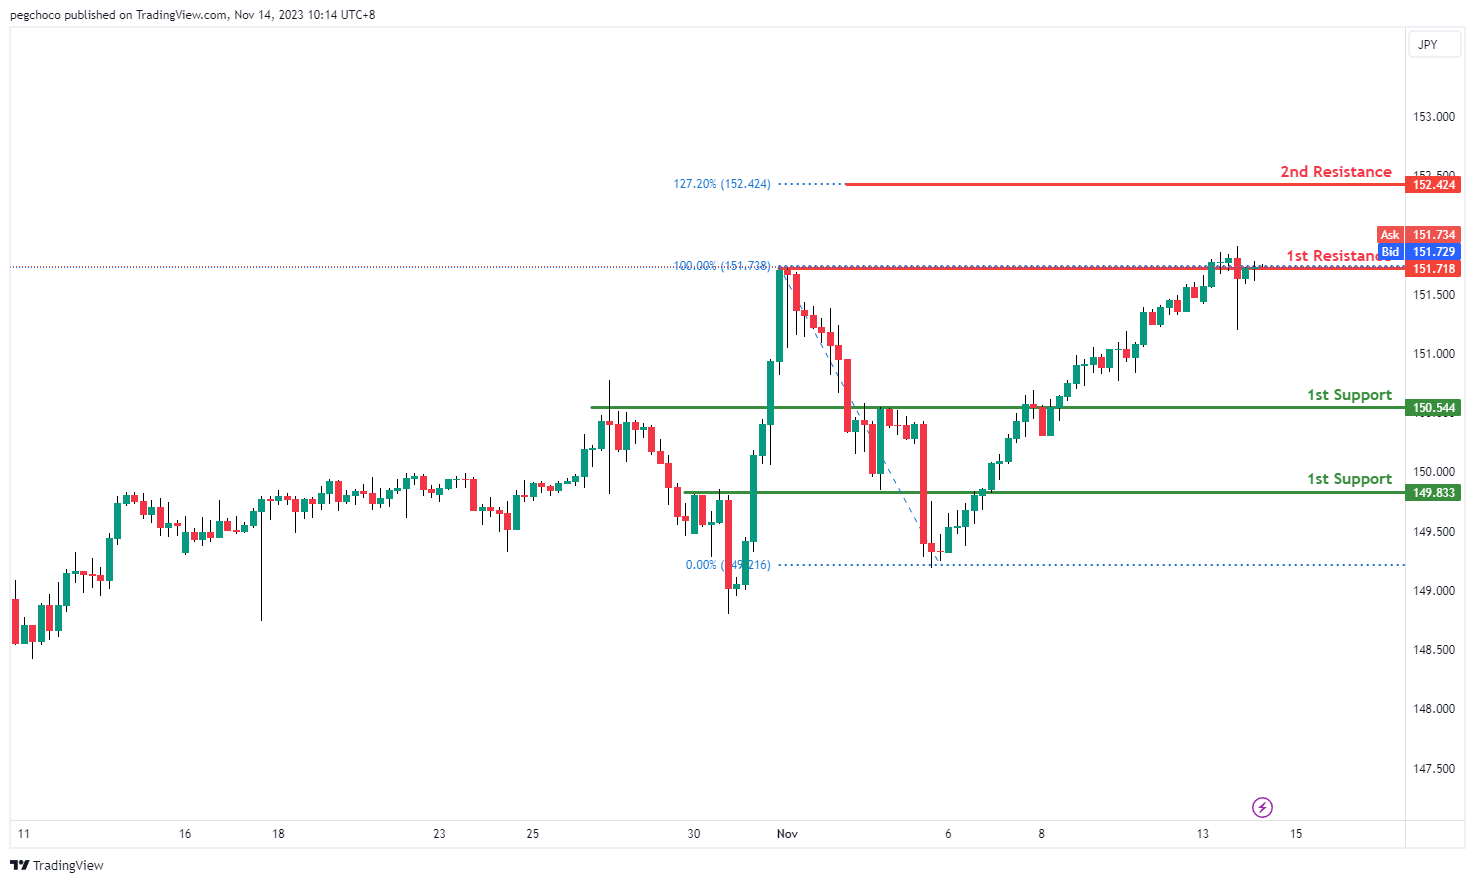
The USD/JPY chart currently shows a bullish overall momentum, indicating the potential for further upside movement. Here are the key levels to watch:
1st support at 150.54: This level is considered a pullback support, suggesting that it has previously acted as a level where buyers stepped in. It could provide a base for price to bounce higher.
2nd support at 149.83: This is another pullback support, indicating that it has historical significance as a level of buying interest.
1st resistance at 151.71: This level is categorized as a swing high resistance, which means it has previously acted as a barrier to further upside movement.
2nd resistance at 152.42: This resistance level is significant as it aligns with the 127.20% Fibonacci Extension, suggesting it could act as a strong barrier to price advancement.
USD/CAD:
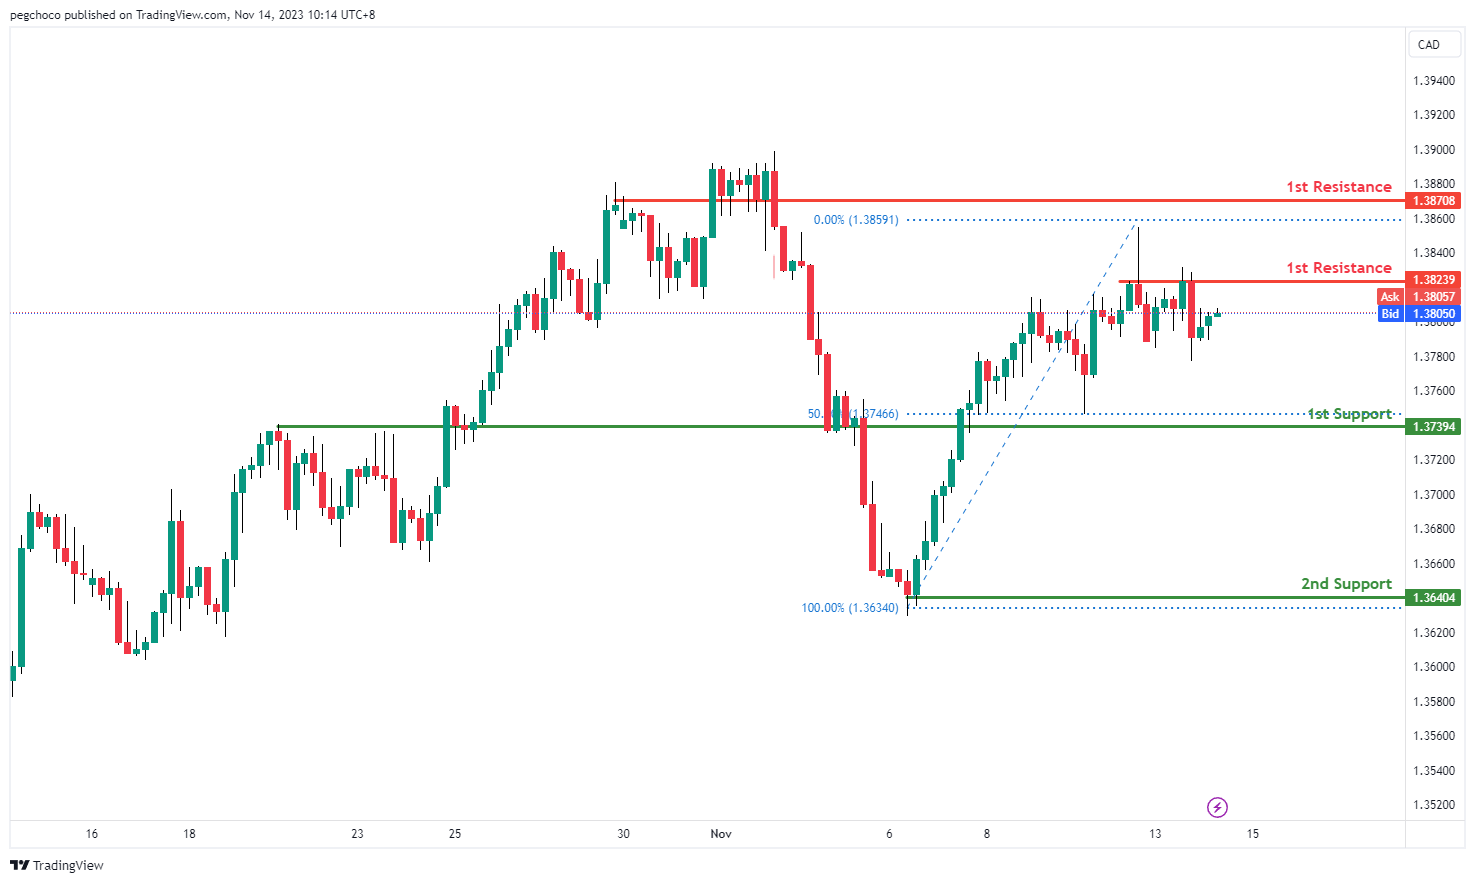
The USD/CAD chart currently shows a bearish overall momentum, indicating the potential for further downside movement. Here are the key levels to watch:
1st support at 1.3739: This level is considered an overlap support and aligns with the 50% Fibonacci Retracement, suggesting that it has previously acted as a level where buyers entered the market. It could provide a base for price to potentially bounce higher.
2nd support at 1.3640: This is a swing low support, indicating historical significance as a level of buying interest.
1st resistance at 1.3823: This level is categorized as a multi-swing high resistance, which means it has previously acted as a barrier to further upside movement.
2nd resistance at 1.3870: This resistance level is significant as it aligns with a pullback resistance, suggesting it could act as a strong barrier to price advancement.
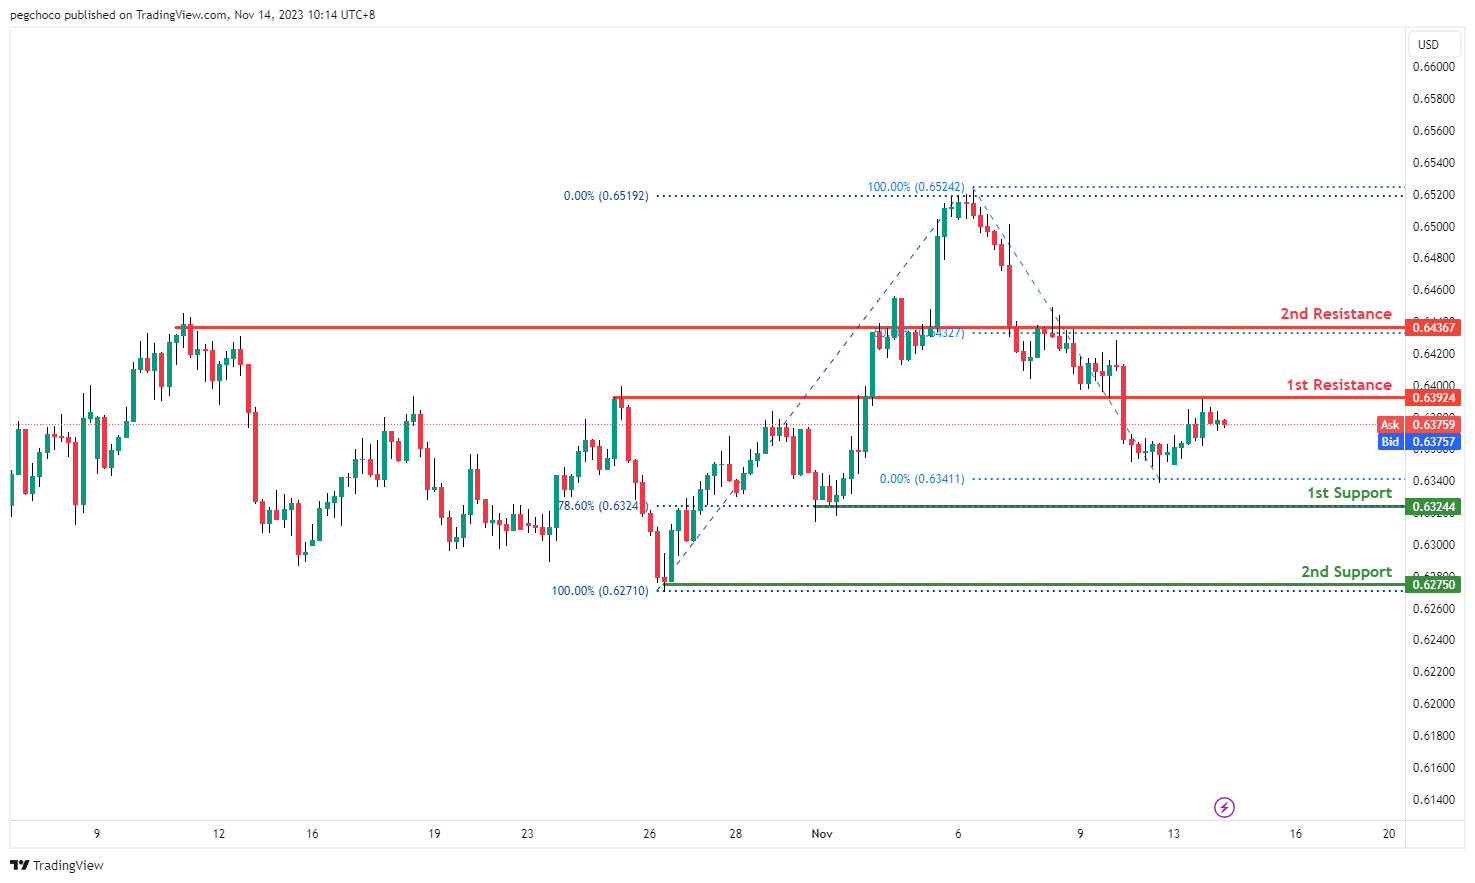
AUD/USD:
The AUD/USD chart currently exhibits a bearish overall momentum, suggesting the potential for further downward movement. Here are the key levels to watch:
1st support at 0.6324: This level is considered an overlap support and coincides with the 78.60% Fibonacci Retracement. It indicates a historical level where buyers have previously stepped in, potentially providing support and causing a bounce.
2nd support at 0.6275: This level is a swing low support, indicating its historical significance as a level of buying interest.
1st resistance at 0.6392: This level is categorized as an overlap resistance and may act as a barrier to further upside movement.
2nd resistance at 0.6436: This resistance level aligns with a 50% Fibonacci Retracement, suggesting that it could serve as a strong resistance level.
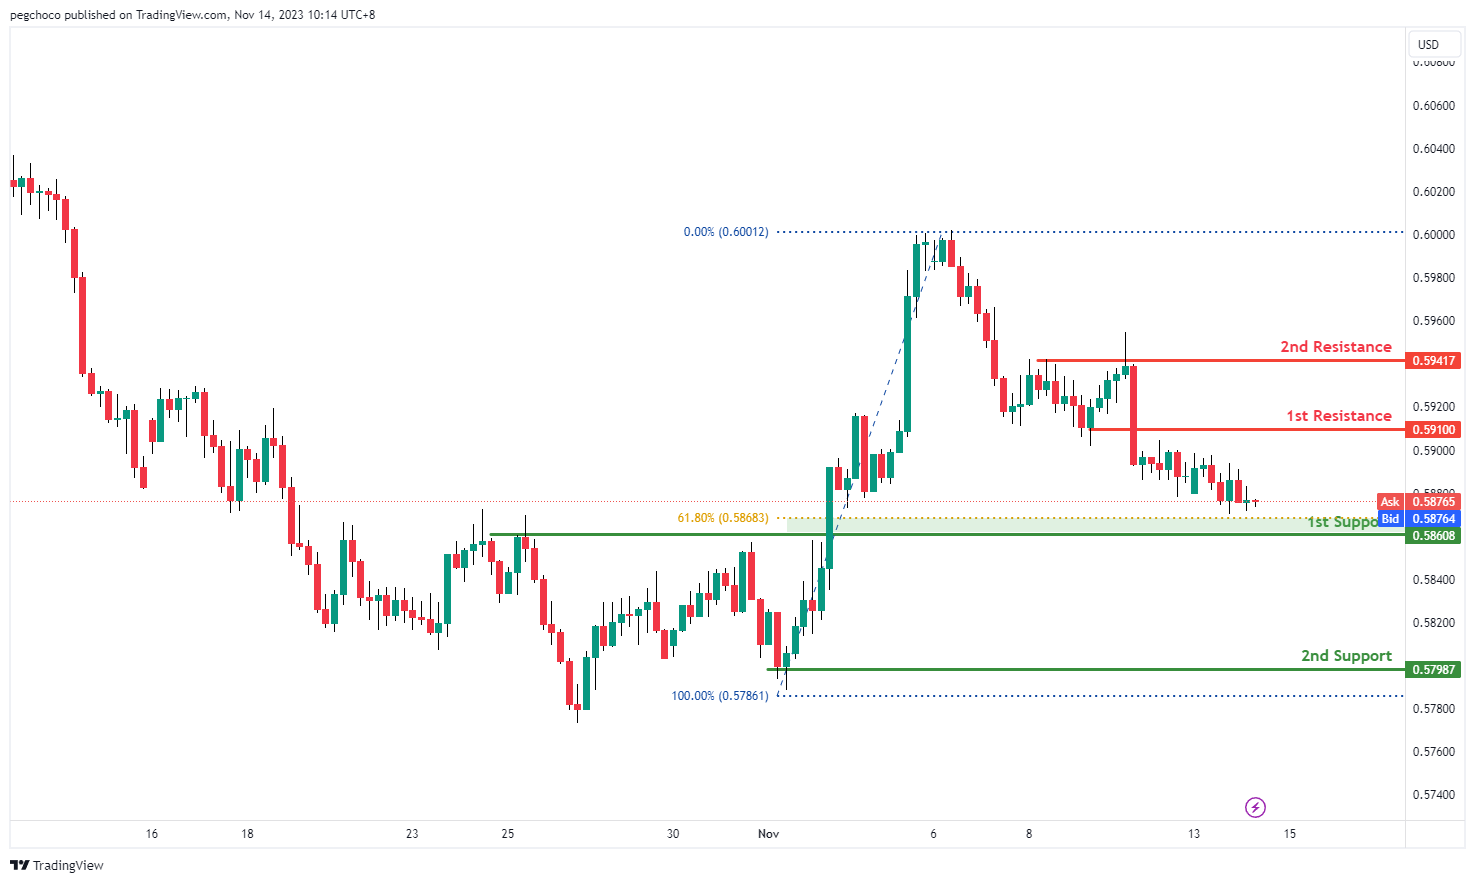
NZD/USD
The NZD/USD chart currently exhibits a bullish overall momentum, suggesting the potential for further upward movement. Here are the key levels to watch:
1st support at 0.5860: This support level is considered a pullback support and coincides with the 61.80% Fibonacci Retracement, indicating a historical level where buyers have previously stepped in. It suggests potential support and a possible bounce from this level.
2nd support at 0.5798: This level is categorized as a swing low support, signifying its historical significance as a level of buying interest.
1st resistance at 0.5919: This resistance level is considered a pullback resistance and may act as a barrier to further upside movement.
2nd resistance at 0.5941: This resistance level aligns with a multi-swing high resistance, indicating its potential strength as a barrier to further bullish movement.
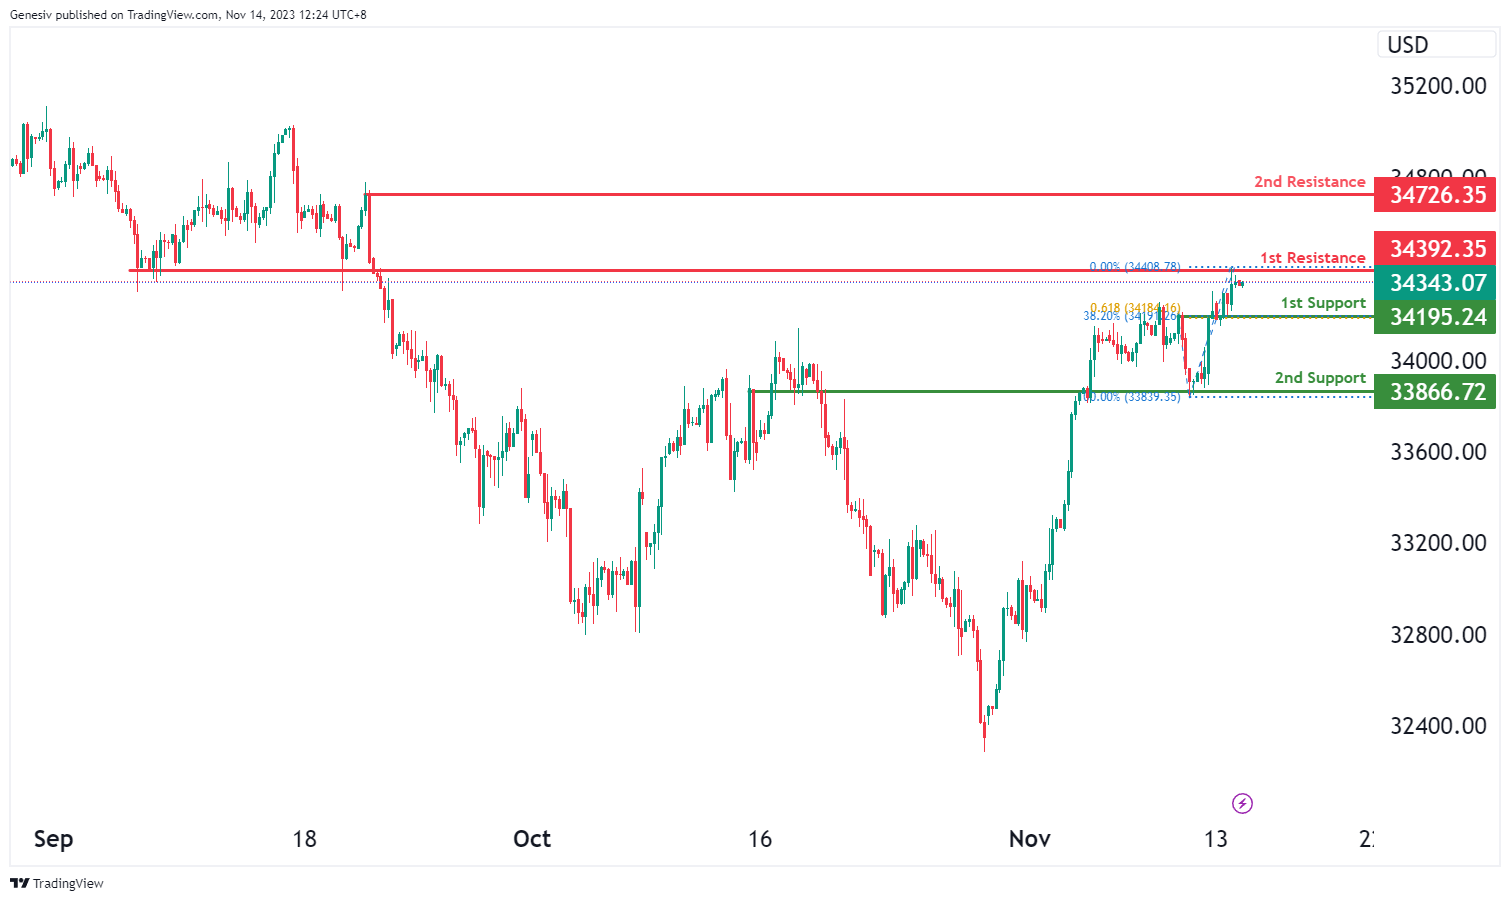
DJ30:
The DJ30 chart is currently showing a bearish momentum, indicating a potential bearish continuation towards the first support level at 34195.24. This support is particularly significant as it is an overlap support, demonstrating Fibonacci confluence with both the 61.80% Fibonacci Projection and the 38.20% Fibonacci Retracement.
Additionally, the second support at 33866.72 is identified as another overlap support, further reinforcing the potential strength of this support zone.
On the resistance side, the first resistance at 34392.35 is recognized as an overlap resistance, suggesting a potential area where the price might face hurdles or reversals within its downward movement. Furthermore, the second resistance at 34726.35 is marked as a swing high resistance, indicating another level of significance where the price might encounter resistance.
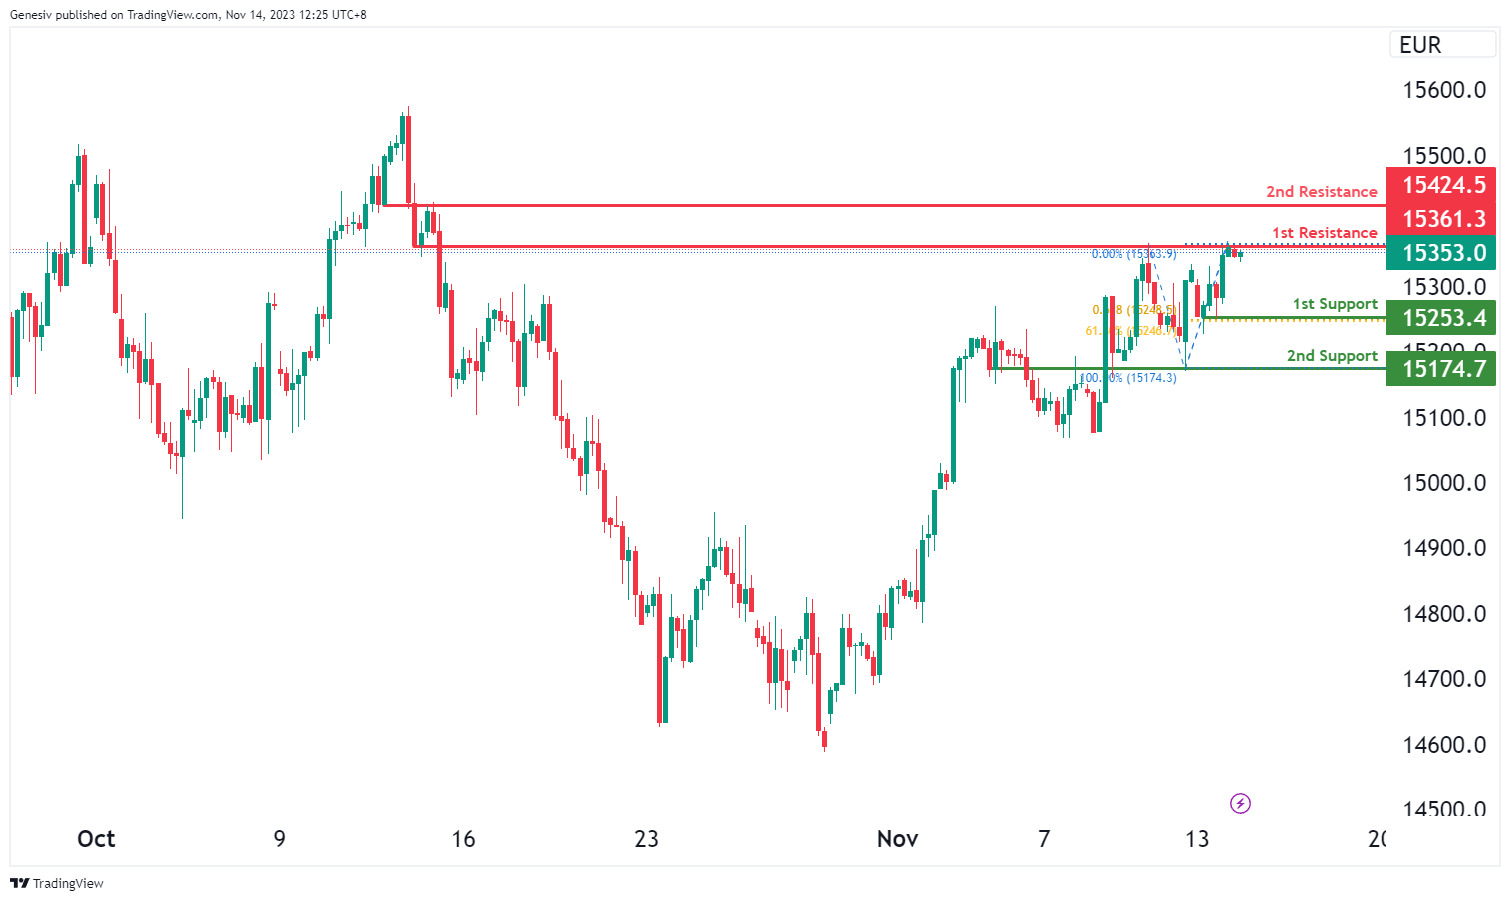
GER40:
The GER40 chart is currently displaying a bearish momentum, suggesting a potential bearish reaction off the first resistance level at 15361.30, with a subsequent drop towards the first support at 15253.40. This support level is significant as it represents a multi-swing low support, and it aligns with the 61.80% Fibonacci Retracement and the 61.80% Fibonacci Projection, indicating a strong area of potential support.
Furthermore, the second support at 15174.70 is identified as an overlap support, adding to the potential strength of the support zone.
On the resistance side, the first resistance at 15361.30 is noted as an overlap resistance, suggesting a crucial point where the price might face resistance or a potential reversal. Additionally, the second resistance at 15424.50 is recognized as another overlap resistance, emphasizing its significance as a level where the price might encounter obstacles within its downward movement.
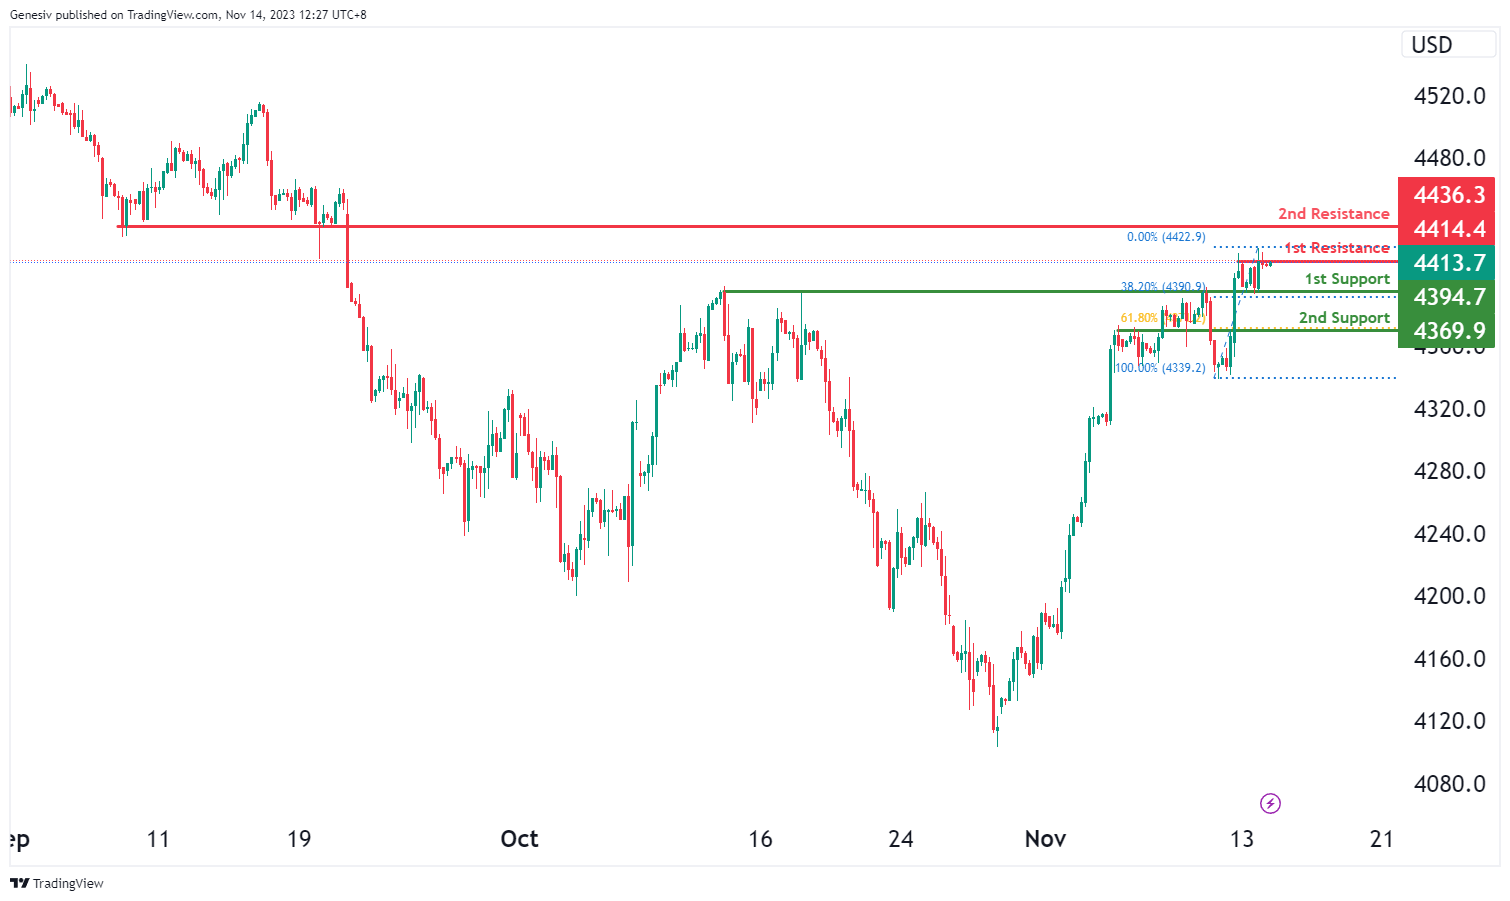
`US500
The US500 chart is currently indicating a bearish momentum, suggesting a potential bearish reaction off the first resistance level at 4414.4, leading to a drop towards the first support at 4394.7. This support is identified as an overlap support, coinciding with the 38.20% Fibonacci Retracement, indicating a significant area for potential price support.
Additionally, the second support at 4369.9 is noted as a pullback support, associated with the 61.80% Fibonacci Retracement level, further strengthening its potential as a crucial support zone.
On the resistance side, the first resistance at 4414.4 represents a point of multi-swing high resistance, indicating a significant hurdle for the price. Furthermore, the second resistance at 4436.3 is characterized as a pullback resistance, marking another level where the price might face resistance within its downward movement.
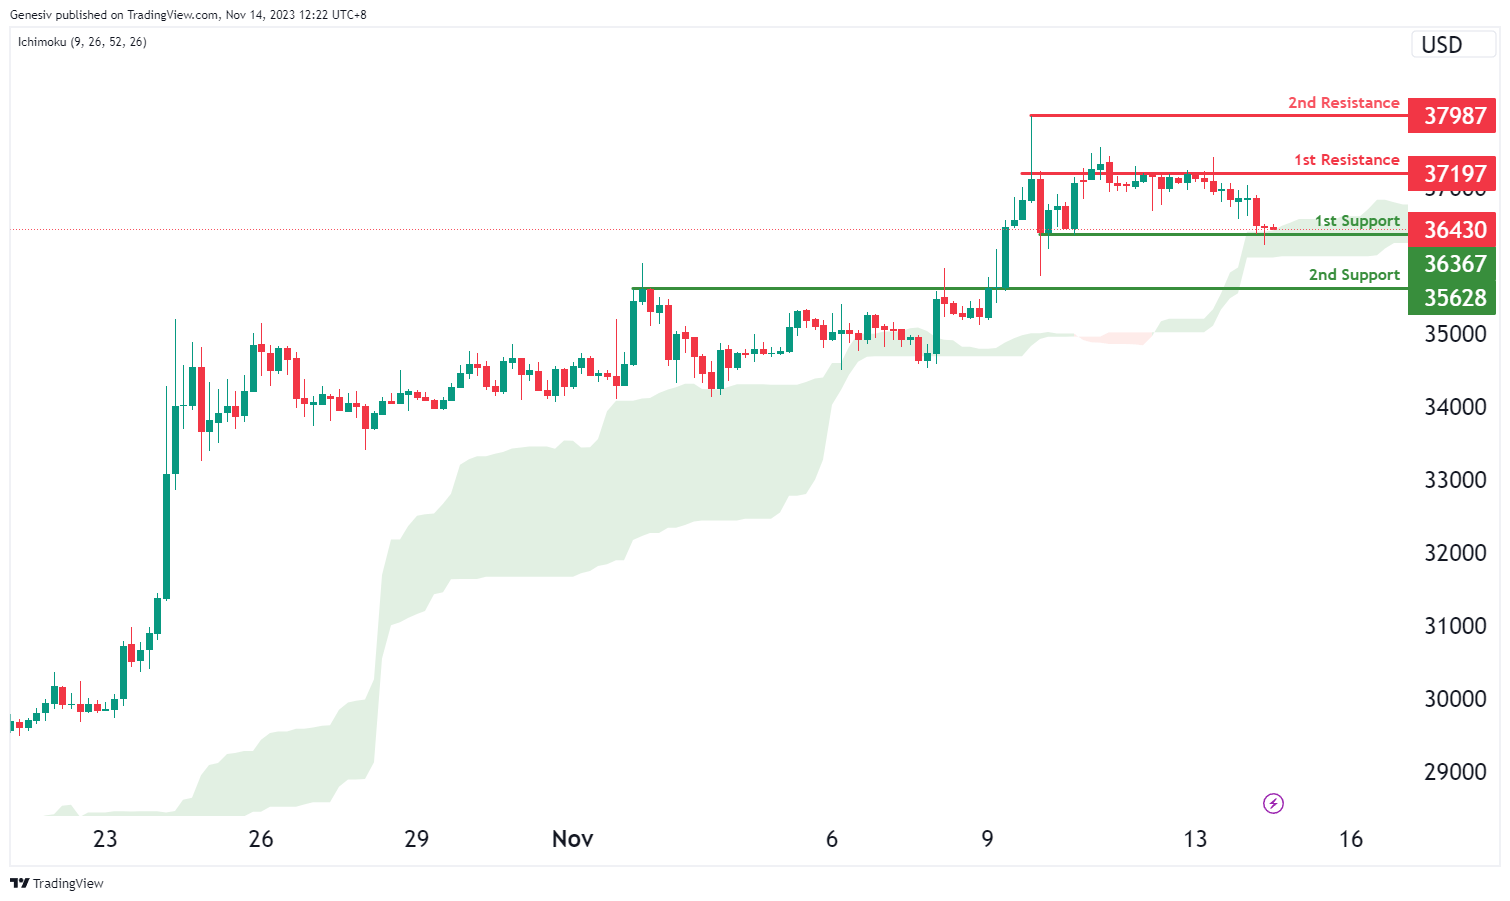
BTC/USD:
The BTC/USD chart is currently exhibiting a bullish momentum, with one of the contributing factors being that the price is above the bullish Ichimoku cloud. There’s a potential scenario where the price could make a bullish bounce off the first support level at 36367, which is identified as a multi-swing low support, and subsequently head towards the first resistance at 37197.
The second support at 35628 is recognized as a pullback support, adding to the potential strength of the support zone. On the resistance side, the first resistance at 37197 represents a point of multi-swing high resistance, indicating a significant level where the price might face hurdles. Additionally, the second resistance at 37987 is characterized by its significance as a swing high resistance, marking another potential level where the price might encounter resistance within its upward movement.
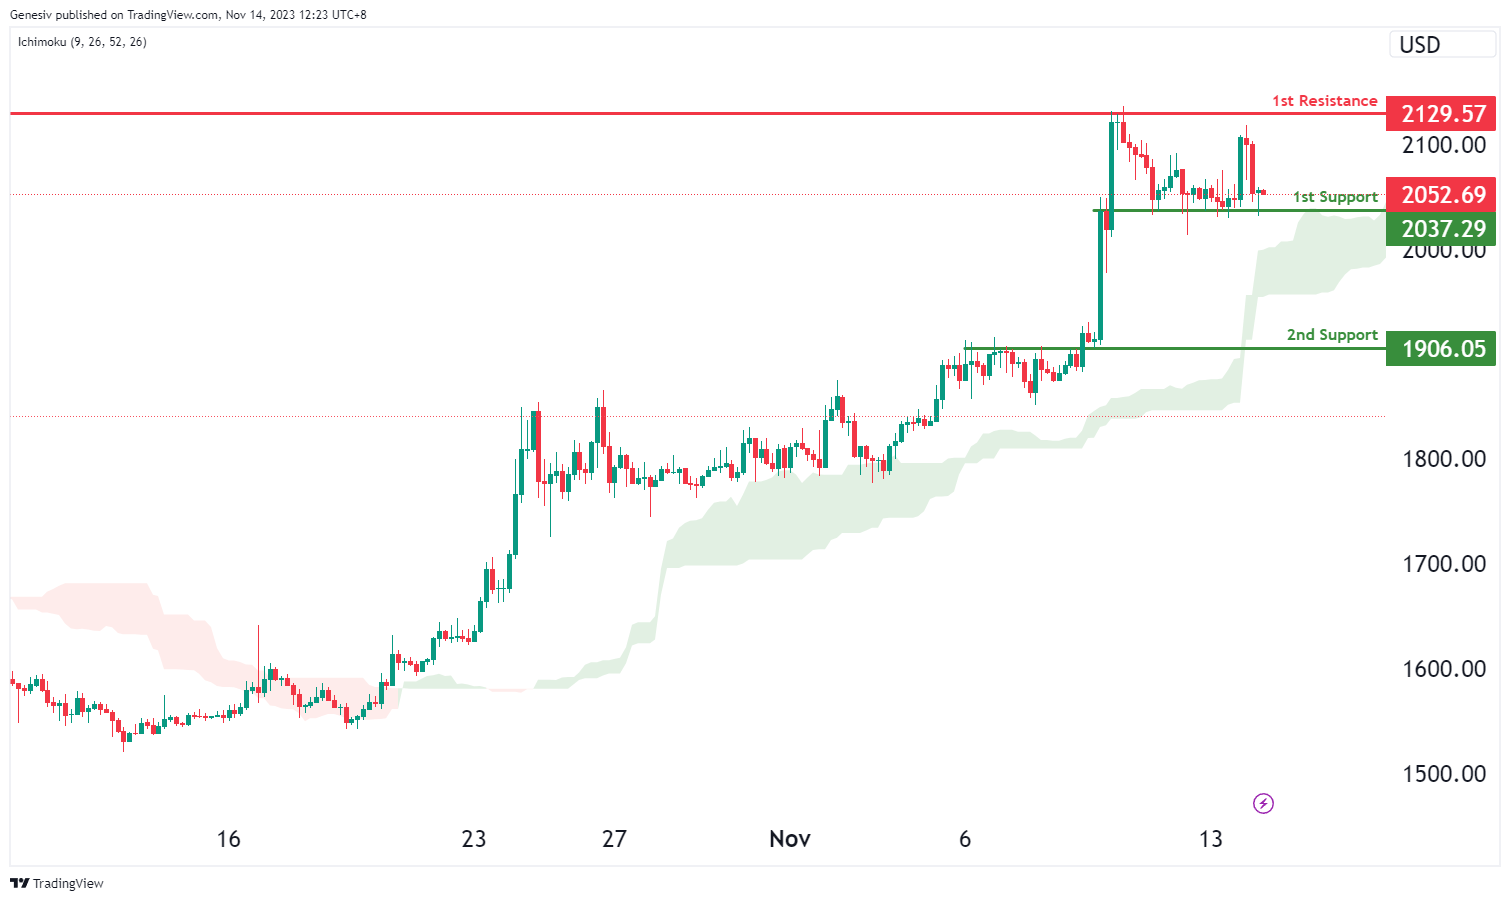
ETH/USD:
The ETH/USD chart currently displays a bullish momentum, with one of the contributing factors being that the price is above the bullish Ichimoku cloud. There’s a potential scenario where the price could make a bullish bounce off the first support level at 2037.29, identified as a pullback support, and subsequently head towards the first resistance at 2129.57.
The second support at 1906.05 is also noted as a pullback support, reinforcing the potential strength of the support zone. On the resistance side, the first resistance at 2129.57 represents a point of multi-swing high resistance, indicating a significant level where the price might encounter hurdles or reversals within its upward movement.
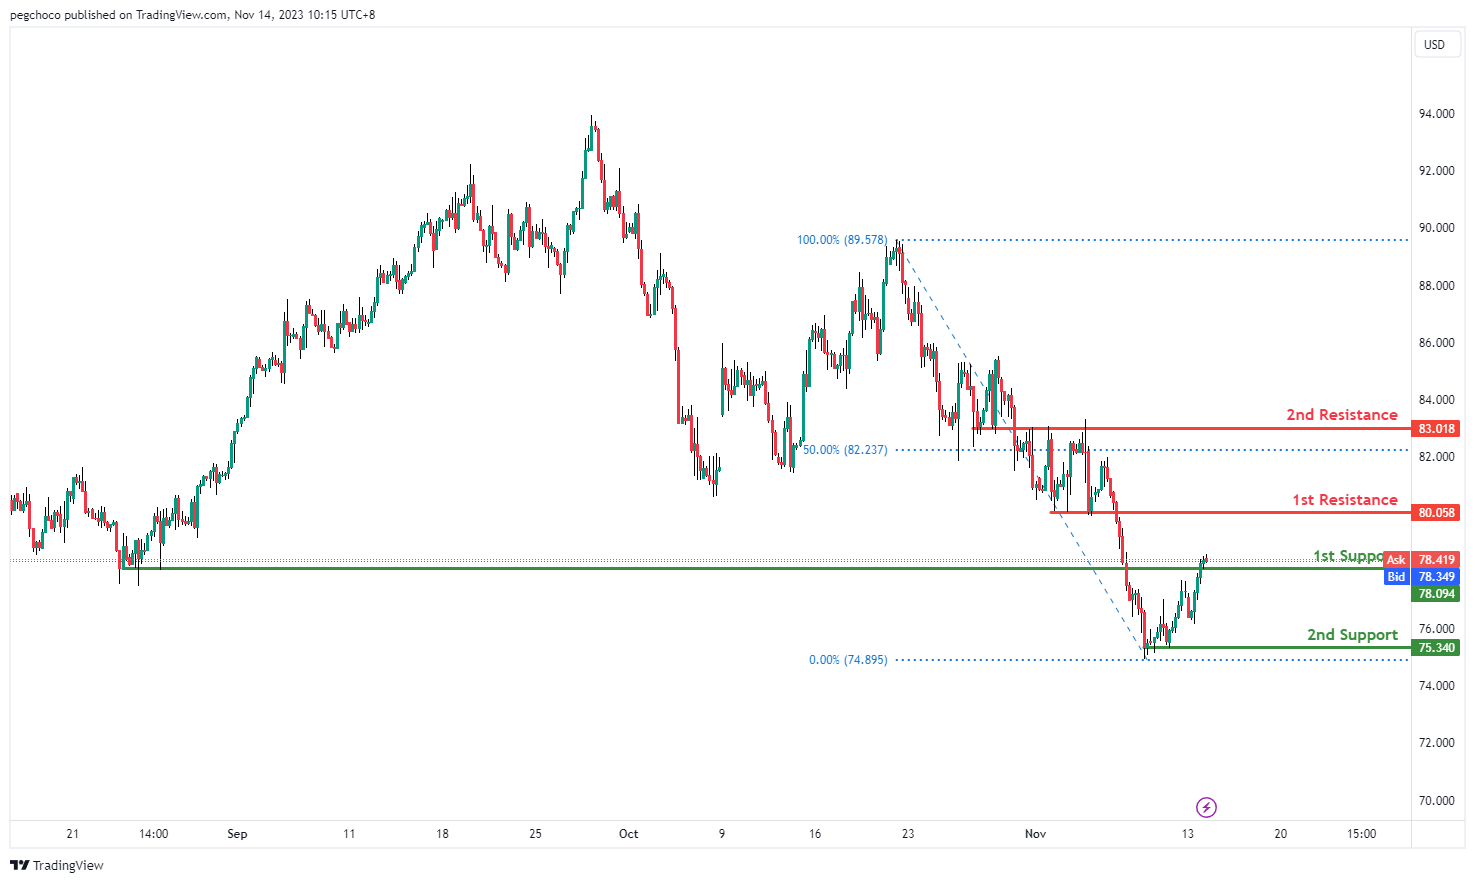
WTI/USD:
The WTI (West Texas Intermediate) chart currently shows a bullish overall momentum, suggesting the potential for further upward movement. Here are the key levels to watch:
1st support at 78.09: This support level is considered a pullback support, indicating a historical level where buyers have previously stepped in. It suggests potential support and a possible bounce from this level.
2nd support at 75.34: This level is categorized as a swing low support, signifying its historical significance as a level of buying interest.
1st resistance at 80.05: This resistance level is considered a pullback resistance and may act as a barrier to further upside movement.
2nd resistance at 83.01: This resistance level is categorized as an overlap resistance, suggesting potential strength as a barrier to further bullish movement.
XAU/USD (GOLD):
The XAUUSD (Gold/USD), the overall momentum on the chart is currently bearish. Here are the key support and resistance levels to watch:
1st support at 1932.61: This support level is considered significant as it aligns with an overlap support and the 38.20% Fibonacci retracement level. It may act as a potential area for price to find support.
2nd support at 1904.32: This support level is also notable, as it corresponds to an overlap support and the 50% Fibonacci retracement level.
1st resistance at 1946.32: This resistance level is categorized as an overlap resistance, suggesting it could serve as a barrier to upward movement.
2nd resistance at 1964.32: Similar to the 1st resistance, this level is an overlap resistance and may also act as a significant barrier.

The accuracy, completeness and timeliness of the information contained on this site cannot be guaranteed. IC Markets does not warranty, guarantee or make any representations, or assume any liability regarding financial results based on the use of the information in the site.
News, views, opinions, recommendations and other information obtained from sources outside of www.icmarkets.com, used in this site are believed to be reliable, but we cannot guarantee their accuracy or completeness. All such information is subject to change at any time without notice. IC Markets assumes no responsibility for the content of any linked site.
The fact that such links may exist does not indicate approval or endorsement of any material contained on any linked site. IC Markets is not liable for any harm caused by the transmission, through accessing the services or information on this site, of a computer virus, or other computer code or programming device that might be used to access, delete, damage, disable, disrupt or otherwise impede in any manner, the operation of the site or of any user’s software, hardware, data or property.


