
Key risk events today:
China Trade Balance; China USD-Denominated Trade Balance; US CPI m/m and Core CPI m/m.
(Italics represents previous analysis)
EUR/USD:
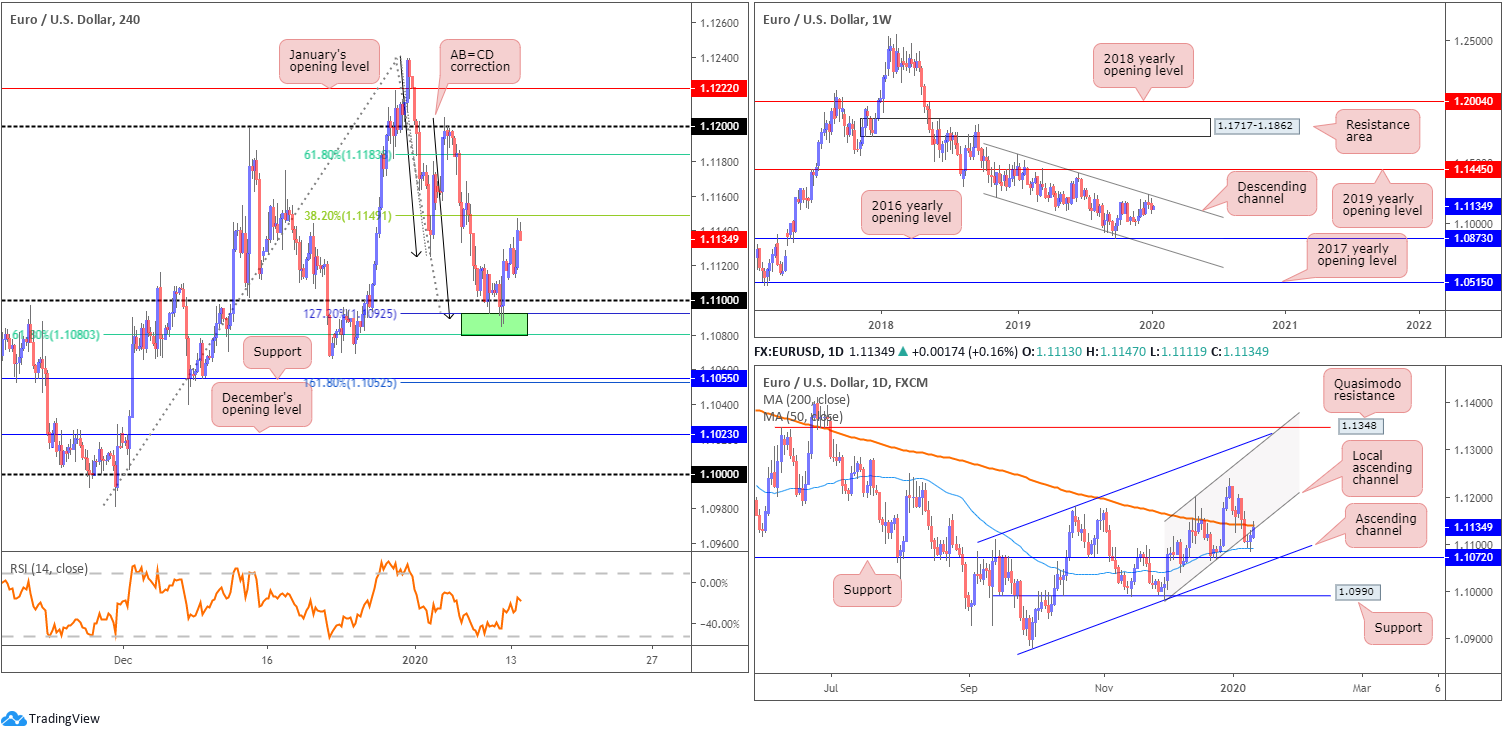
EUR/USD bulls entered an offensive phase Monday, climbing to highs of 1.1147 and extending Friday’s recovery south of the 1.11 handle.
Traders who read Friday’s report may recall the following pieces:
As of current price, buyers and sellers are squaring off a touch below the 1.11 handle on the H4 timeframe. As a result, a portion of sell stops beneath this psychological barrier have likely been tripped. Interestingly, though, the area between 1.1080/1.1092 (green), a 61.8% H4 Fibonacci retracement and a 127.2% AB=CD bullish correction, is likely to hamper downside. This, particularly for shorter-term traders, is an appealing reversal zone, given the liquidity generated from the filled sell stops. In addition to this, the setup boasts RSI (relative strength index) confirmation in the form of an oversold signal (pink).
The combination of stop-taking beneath 1.11, the H4 AB=CD reversal zone at 1.1080/1.1092, RSI confirmation and the 50-day SMA (on the daily timeframe) is likely sufficient to tempt buyers into the market today, at least for an intraday bounce higher.
Traditional AB=CD take-profit targets favour the 38.2%/61.8% Fibonacci retracements set from legs A-D, at 1.1149 and 1.1183. Traders, however, are urged to also pencil in the 1.1125 January 3rd low as possible resistance.
As evident from the H4 chart, the 38.2% Fibonacci retracement ratio at 1.1149 came within striking distance in recent hours, likely prompting longs out of 1.11 to reduce risk to breakeven and maybe even liquidate a portion of the position. Note this level converges with the 200-day SMA (orange – 1.1139) and a local daily channel support-turned resistance, extended from the low 1.0981.
As a reminder of where we stand on the weekly timeframe, here’s what Monday’s technical briefing had to say:
Technical research has weekly movement extending losses south of long-standing channel resistance, drawn from the high 1.1569. Visible downside objectives on this timeframe fall in at the 2016 yearly opening level at 1.0873 and channel support, taken from the low 1.1109. To the upside, assuming a break of the said channel resistance, price has the 2019 yearly opening level at 1.1445 to target.
In terms of the primary trend, price has been trading lower since topping in early 2018, at 1.2555.
Areas of consideration:
Should the market push beyond the 38.2% H4 Fibonacci retracement ratio at 1.1149, longs will likely have eyes on the 61.8% H4 Fibonacci retracement ratio at 1.1183 for (AB=CD pattern) completion.
In the event we drive beneath 1.11 this week, daily support resides at 1.1072, closely trailed by H4 support at 1.1055/161.8% Fibonacci extension point at 1.1052. Therefore, navigating lower ground is problematic, with limited room to manoeuvre regarding short positions unless you drill down to the lower timeframes.
GBP/USD:
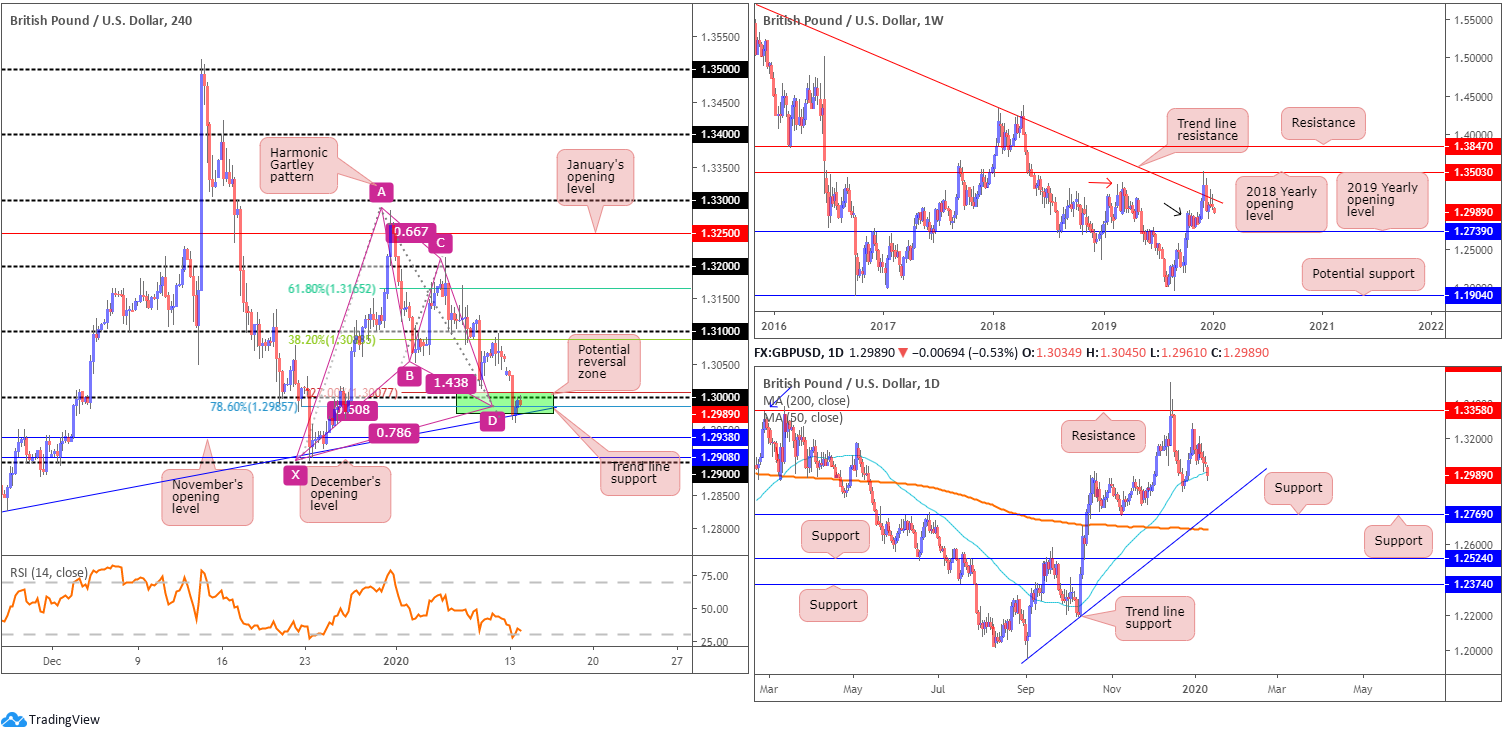
Pound sterling slipped lower Monday, pressured by lower-than-expected growth and manufacturing production data, as well as dovish comments from BoE’s Vlieghe.
- The monthly decrease of 1.7% in manufacturing output was because of downward contributions from 10 of the 13 subsectors; led by notable falls from transport equipment (3.4%), chemicals and chemical products (4.7%) and food, beverages and tobacco (1.8%).
- Monthly gross domestic product (GDP) fell by 0.3% in November 2019, driven by falls in both services and production. This followed growth of 0.1% in both September and October 2019.
(Office for National Statistics)
In terms of price action on the H4 timeframe, 1.30 gave way following weak UK data, though pared back to around the key level at the tail end of the session. Indicator-based traders may also wish to note the relative strength index (RSI) is testing oversold waters.
Traders who read recent reports may recall the following piece:
Thursday dethroned the 1.31 handle in strong fashion and bottomed a few points north of the key figure 1.30. Note (green) this level also forms together with a potential H4 harmonic Gartley pattern, boasting an AB=CD equivalent formation and a 78.6% XA retracement at 1.2985 as well as a 127.2% BC projection at 1.3007. Additionally, there’s H4 trend line support, extended from the low 1.2768.
As for the weekly timeframe, little change has been seen since Monday’s report:
Sellers, by way of back-to-back shooting star bearish candlestick patterns, continued to strengthen their grip off long-standing trend line resistance last week, pencilled in from the high 1.5930. This follows a somewhat dominant whipsaw to the 2018 yearly opening level drawn from 1.3503 four weeks ago.
Buyers are attempting to defend nearby demand around the 1.2939 region (black arrow), seduced by the recent break of the notable high at 1.3380 (red arrow). The fact we’re holding the current trend line, though, implies we might see a push lower to the 2019 yearly opening level at 1.2739, consequently tripping sell stops from any traders long the aforementioned demand zone.
The 50-day SMA (blue – 1.3006) remains reasonably dominant support on the daily timeframe, but suffered a minor breach in recent hours. Another layer of support that may eventually enter the fight is 1.2769, which happens to merge closely with trend line support, pencilled in from the low 1.1958 and the 200-day SMA (orange – 1.2687). With respect to resistance, the only level of interest right now sits at the 1.3284 December 31st high and 1.3358, which capped upside since mid-June 2019.
Areas of consideration:
The H4 Gartley pattern has an entry point around the 1.30ish region, preferably the 78.6% Fibonacci retracement at 1.2985, with stop-loss order placement set beneath the X point – the 1.29 handle. In terms of take-profit targets, traders generally favour the 38.2%/61.8% (1.3087/1.3165 assuming an upside move forms) Fibonacci retracements of legs A-D – reduce risk to breakeven at 38.2% and take-profit at 61.8%.
AUD/USD:
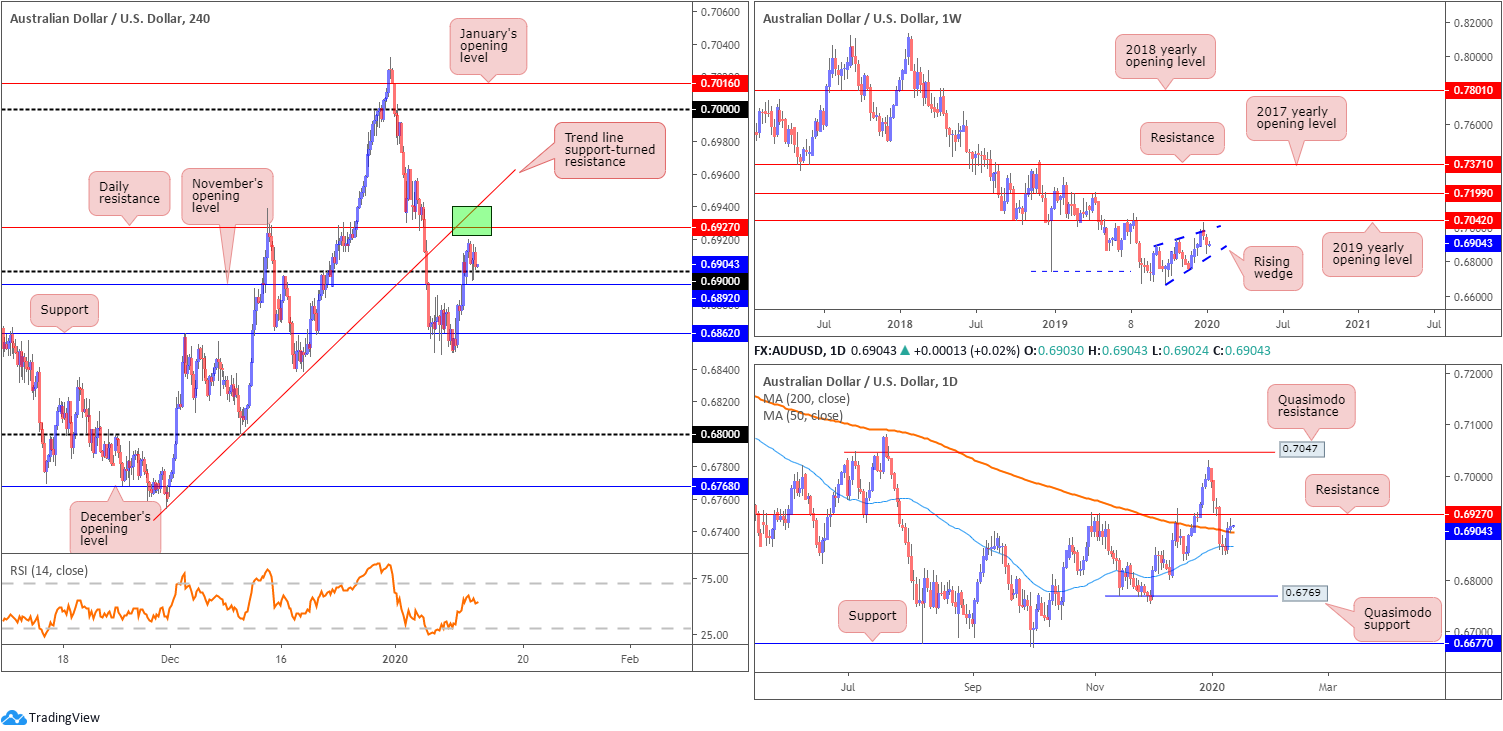
AUD/USD inched higher amid Asia Monday, two days ahead of the US and China signing the phase-one trade deal. Technically speaking, 0.69 offers support on the H4 timeframe, though resistance resides nearby in the form of a daily level at 0.6927, along with a H4 trend line support-turned resistance positioned nearby, extended from the low 0.6754. Retaking November’s opening level from current price could lead to support at 0.6862 entering the fight this week.
The situation on the weekly and daily timeframes remains unchanged:
Since registering a bottom in late September at 0.6670, AUD/USD has been busy carving out what appears to be a rising wedge formation, typically considered a continuation pattern. Recent selling witnessed price decline back into the rising wedge, with a break lower possible given the primary downtrend in this market has faced a southerly bearing since early 2018.
Withstanding a number of downside attempts, the 50-day SMA (blue – 0.6864) on the daily timeframe remained supportive last week, driving price marginally through the 200-day SMA (orange – 0.6893). Resistance lies close by at 0.6927, with a break of this level exposing the 0.7031 December 31 high and Quasimodo resistance at 0.7047. Beyond the aforementioned 50-day SMA, however, active demand seems limited until reaching Quasimodo support coming in at 0.6769.
Areas of consideration:
In a nutshell, chart studies suggest further selling on the weekly timeframe and potential selling off daily resistance at 0.6927. The daily level, alongside its closely connecting H4 trend line support-turned resistance is, therefore, an area sellers may be watching this week, targeting moves beyond the 0.69 handle.
Conservative traders may opt to wait for a H4 bearish candlestick signal to form prior to pulling the trigger; not only will this help identify seller intent, it’ll provide strict entry and risk levels to trade.
USD/JPY:
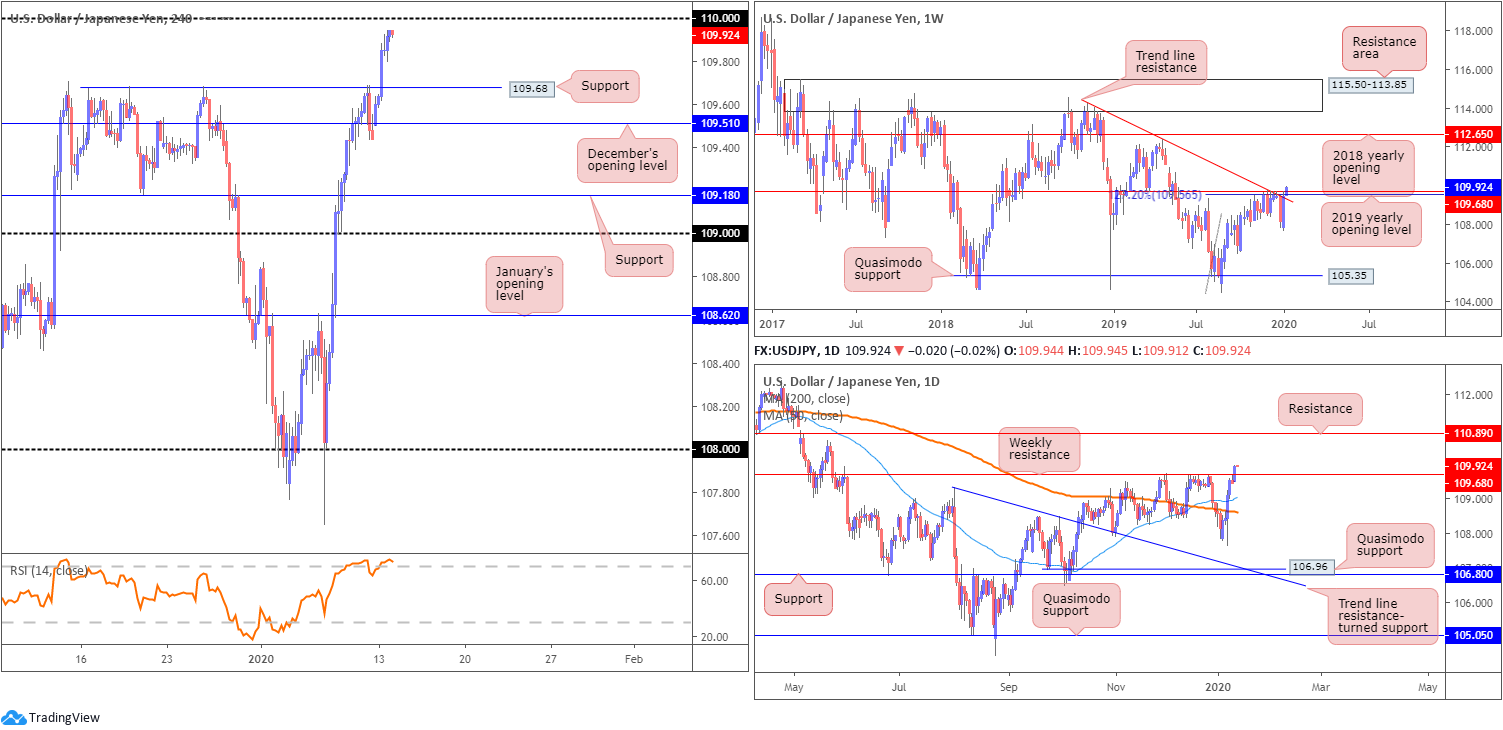
USD/JPY continued to discover higher ground Monday, adding more than 50 points, or 0.46%. Based on reports suggesting the US will remove the ‘currency manipulator’ tag on China before signing the phase-one trade deal on Wednesday stoked investor appetite; the pair clocked highs of 109.94, levels not seen since late May.
In regards to the unit’s technicals, weekly resistances (comprised of a 127.2% Fibonacci extension at 109.56 [taken from the low 104.44], the 2019 yearly opening level at 109.68 and trend line resistance, extended from the high 114.23) gave way in recent trading, perhaps setting the long-term stage for a run to the 2018 yearly opening level at 112.65.
A closer reading of price action on the daily timeframe shows price crossed weekly resistance in the shape of a near-full-bodied bullish candle. This potentially clears the river north towards resistance coming in at 110.89.
Across the page on the H4 timeframe, the 110 handle stands as the next possible resistance, after crunching through triple-top resistance at 109.68 (now a serving support). Also of note on this scale is the relative strength index (RSI) challenging overbought levels, and December’s opening level at 109.51 potentially offering support in the event of a turn lower.
Areas of consideration:
To help confirm a bullish theme north of weekly resistance at 109.68, traders may consider waiting and seeing if a break above the round number 110 occurs.
Violating 110 unlocks the door to H4 Quasimodo resistance at 110.32 (not visible on the screen). Although this offers limited room to manoeuvre, traders are likely fixed on higher-timeframe targets at 110.89 and 112.65.
Traders have the option of entering long on the close of the H4 breakout candle above 110, and positioning stop-loss orders accordingly. An alternative to this, considered a more conservative approach, is to wait for a retest to develop, preferably by way of a H4 bullish candlestick formation (entry and risk levels can be determined according to this structure), following the breakout higher.
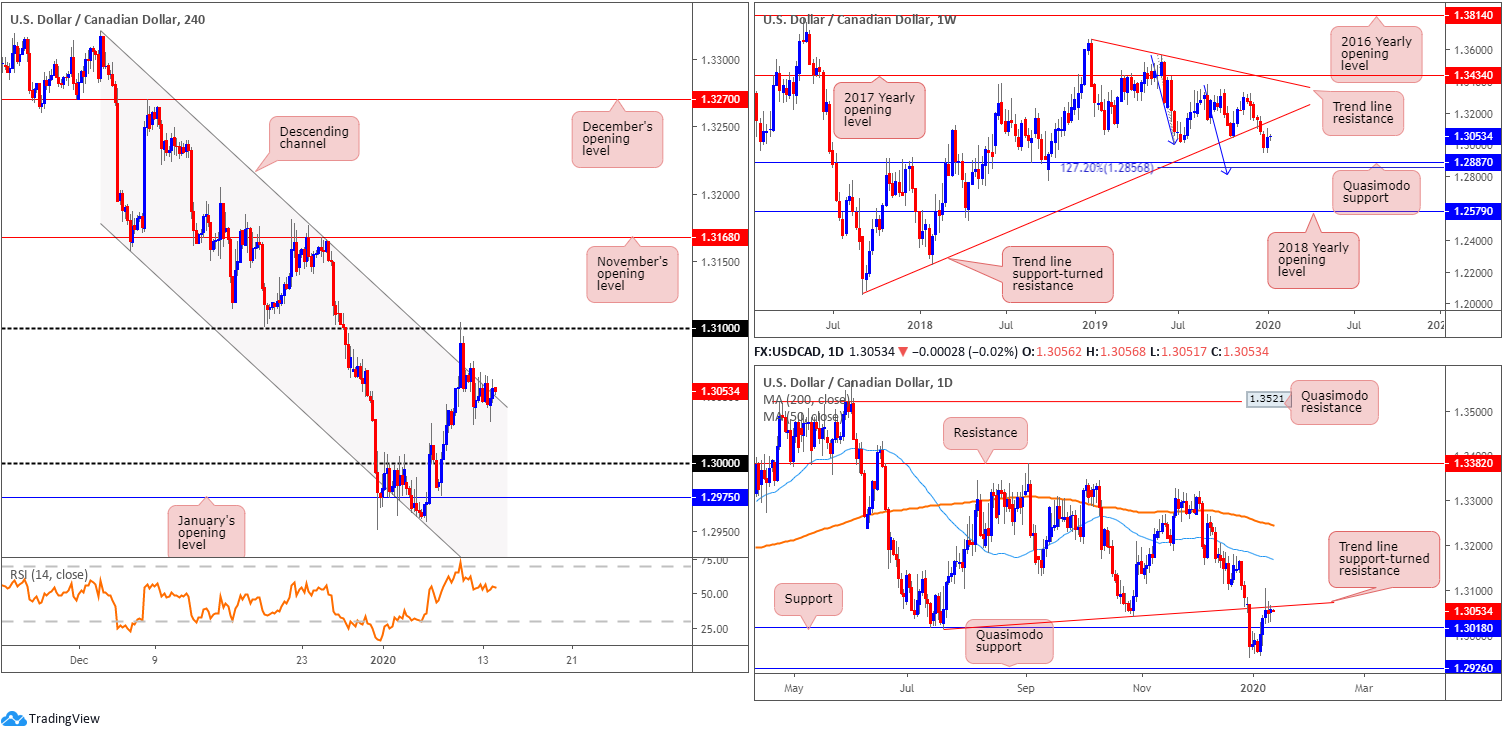
USD/CAD:
USD/CAD prices remain unmoved, fluctuating around the 1.3050 mark. Monday’s BoC business outlook survey (Q4) pointed to a broadly positive business sentiment. Overall, the firmer outlook is supported by expectations of healthy domestic and foreign sales.
Crude oil prices extended losses, registering its fourth daily loss and shaking hands with $58.00/bbl.
Technical structure on the weekly timeframe:
Despite the recent upturn, snapping a six-week long losing streak, USD/CAD continues to reflect a bearish position. After engulfing trend line support, taken from the low 1.2061, the pair exhibits scope to test Quasimodo support at 1.2887, positioned close by a 127.2% AB=CD bullish correction (blue arrows) at 1.2856. As such, 1.2856/1.2887 is likely a base active buyers reside.
The immediate trend has faced north since bottoming in September 2017; however, this move could also be considered a deep pullback in a larger downtrend from the 1.4689 peak in early January 2016.
Daily timeframe:
Thursday had daily price form a reasonably strong selling wick off trend line support-turned resistance, taken from the low 1.3015. Friday and Monday remained south of the aforementioned trend line, though formed a doji indecision candles.
Nearby support resides close by at 1.3018, with a break of this level exposing Quasimodo support at 1.2926.
H4 timeframe:
In the shape of two near-full-bodied candles, last Thursday whipsawed through channel resistance, extended from the high 1.3320, and tested the 1.31 handle. As you can see, price action remains toying with the upper edge of the said channel, though a minor close to the upside has been seen. Whether this indicates we’re heading back to 1.31 is difficult to judge at this point.
Areas of consideration:
Traders considering a short position based on the current H4 channel resistance, as well as the daily trend line resistance in motion and room seen to move lower on the weekly timeframe, may want to wait for more of a decisive move off the said channel resistance before pulling the trigger.
In terms of downside targets, daily support drawn from 1.3018 is a logical starting point, followed by the key figure 1.30 on the H4 timeframe and then January’s opening level at 1.2975.
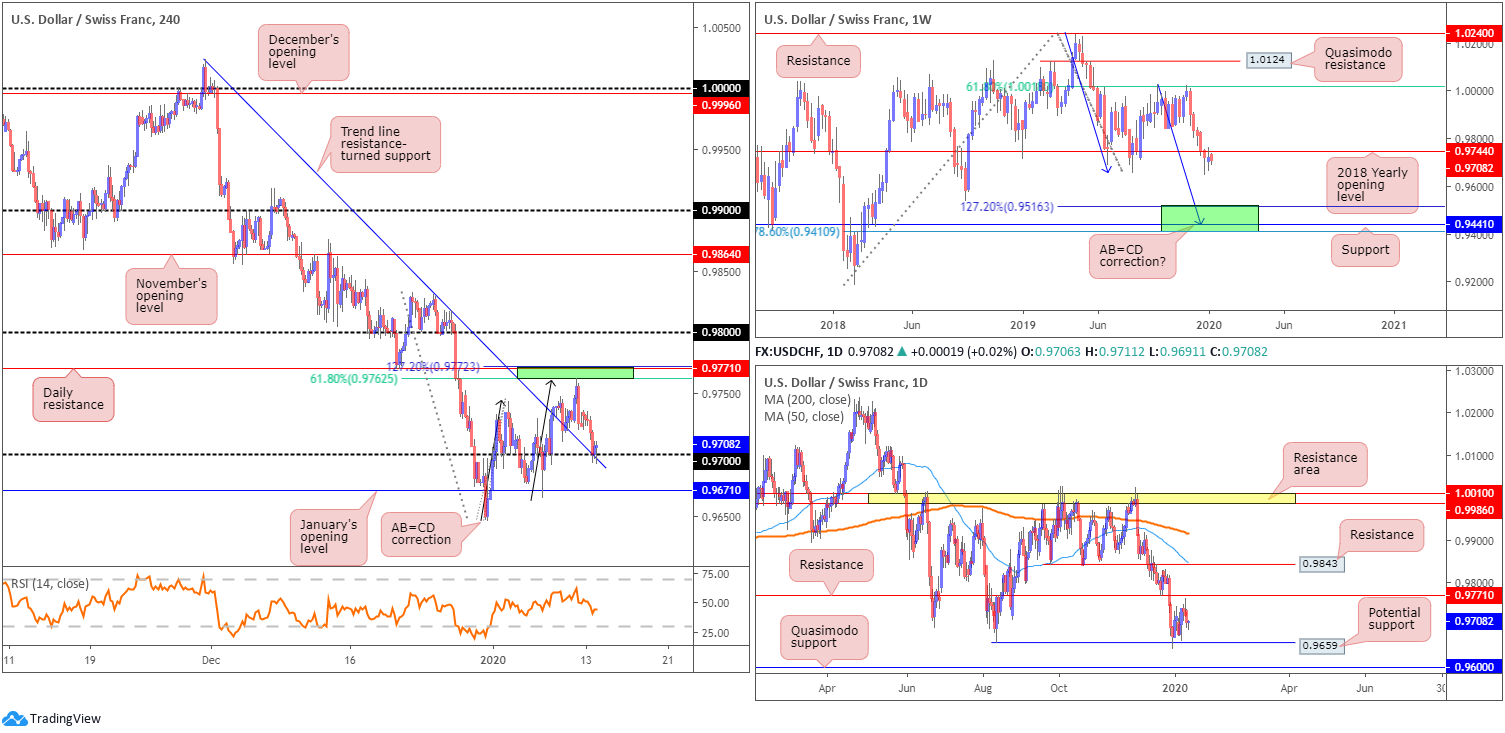
USD/CHF:
Despite declines visible in yen and gold, the Swiss franc continued to strengthen Monday, guiding USD/CHF to the 0.97 handle and H4 trend line resistance-turned support, extended from the high 1.0023.
For those who read recent analysis you may recall the following pieces:
Daily resistance at 0.9771. Note this level merges closely with a 127.2% H4 AB=CD bearish correction (black arrows) at 0.9772 and a 61.8% H4 Fibonacci resistance at 0.9762 (green). Also notable is the weekly timeframe: the 2018 yearly opening level at 0.9744 is currently in motion.
As evident from the H4 chart, Friday struck the lower edge of 0.9772/0.9762 and turned lower, aided by the release of less-than-stellar US employment data.
Areas of consideration:
Traders short from 0.9772/0.9762 have likely reduced risk to breakeven and took partial profits in view of 0.97 entering the fold.
Based on higher-timeframe structure, additional selling could be on the cards until we reach 0.6959 on the daily timeframe (the weekly timeframe has a downside target sitting in the range of 0.9410/0.9516 [comprised of a 78.6% Fibonacci retracement at 0.9410, support at 0.9441 and a 127.2% AB=CD bullish correction [black arrows] at 0.9516 – green]), therefore holding a portion of the position open, targeting January’s opening level at 0.9671 and 0.6959 is an option.
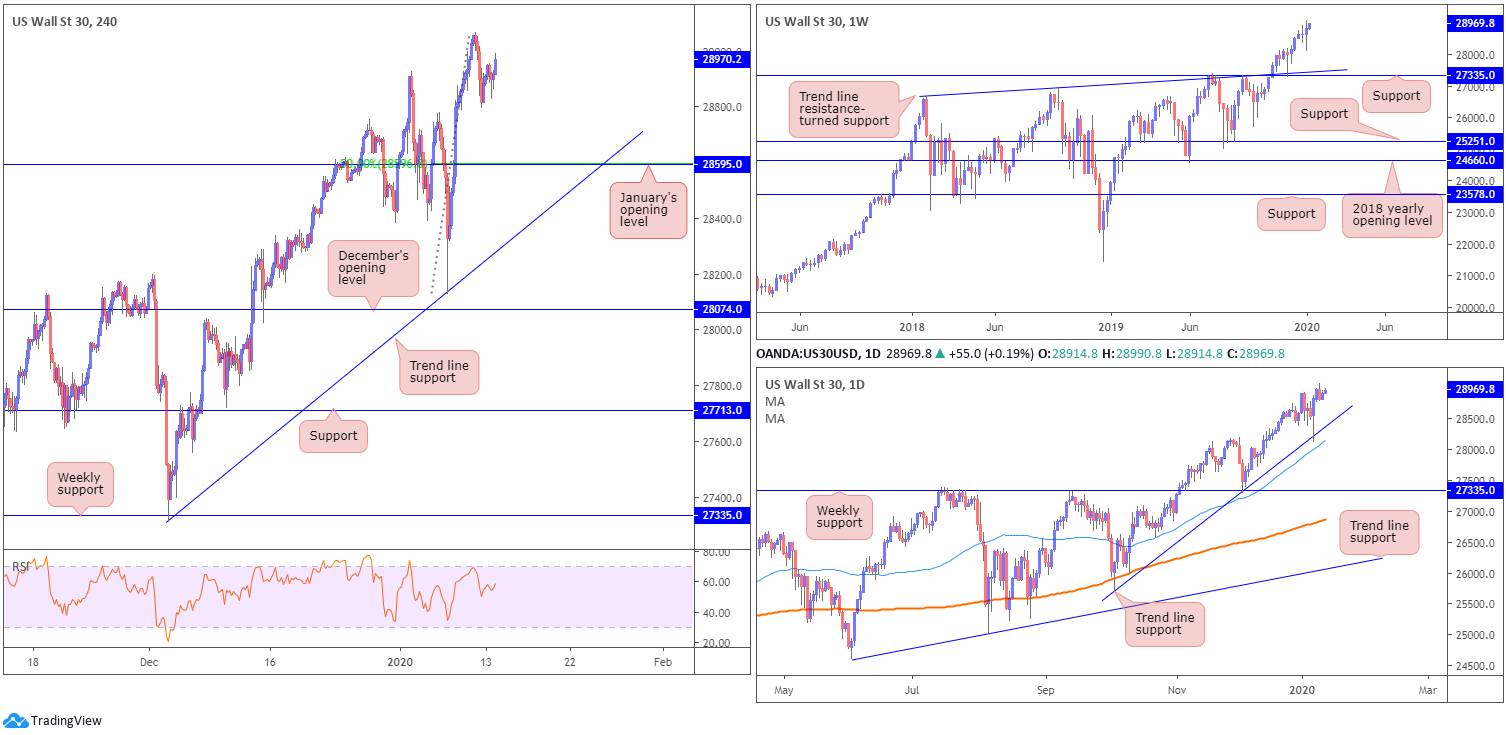
Dow Jones Industrial Average:
US stocks firmed across the board Monday, with the S&P 500 and Nasdaq clinching fresh records. Gains are largely attributed to the planned signing of a phase one US/China trade deal later in the week. The Dow Jones Industrial Average advanced 83.28 points, or 0.29%; the S&P 500 climbed 22.78 points, or 0.70% and the tech-heavy Nasdaq 100 added 104.01 points, or 1.16%.
Technical research on the weekly timeframe enters Tuesday unchanged:
Following a weekly hammer candlestick pattern (considered a buy signal at troughs), formed six weeks back at the retest of support drawn from 27335, along with trend line support etched from the high 26670, the index continued to advance higher, testing fresh record peaks of 29065 last week.
Candlestick traders may also wish to note the week ended in the form of a bullish outside pattern, eclipsing three weeks’ worth of previous action.
The daily timeframe also displays unchanged analysis:
Meanwhile, on the daily timeframe, trend line support, extended from the low 25710, entered the fray, bolstered by additional support located nearby from the 50-day SMA (blue – 28147).
H4 perspective:
Friday’s low 28796 remains unchallenged, as the candles approach the all-time high 29065. In the event of a move lower occurring before we test the said highs, aside from Friday’s low, a possible retest at January’s opening level from 28595 may develop, which happens to align with a 50.0% retracement ratio.
Areas of consideration:
With the uptrend remaining strong, and daily price recently shaking hands with trend line support, traders have eyes on a break of all-time highs. This will trigger breakout buy stops and likely pull prices higher. For those not comfortable buying based on the breakout candle’s close, the alternative is to wait and see if a retest occurs before committing funds. A turn lower, on the other hand, and January’s opening level from 28595 may serve as a platform for buyers seeking a buy-the-dip scenario this week.
Conservative traders wishing to add a little more confirmation to the mix may wait and see if a H4 bullish candlestick pattern forms before committing (confirmation techniques will, of course, be trader dependent). This helps recognise intent to take things higher and provides structured entry and risk levels to work with, making risk/reward calculations easier.
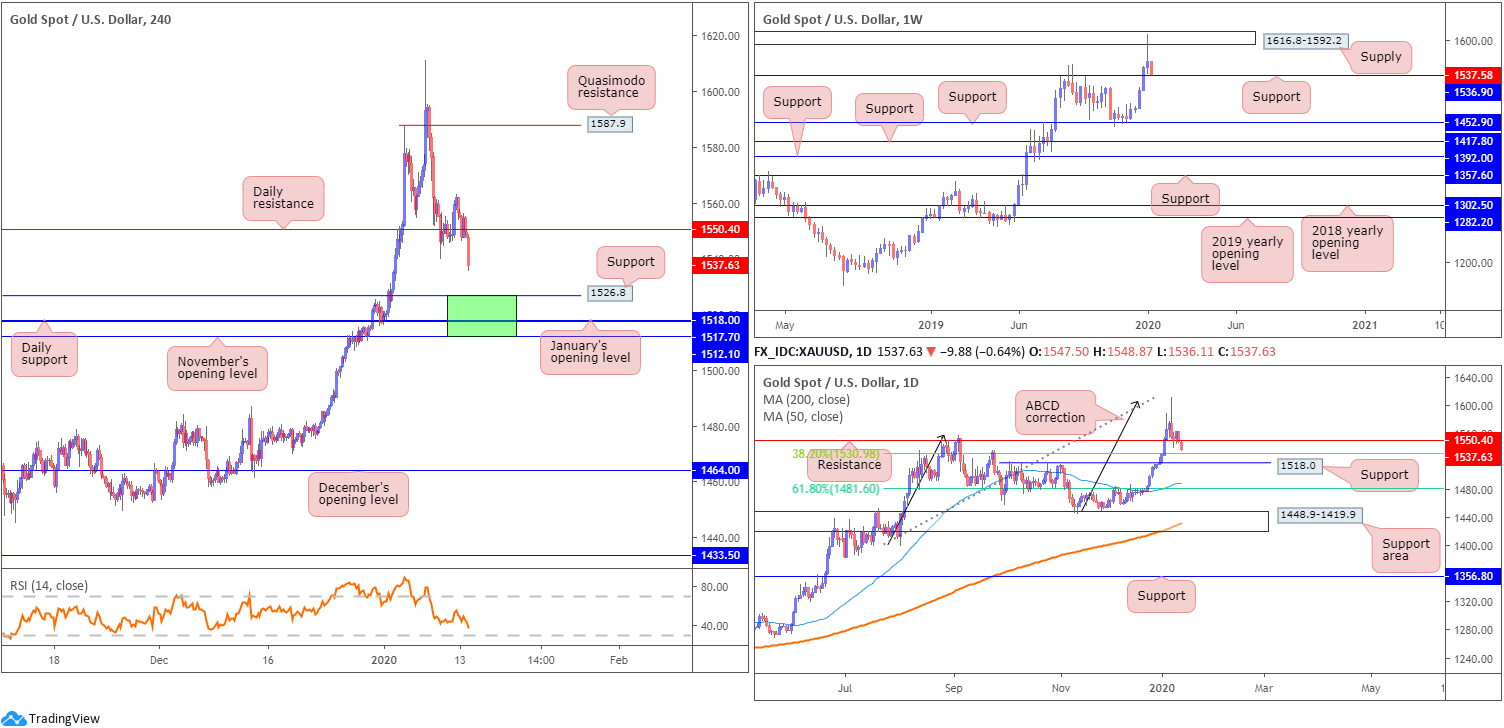
XAU/USD (GOLD):
XAU/USD encountered fresh supply Monday, despite an earnest attempt to lift things higher Friday. Fading safe-haven demand drew price south of daily support at 1550.4 (now serving as resistance), underlining the possibility of an approach to H4 support at 1526.8 forming, closely shadowed by daily support at 1518.0, January’s opening level at 1517.7 and November’s opening level at 1512.1.
Before reaching the aforementioned supports, however, traders must acknowledge weekly support resides close by at 1536.9. Another potential point of support worth bearing in mind is the 38.2% daily Fibonacci retracement at 1530.9 (of legs A-D), which likely forms the initial take-profit target for traders short the recently produced ABCD bearish correction (black arrows) at 1608.0.
Areas of consideration:
While selling beneath daily resistance at 1550.4 is appealing on the H4 timeframe, the threat of buyers making an appearance off weekly support at 1536.9 is likely enough to deter selling.
Therefore, the area between November’s opening level at 1512.1 and H4 support at 1526.8 (daily support at 1518.0 and January’s opening level at 1517.7 seen within) may be an area worth watching for signs of buyer intent. Not only does it boast a strong mix of confluence, the support zone forms in line with the primary trend. The first point of concern (resistance) from the said support area can be seen at the current daily resistance at 1550.4.
The accuracy, completeness and timeliness of the information contained on this site cannot be guaranteed. IC Markets does not warranty, guarantee or make any representations, or assume any liability regarding financial results based on the use of the information in the site.
News, views, opinions, recommendations and other information obtained from sources outside of www.icmarkets.com.au, used in this site are believed to be reliable, but we cannot guarantee their accuracy or completeness. All such information is subject to change at any time without notice. IC Markets assumes no responsibility for the content of any linked site.
The fact that such links may exist does not indicate approval or endorsement of any material contained on any linked site. IC Markets is not liable for any harm caused by the transmission, through accessing the services or information on this site, of a computer virus, or other computer code or programming device that might be used to access, delete, damage, disable, disrupt or otherwise impede in any manner, the operation of the site or of any user’s software, hardware, data or property.


