
Key risk events today:
Australia NAB Business Confidence; China Trade Balance; G7 Meetings.
(Previous analysis as well as outside sources – italics).
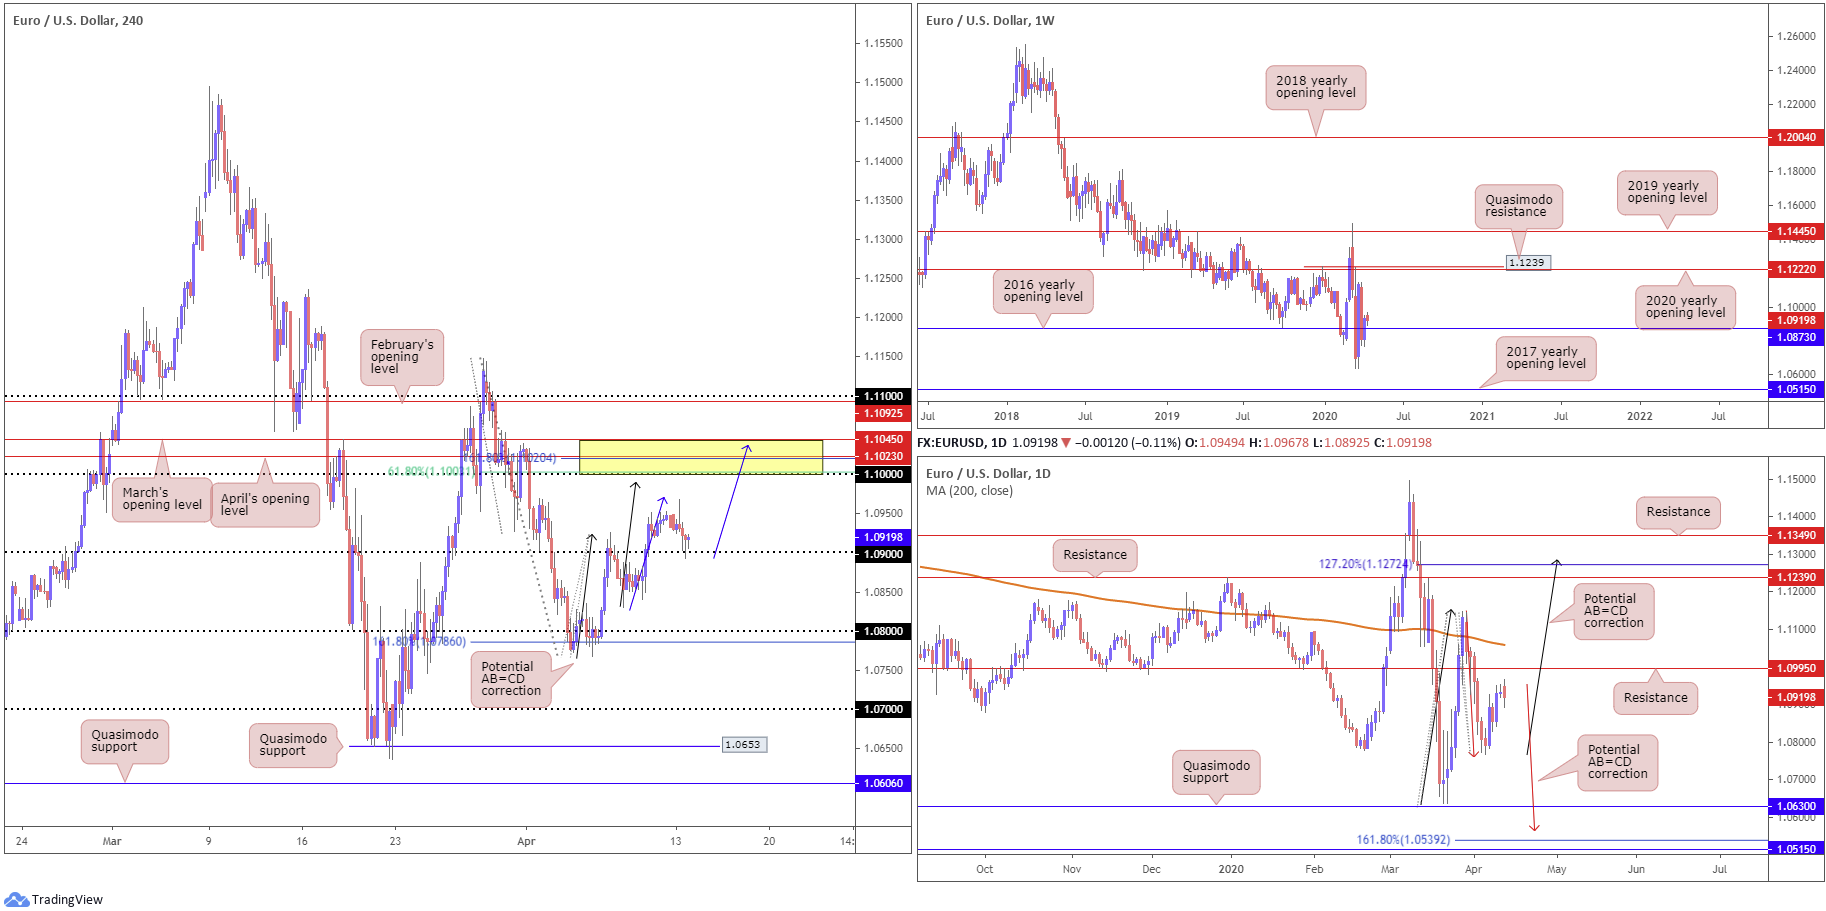
EUR/USD:
Monday’s holiday-thinned trade witnessed Europe’s single currency conclude a shade lower against the buck, with price drawing in the 1.09 handle on the H4 timeframe and forming a hammer candlestick pattern (considered a bullish signal at troughs). Follow-through buying from 1.09 has the 1.1045/1.10 (yellow) area of resistance in sight. 1.1045/1.10 is comprised of March and April’s opening levels at 1.1045 and 1.1023, a 161.8% Fibonacci extension point at 1.1020, a 61.8% Fibonacci retracement at 1.1003 and the key figure 1.10. What’s also notable, assuming we hold off 1.09, is the two possible H4 AB=CD corrections (black/blue arrows) at 1.0991 and 1.1038.
Further afield, weekly price recently conquered the 2016 yearly opening level at 1.0873. Skies beyond here are reasonably blue; a run to the 2020 yearly opening level at 1.1222, shadowed by a Quasimodo resistance at 1.1239.
From the daily timeframe, however, resistance resides at 1.0995, followed by the 200-day SMA (orange – 1.1059). Beyond the said structures, harmonic traders will also note a potential 127.2% AB=CD correction (black arrows) at 1.1272, sited a few points north of resistance priced in at 1.1239. In the event of a downturn, Quasimodo support is seen at 1.0630, with a violation revealing a potential 161.8% AB=CD correction at 1.0539.
Areas of consideration:
For those who read Monday’s report you may recall the following piece:
Should we pullback from current prices, a retest at 1.09 is also feasible which could, owing to room seen on the higher timeframes to advance, provide a platform for buyers. Upside targets from this region are, logically speaking, likely set around the 1.10ish region.
The H4 hammer candlestick pattern formed off 1.09 may entice buyers into the market today.
The H4 resistance at 1.1045/1.10, as highlighted above, contains a number of key levels, offering buyers a take-profit target and sellers a location to consider shorting opportunities. What’s also notable is daily resistance at 1.0995 converges close by, adding to its bearish presence.
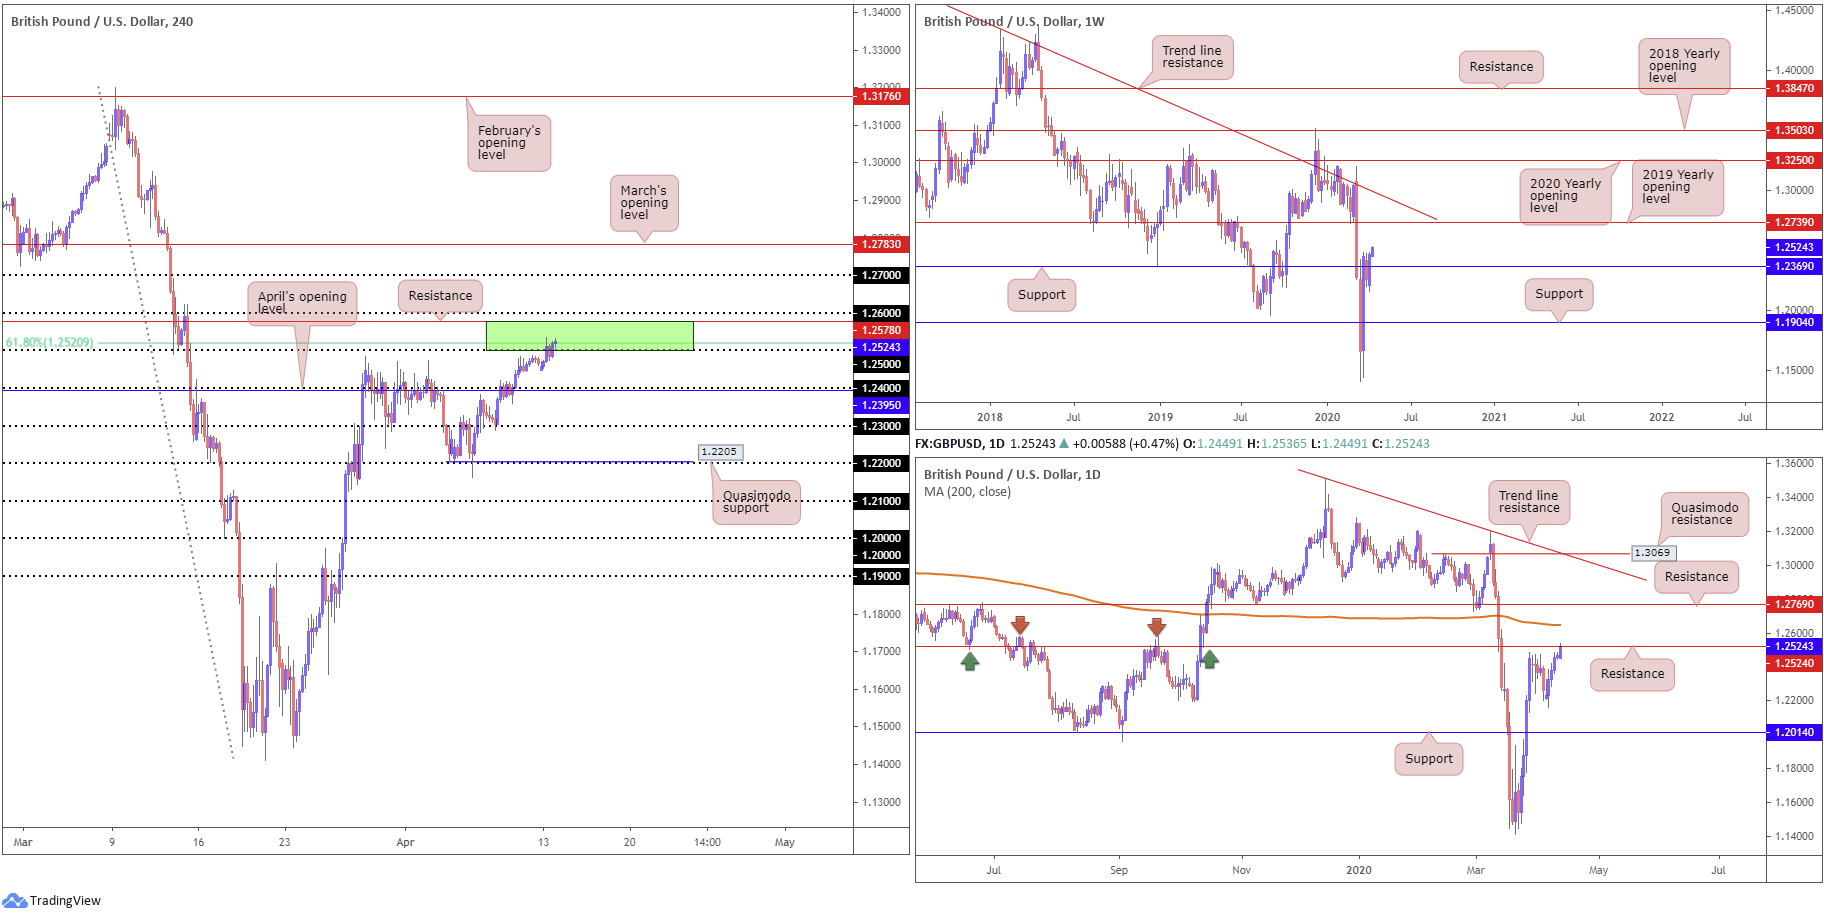
GBP/USD:
Kicking things off from the bigger picture this morning, we can see weekly price making headway north of support at 1.2369, with the possibility of 1.2739 making an appearance this week, the 2019 yearly opening level. This is followed closely by long-term trend line resistance, taken from the high 1.5930.
While weekly price displays scope to press higher, daily price movement shook hands with resistance at 1.2524 on Monday, a level boasting strong historical significance (arrows). It’s also worth pointing out we have a 200-day SMA (orange – 1.2647) lurking nearby, which, since mid-March, has been drifting lower.
Across the page on the H4 timeframe, GBP/USD extended recovery gains Monday, guiding the pair into 1.25/1.2578 (comprised of the 1.25 handle, a 61.8% Fibonacci retracement at 1.2520 and resistance from 1.2578). This remains an interesting technical base, having seen the daily timeframe also plot resistance around 1.2524.
Areas of consideration:
1.25/1.2578, based on the H4 timeframe, is a potentially significant area for sellers, housing a number of key technical resistances. 1.24, according to chart studies presented here, represents a logical downside target in the event we head for lower ground from here.
Moves through 1.26, nevertheless, shines the spotlight on the 200-day SMA as the next possible hurdle, followed by 1.27.
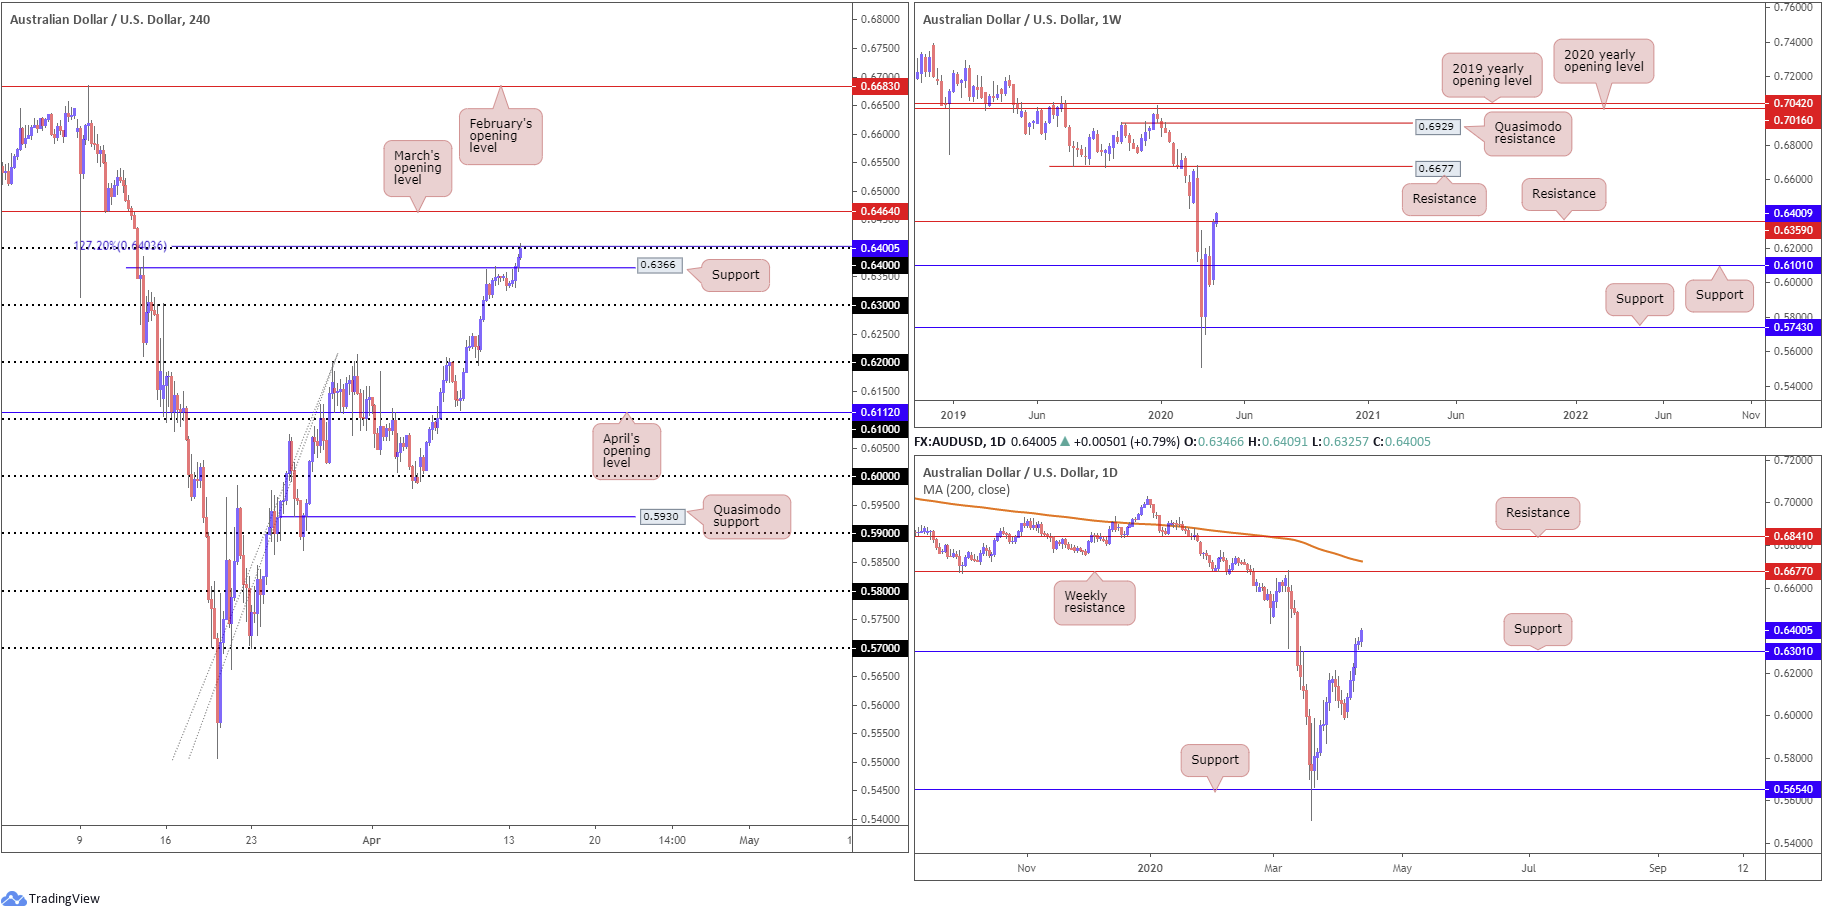
AUD/USD:
Shaped by way of a near-full-bodied bullish weekly candle, the AUD/USD quote put up healthy gains last week, gleaning support on the back of the dollar’s demise. Early trade this week has seen weekly price cross resistance at 0.6359, with history dating as far back as the year 2000.
The story on the daily timeframe, however, can see the bulls establishing a presence above support at 0.6301. This certainly places a question mark on the validity of weekly resistance at 0.6359. In fact, many may see this as the forerunner to moves towards weekly resistance at 0.6677 – the next upside target on the weekly timeframe.
Monday’s action, based on the H4 timeframe, crossed paths with the 0.64 handle which happens to merge closely with a 127.2% Fibonacci extension point at 0.6403. Intraday traders will also likely note March’s opening level at 0.6464.
Areas of consideration:
The fact we’re exploring higher ground above higher-timeframe resistances, H4 sellers off 0.64 may have a hard time bringing things lower. The most we’re likely to achieve off 0.64 is 0.6366, a previous Quasimodo resistance level.
Breakout buying above 0.64, therefore, is an option, targeting March’s opening level at 0.6464 as an initial target. Conservative traders will likely seek a retest off 0.64 prior to pulling the trigger, with some also potentially opting for additional candlestick confirmation.
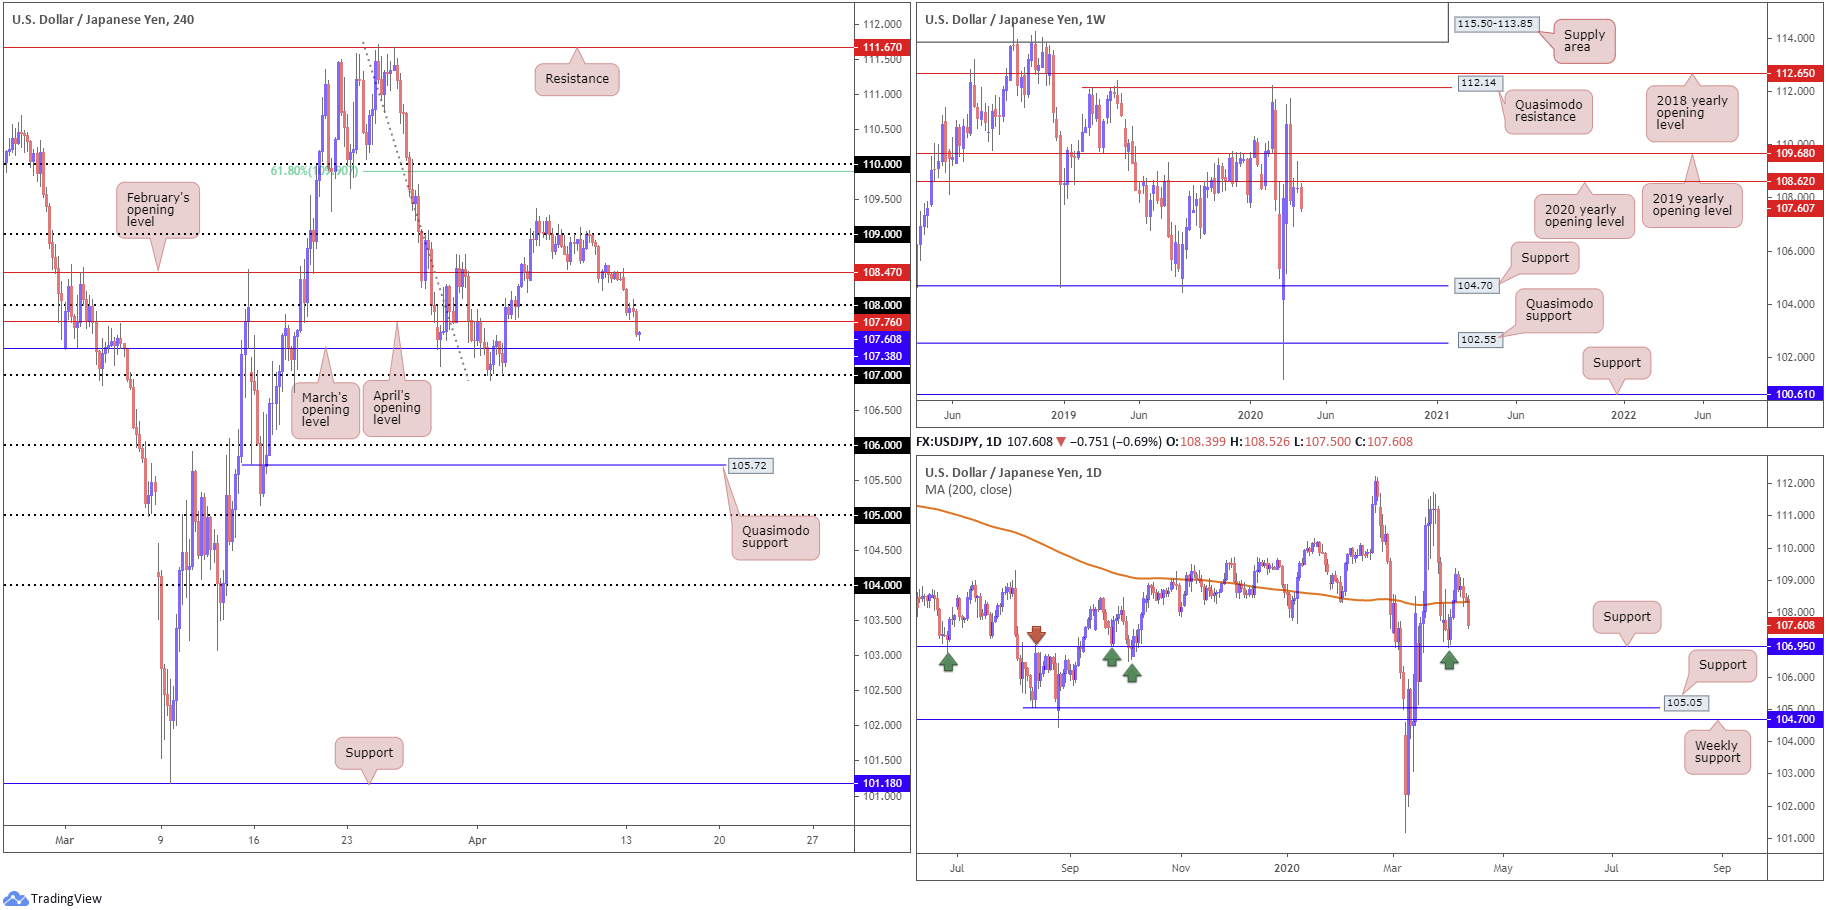
USD/JPY:
A modest decline in the US dollar index, as well as Wall Street wrapping up in negative territory, sent USD/JPY more than 80 points lower Monday.
Technically speaking from the weekly timeframe, price action concluded last week by way of a clear-cut shooting star candlestick configuration off the 2020 yearly opening level at 108.62, therefore recent selling should not have really surprised. The next downside target is not seen until 104.70. Note this figure also represents the lower boundary of a multi-month range between Quasimodo resistance at 112.14.
From the daily timeframe, the pair recently overwhelmed a 200-day SMA (orange – 108.33); traders will be watching for a run to support coming in at 106.95 going forward, a level emphasising strong history (arrows).
Against the backdrop of higher-timeframe movement, H4 price broke and retested 108 before engulfing April’s opening level at 107.76. This left traders with March’s opening level at 107.38 as potential support today, closely shadowed by 107.
Areas of consideration:
Weekly price suggesting lower levels, as well as daily flow eyeing support at 106.95, may witness another wave of selling materialise today, targeting the 107 handle.
Breakout sellers from current price may have to work with a tight stop-loss in order to achieve reasonable risk/reward to 107. Alternatively, a retest at 108/107.76 could be an option if we see a pullback today.
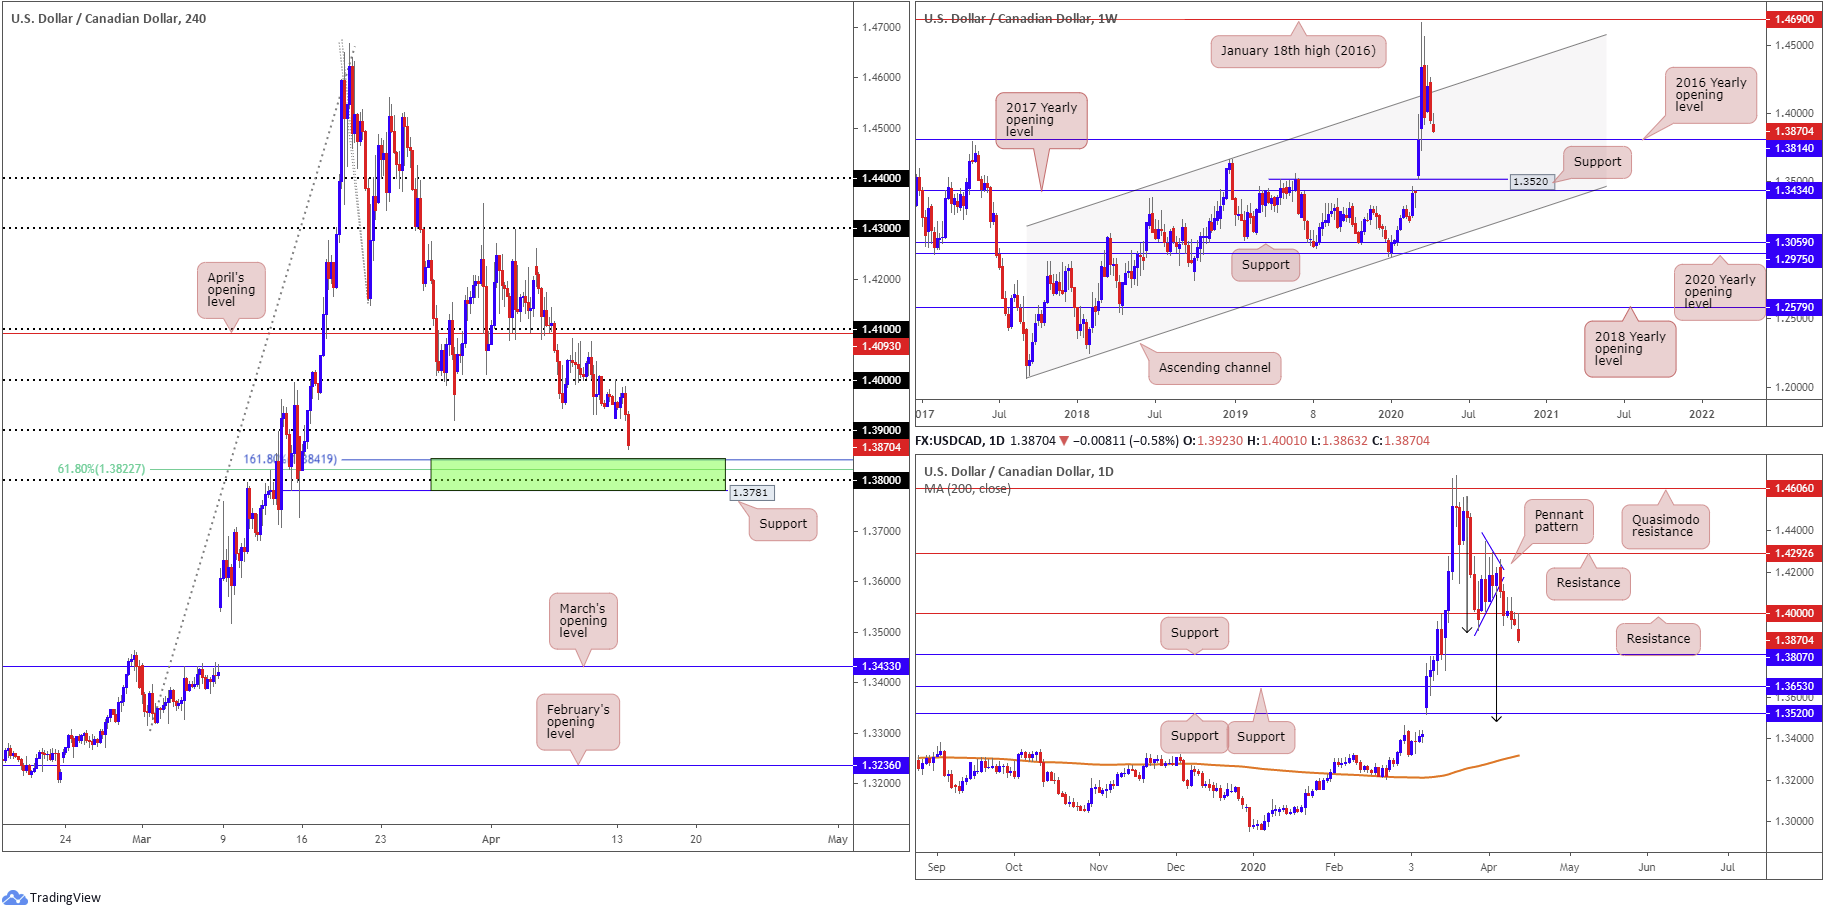
USD/CAD:
Last week’s session ended in the form of a weekly bearish engulfing candle. Technical studies also show space south of a channel resistance, extended from the high 1.3661, with the 2016 yearly opening level at 1.3814 noted as a possible downside target.
Pattern traders on the daily timeframe will recognise the recently formed bearish pennant formation (1.4349/1.4011) had its lower edge breached. With support at 1.4000 (now labelled resistance) cleared, support at 1.3807 is next in line. The take-profit target for the bearish pennant pattern, however, is set around 1.3482, measured by taking the preceding move prior to the pattern formation and adding this value to the breakout point (black arrows). This implies the support at 1.3807 and 1.3653 may give way.
In recent hours on the H4 timeframe, price movement nosedived through 1.39, clocking lows of 1.3863. This has firmly placed a support zone at 1.3781-1.3841 in the limelight (comprised of a H4 support level at 1.3781, the 1.38 handle, a 61.8% Fibonacci retracement ratio at 1.3822 and a 161.8% Fibonacci extension point at 1.3841 [green zone]).
Areas of consideration:
Having seen daily price recently break out of a bearish pennant formation, with plenty of room to the downside until crossing swords with its take-profit target around 1.3482, traders will be looking for lower prices to materialise.
However, after breaking 1.39, weekly price is nearing 1.3814. This, housed within the H4 support area highlighted above in bold, may be enough to hamper downside and provide buyers a platform to chalk up a recovery today.
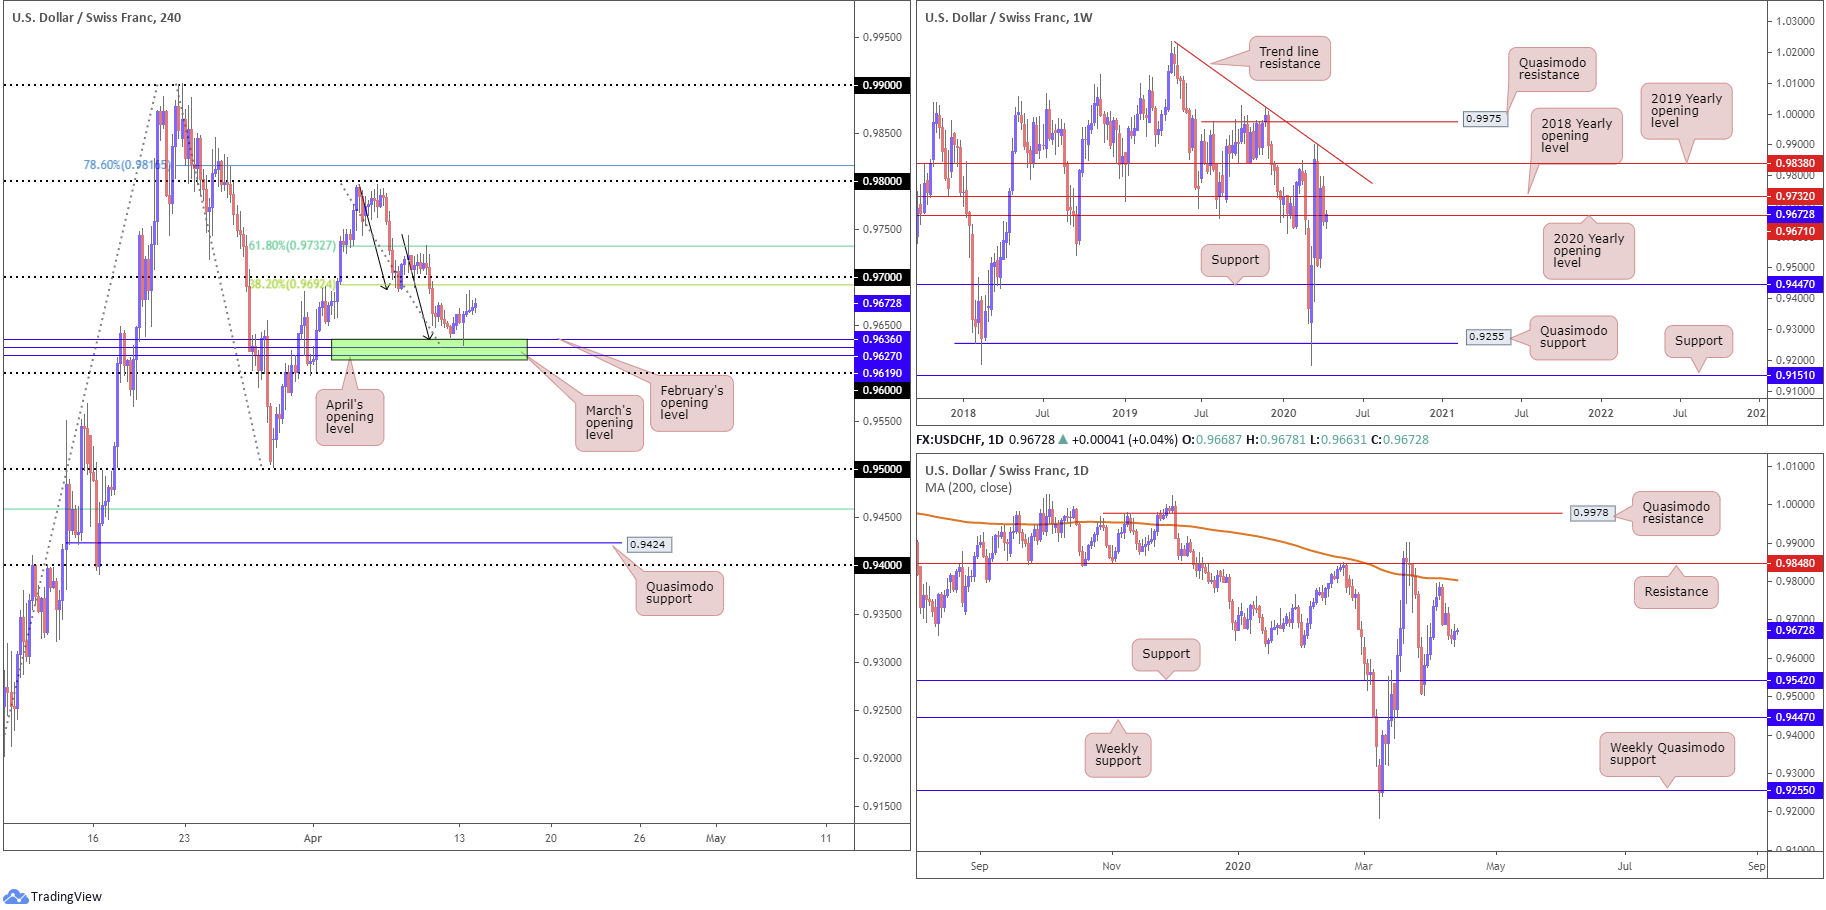
USD/CHF:
Into London hours on Monday, USD/CHF crossed swords with an interesting area of H4 support, comprised of monthly opening levels from April, March and February at 0.9619, 0.9627 and 0.9636, respectively. Yesterday’s advance from this base, shaped in the form of a hammer candle (bullish signal), reached highs of 0.9686 and produced back-to-back shooting star candles (bearish signals) ahead of the 0.97 handle. Also note, the initial approach towards 0.9619/0.9636, south of 0.98, formed by way of an ABCD formation (black arrows). Therefore, we could at least reach the 38.2% Fibonacci retracement at 0.9692 (considered the first take-profit target out of ABCD corrections) today, perhaps followed by the 61.8% Fibonacci retracement at 0.9732.
Higher up on the curve, weekly price is seen grasping the underside of the 2020 yearly opening level at 0.9671. with the 2018 yearly opening level seen close by at 0.9732. The story on the daily timeframe had price action pencil in a bullish engulfing candle Monday. Resistance on this timeframe is not expected to emerge until the 200-day SMA (orange – 0.9803) while support comes in at 0.9542.
Areas of consideration:
Buying pressure out of the H4 support zone 0.9619/0.9636 is capped by the 2020 yearly opening level at 0.9671 on the weekly timeframe. Therefore, despite the daily bullish engulfing candle, it is unlikely we’ll make it much past 0.97. This implies sellers may be in the driving seat; short sales off 0.97 could be an option today, given the number closely connects with the 38.2% Fibonacci retracement on the H4 timeframe. Conservative traders will likely seek additional candlestick confirmation off 0.97, owing to the tendency for whipsaws to occur around psychological levels.
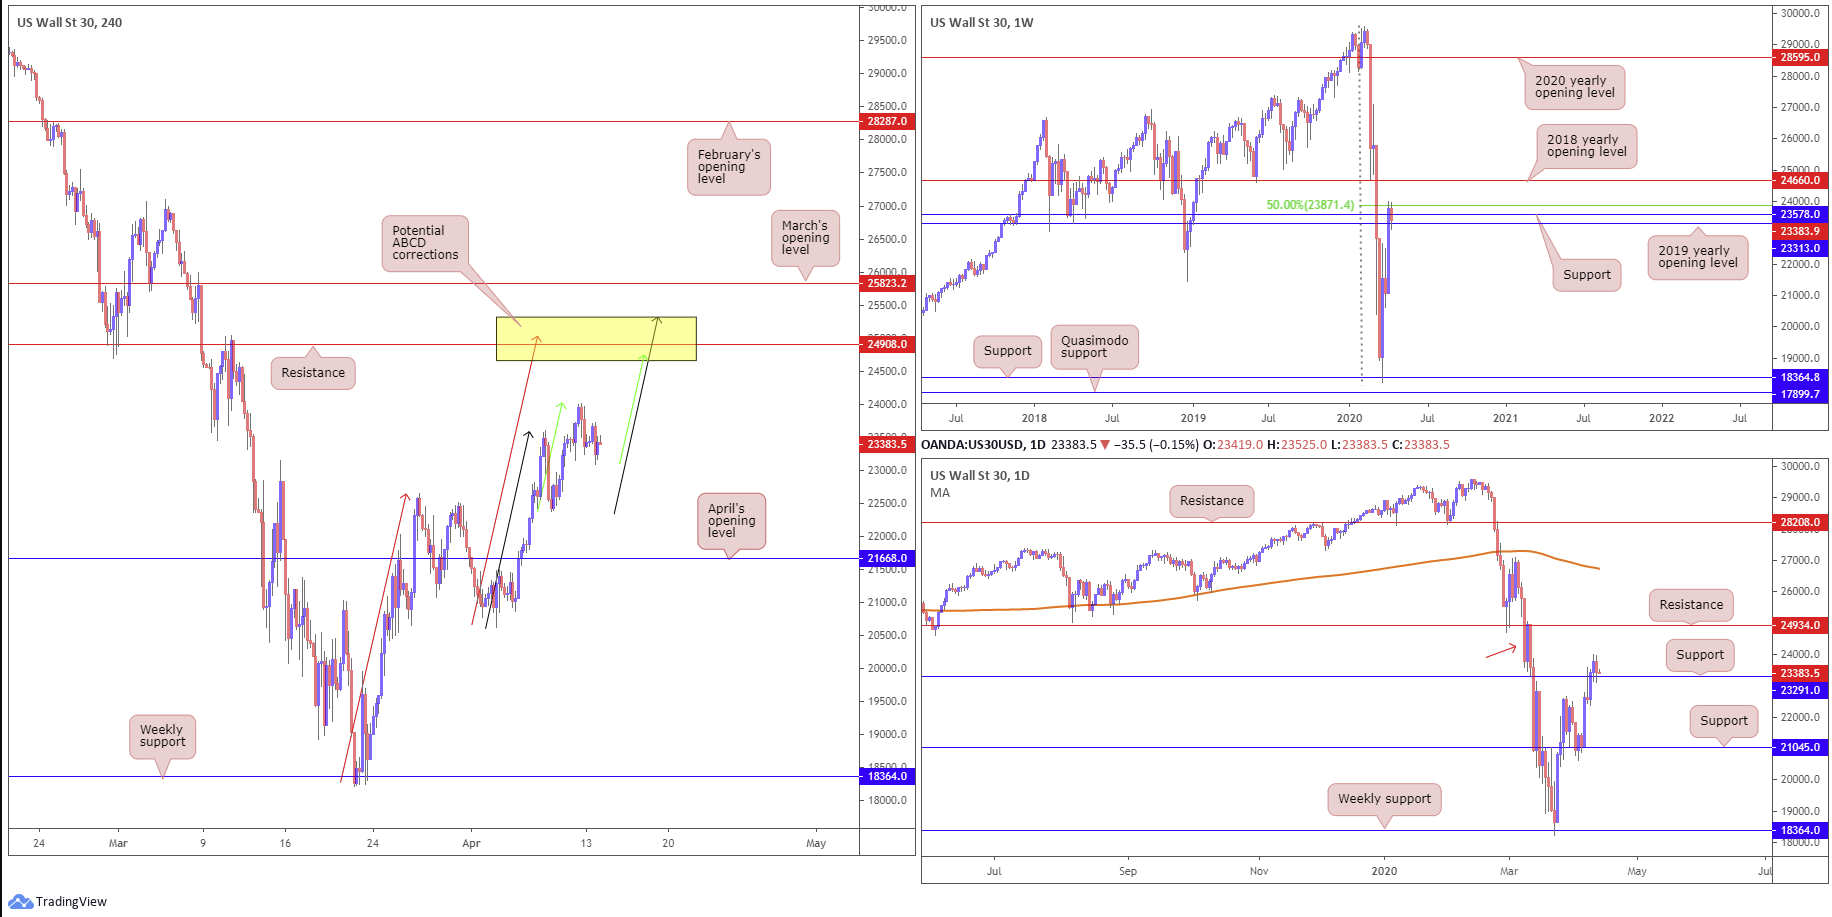
Dow Jones Industrial Average:
US stocks ended mostly lower Monday as investors prepare for miserable first-quarter earnings. The Dow Jones Industrial Average erased 328.60 points, or 1.39%; the S&P 500 also lost 28.19 points, or 1.01%, and the tech-heavy Nasdaq 100 concluded higher by 94.21 points, or 1.14%.
Technically, from the weekly timeframe, price tests a 50% retracement ratio at 23871, though has the 2019 yearly opening level at 23313 and a support level coming in at 23578 also in place. A closer reading on the daily timeframe has price retesting 23291 as support. This potentially sets the stage for further upside to 24934, though buyers must still contend with possible supply around 25000/23776, denoted by a red arrow.
On the H4 timeframe, price appears free to approach resistance coming in at 24908. Surrounding this area, however, we also have three potential ABCD completions at 25028 (red arrows), 25317 (black arrows) and 24759 (green arrows). Note the yellow area at 25317/24660 not only includes the said ABCD patterns, the base also houses daily resistance at 24934 and weekly resistance in the form of the 2018 yearly opening level at 24660.
Areas of consideration:
Given the number of technical levels converging within 25317/24660, this will likely garner interest. Not only is the area an ideal take-profit zone for longs off daily support at 23291, the area also offers a base for potential bearish scenarios.
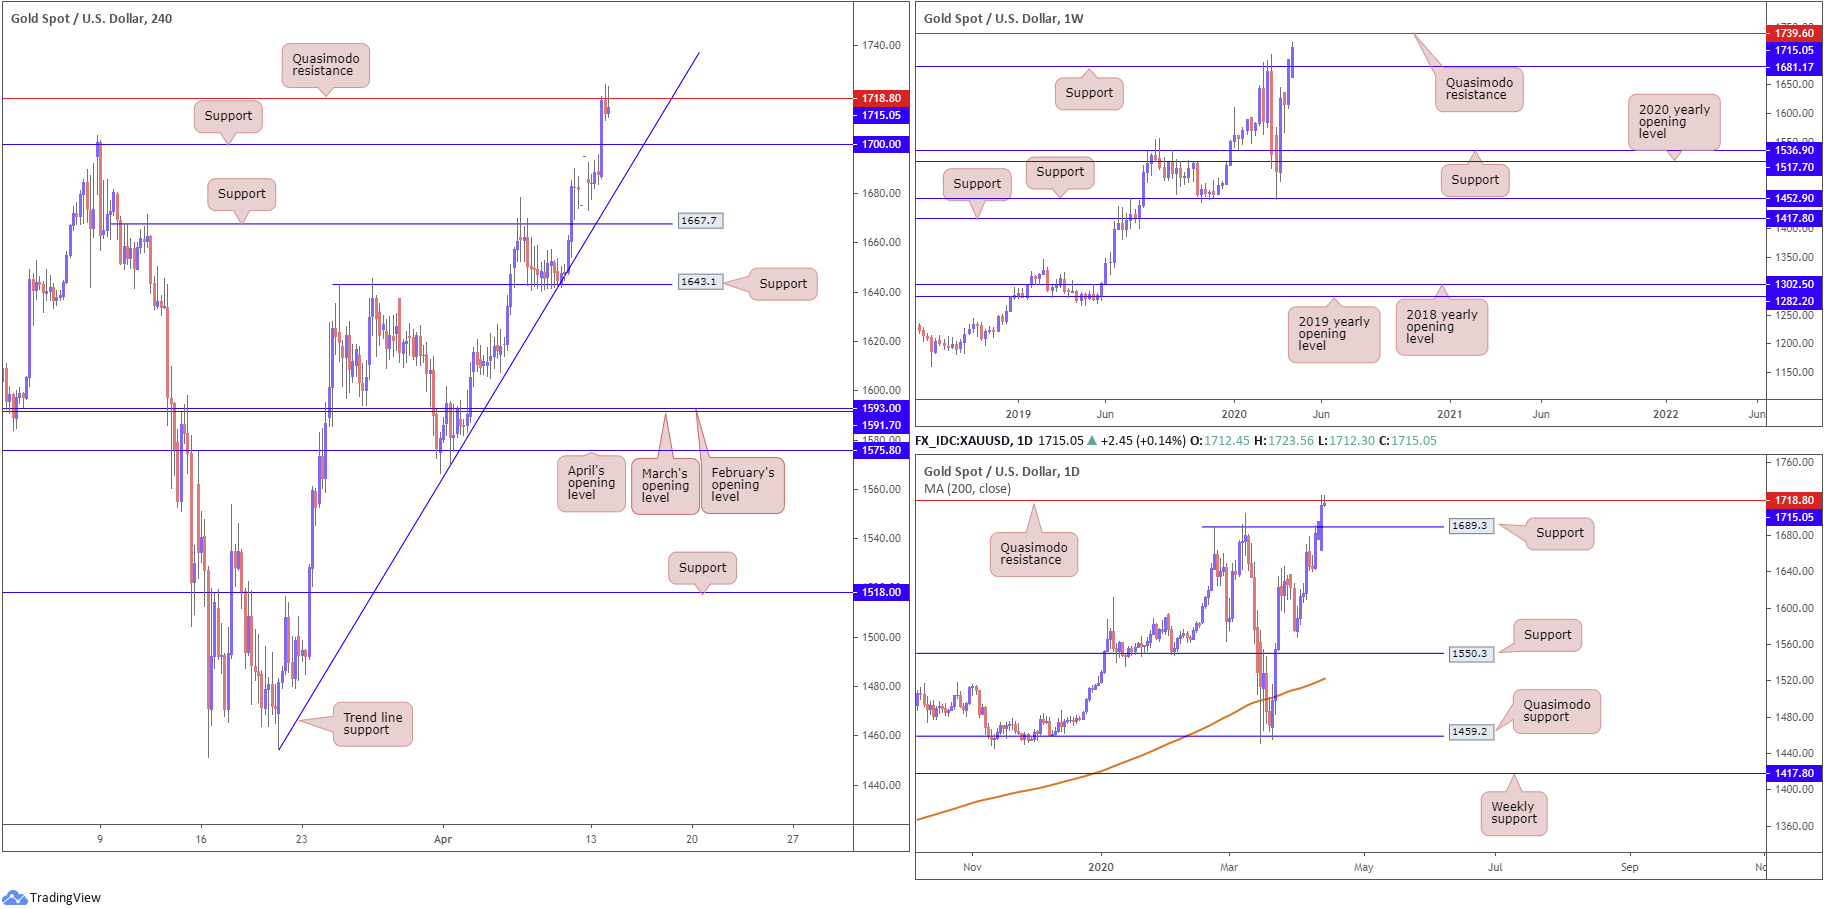
XAU/USD (GOLD):
Doubt surrounding COVID-19 and moderate selling observed in the US dollar, saw increased demand for the yellow metal on Monday, reaching highs not seen since 2012.
Technical movement on the weekly timeframe shows price making headway above support at 1681.1, with Quasimodo resistance at 1739.6 in sight as the next upside target. Lower on the curve, we can see we overthrew Quasimodo resistance at 1689.3 (now a potential support base) and ran into another layer of Quasimodo resistance from 1718.8.
Price action on the H4 timeframe recently fashioned two selling wicks off the underside of the current daily Quasimodo resistance level mentioned above at 1718.8, threatening the possibility of a retest at 1700.0 which happens to merge with trend line support, taken from the low 1479.1.
Areas of consideration:
H4 support at 1700.0, particularly at the point it merges with H4 trend line support, may develop a ‘floor’, given weekly price showing room to overcome daily Quasimodo resistance at 1718.0.
Should we fail to retest 1700.0 before pulling higher, breakout buyers will likely seek positions north of 1718.0, targeting the weekly Quasimodo resistance at 1739.6. Conservative traders, however, will likely want to see additional confirmation form before committing. This could be something as simple as a retest at 1718.0.
The accuracy, completeness and timeliness of the information contained on this site cannot be guaranteed. IC Markets does not warranty, guarantee or make any representations, or assume any liability regarding financial results based on the use of the information in the site.
News, views, opinions, recommendations and other information obtained from sources outside of www.icmarkets.com.au, used in this site are believed to be reliable, but we cannot guarantee their accuracy or completeness. All such information is subject to change at any time without notice. IC Markets assumes no responsibility for the content of any linked site.
The fact that such links may exist does not indicate approval or endorsement of any material contained on any linked site. IC Markets is not liable for any harm caused by the transmission, through accessing the services or information on this site, of a computer virus, or other computer code or programming device that might be used to access, delete, damage, disable, disrupt or otherwise impede in any manner, the operation of the site or of any user’s software, hardware, data or property.
.


