
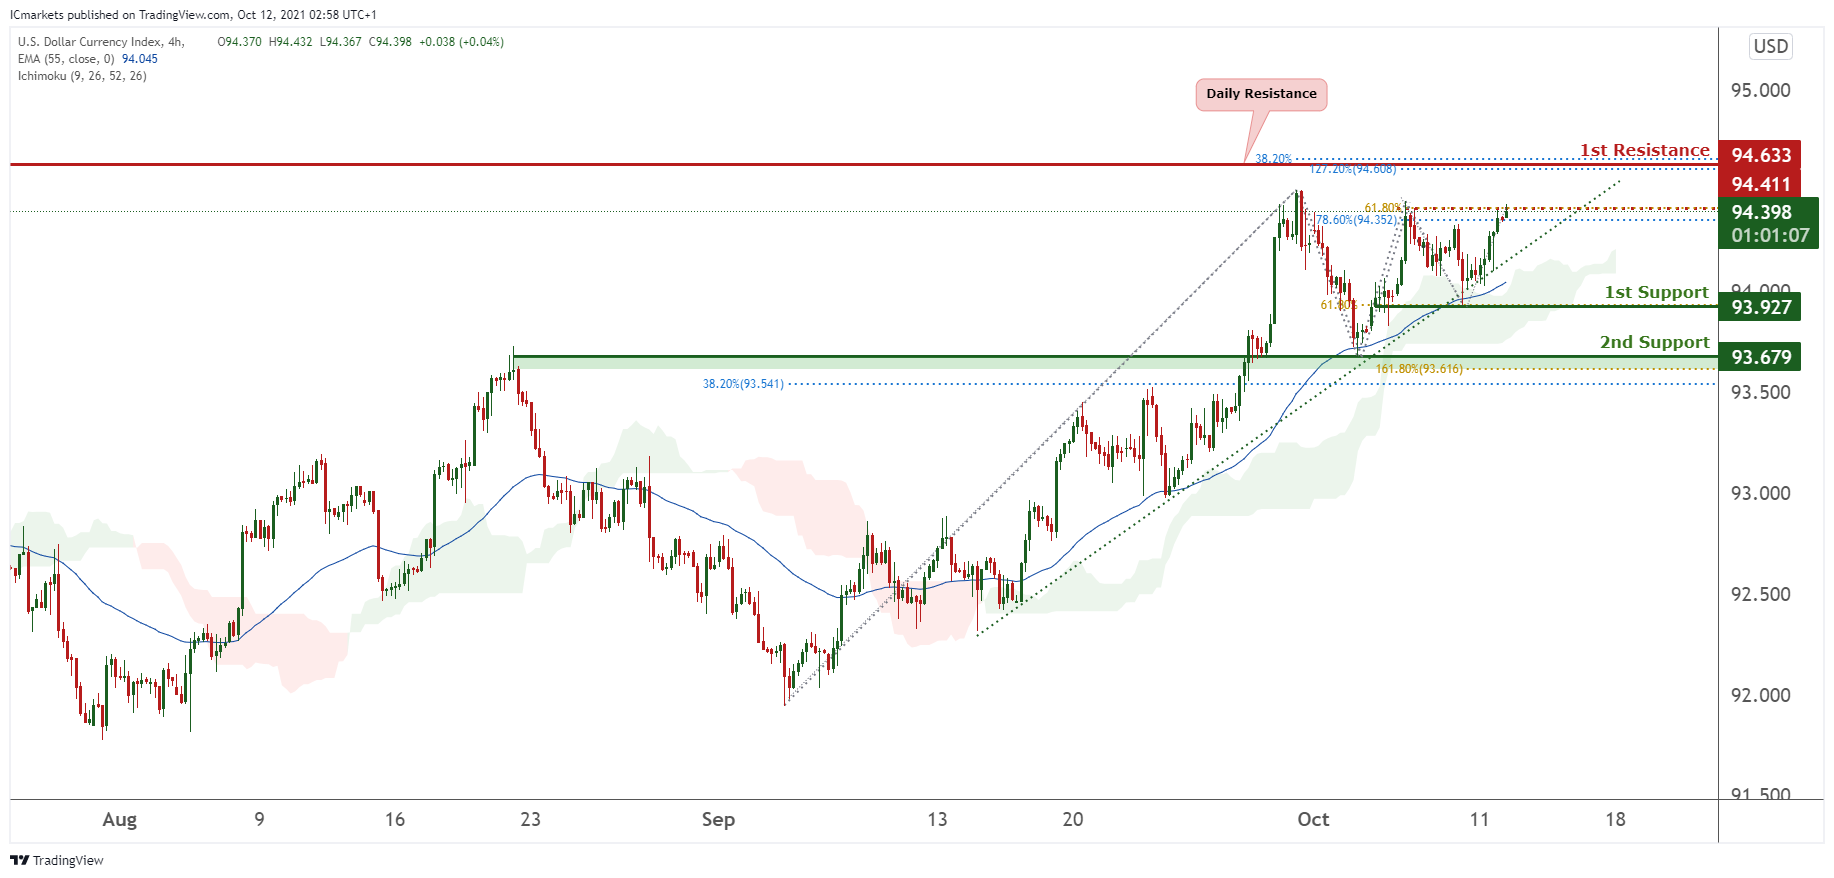
DXY:
On the H4 timeframe, DXY is on a bullish momentum. Prices have recently tested our intermediate resistance at 94.411 in line with 61.8% and 78.6% Fibonacci retracement before at pullbacks as reiterated previously. Breaking the intermediate resistance will find prices climbing higher towards our 1st resistance at 94.633 in line with 38.2% and 127.2% Fibonacci retracement and also a daily resistance. Technical indicators are showing bullish momentum. Alternatively, prices may dip towards our 1st support at 93.927 in line with 61.8% retracement and graphical swing low.
Areas of consideration:
- H4 time frame, 1st support at 93.927
- H4 time frame, intermediate resistance at 94.411
- H4 time frame intermediate support at 93.927
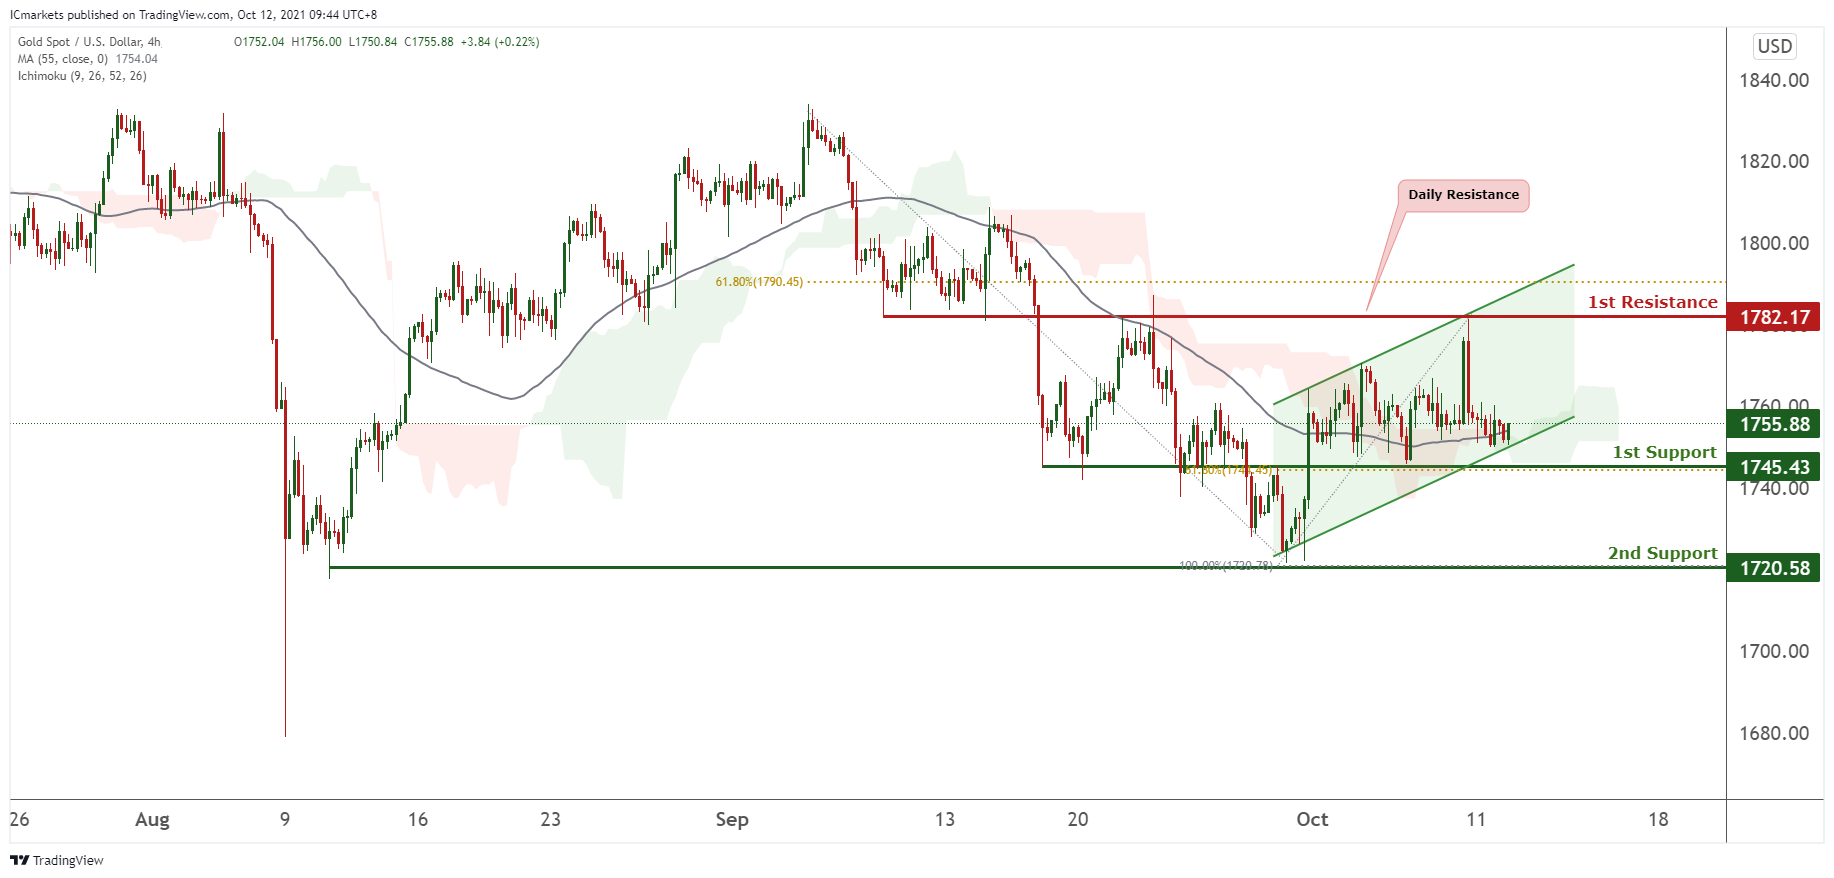
XAU/USD (GOLD):
On the H4 chart, prices appear to be consolidating in a parallel channel. Prices have the potential to climb towards our 1st resistance at 1782.19 which is in line with the top of our ascending channel and graphical overlap, and is also a daily resistance on our daily time frame. Technical indicators are showing bullish momentum. Alternatively, prices break our bullish channel, it might dip towards our 1st support at 1745.43 in line with 61.8% Fibonacci retracement.
Areas of consideration:
- 4h 1st support at 1745.43
- 4h 1st resistance at 1782.17
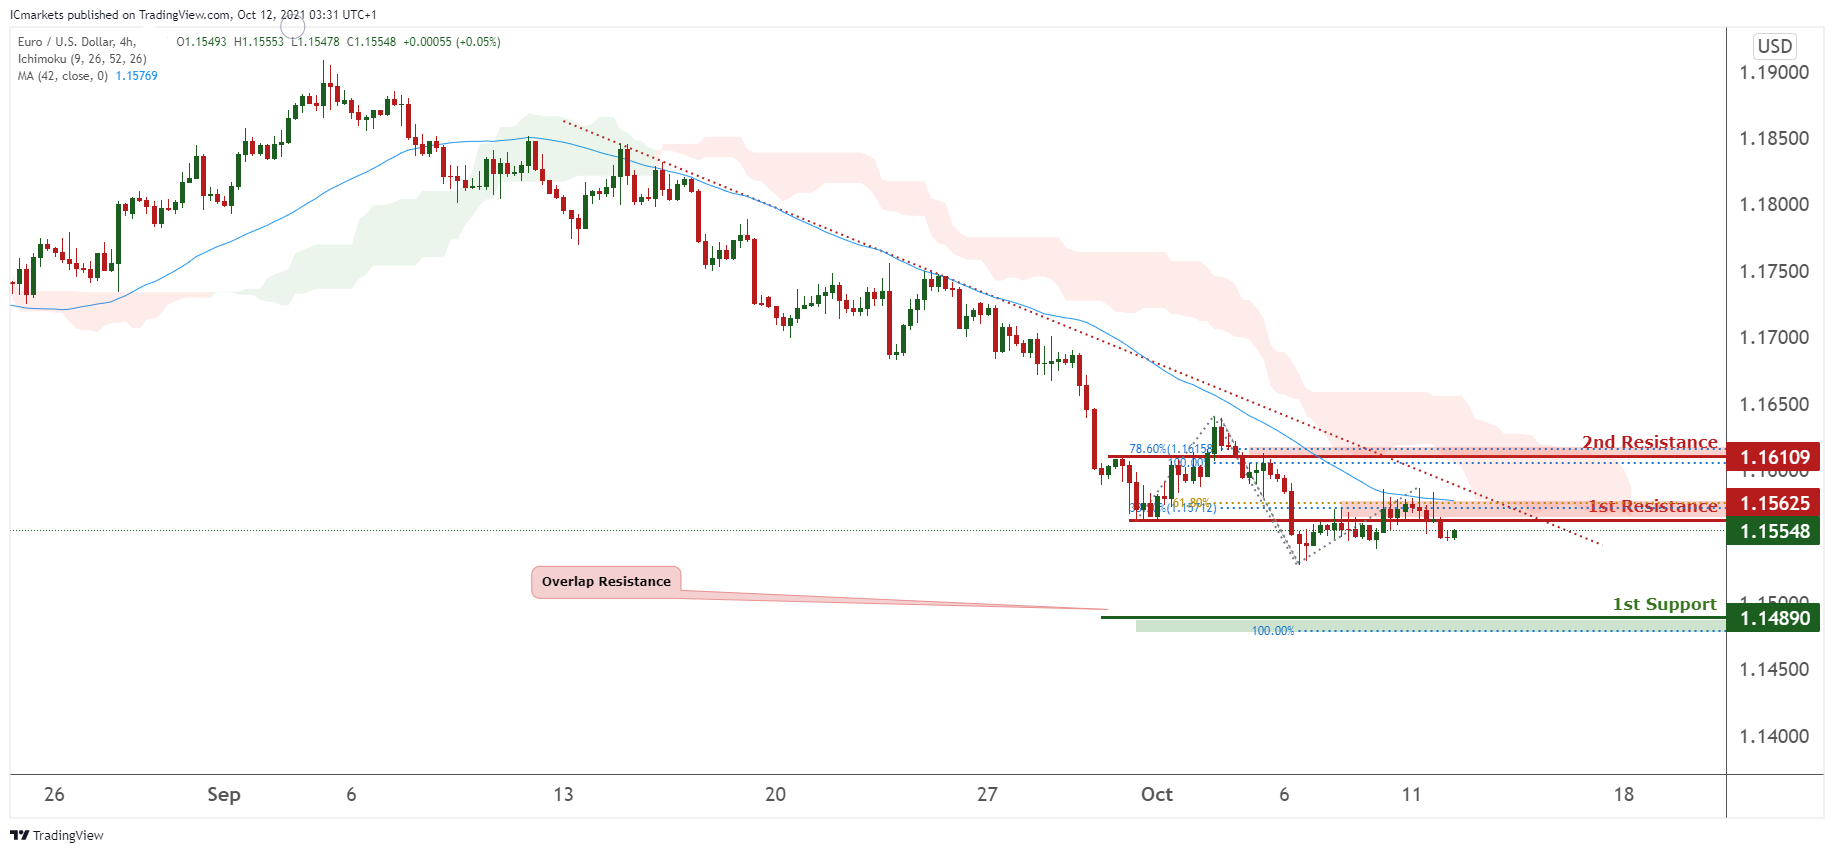
EUR/USD:
Price is currently trading on a descending trendline. Our first resistance level is placed at 1.15870 which is also our 61.8% projection level and 38.6% retracement level . Price can then potentially dip to its 1st support level of 1.15309 which is also our Fibonacci projection level of 100% . Our bearish bias is further supported by our natural moving average and also Ichimoku cloud indicator as price is trading under it.
Areas of consideration:
- H4 1st resistance 1.15870
- H4 1st support 1.15309
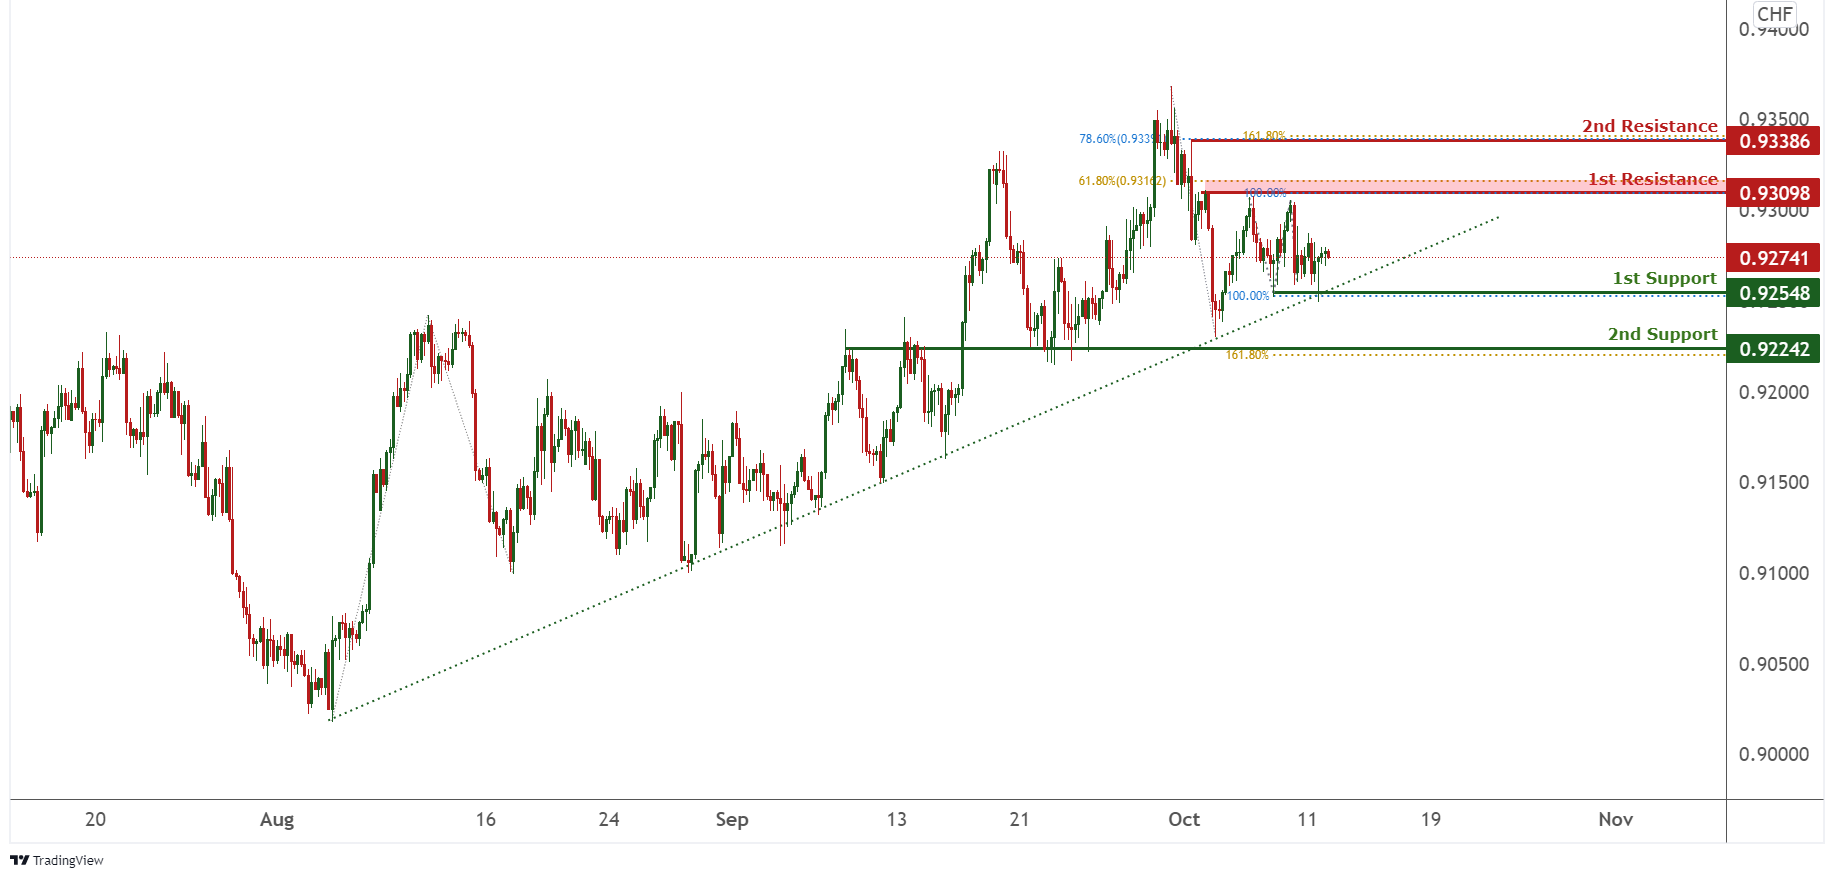
USD/CHF:
On the H4, price is seen to be reacting above the ascending trendline and price is right now in the middle of the 1st Resistance and 1st Support. We can expect the price to bounce from the 1st Support in line with 100% Fibonacci Projection and previous swing low towards the 1st Resistance in line with 61.8% Fibonacci retracement and 100% Fibonacci projection, if price passes through the intermediate resistance.
Areas of consideration:
- Watch 1st Support at 0.92548
- Watch 1st Resistance at
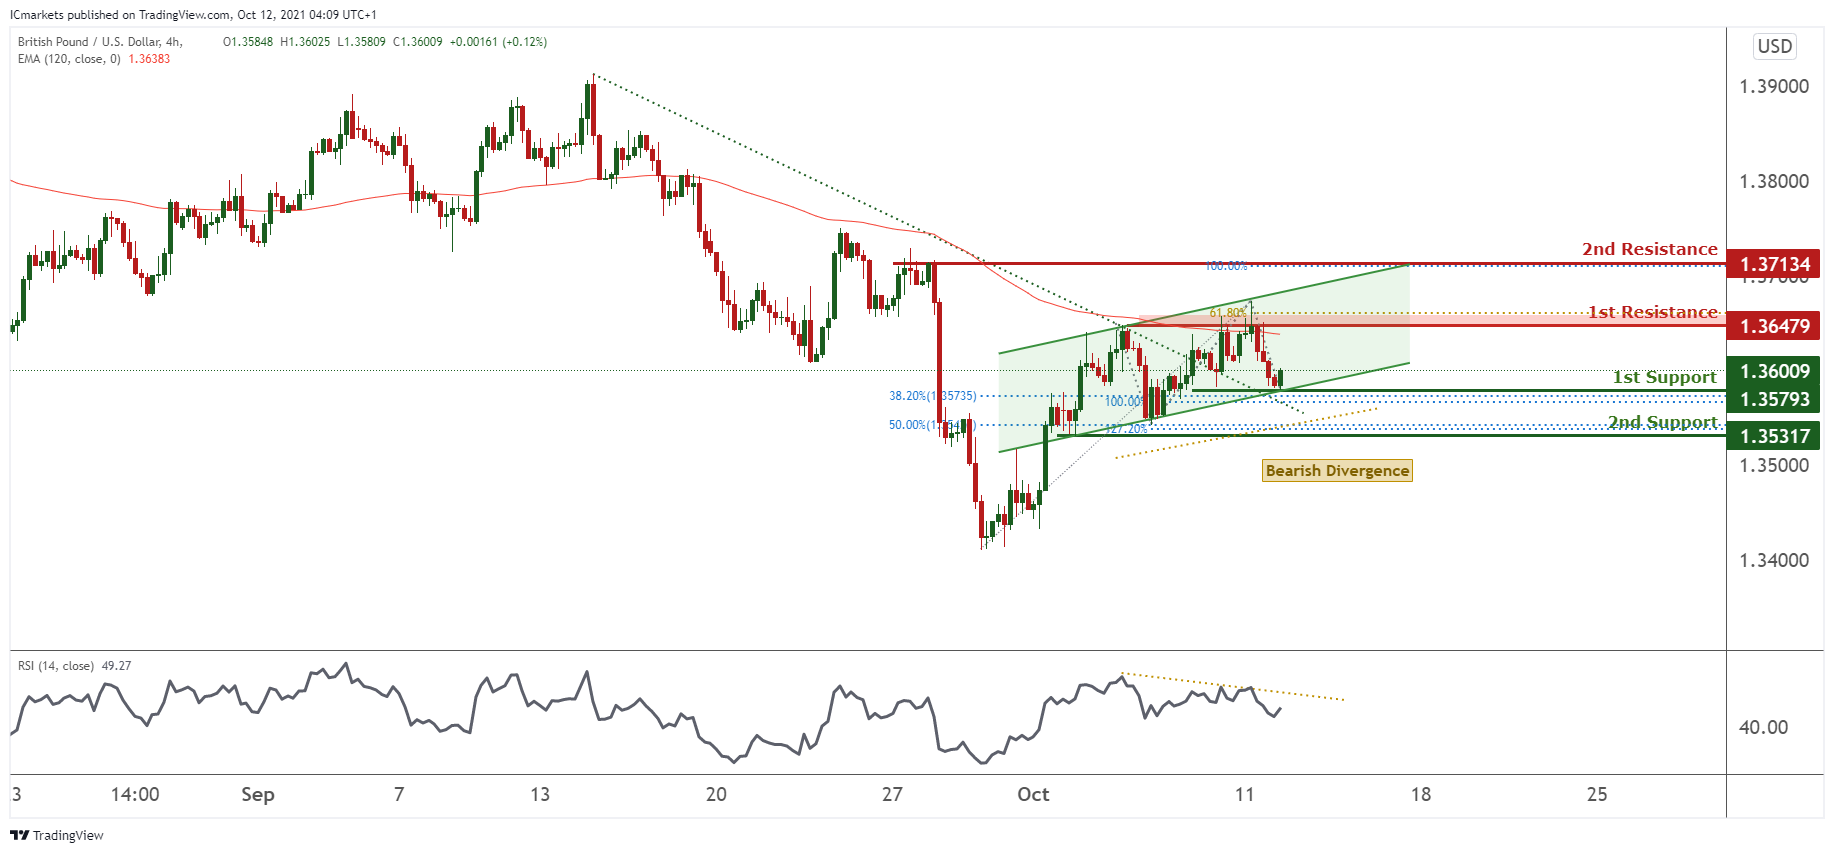
GBP/USD:
Price is currently trading in an ascending channel and is near our 1st support level of 1.35793. Support is at 38.2% Fibonacci retracement level and 100% projection. It also recently experienced a descending trendline breakout and can potentially head to the first resistance of 1.36470 which is also our Fibonacci extension level of 61.8%. Our bullish bias is supported by our RSI which shows a bearish divergence.
H4 1st resistance 1.36479
H4 1st support 1.35793
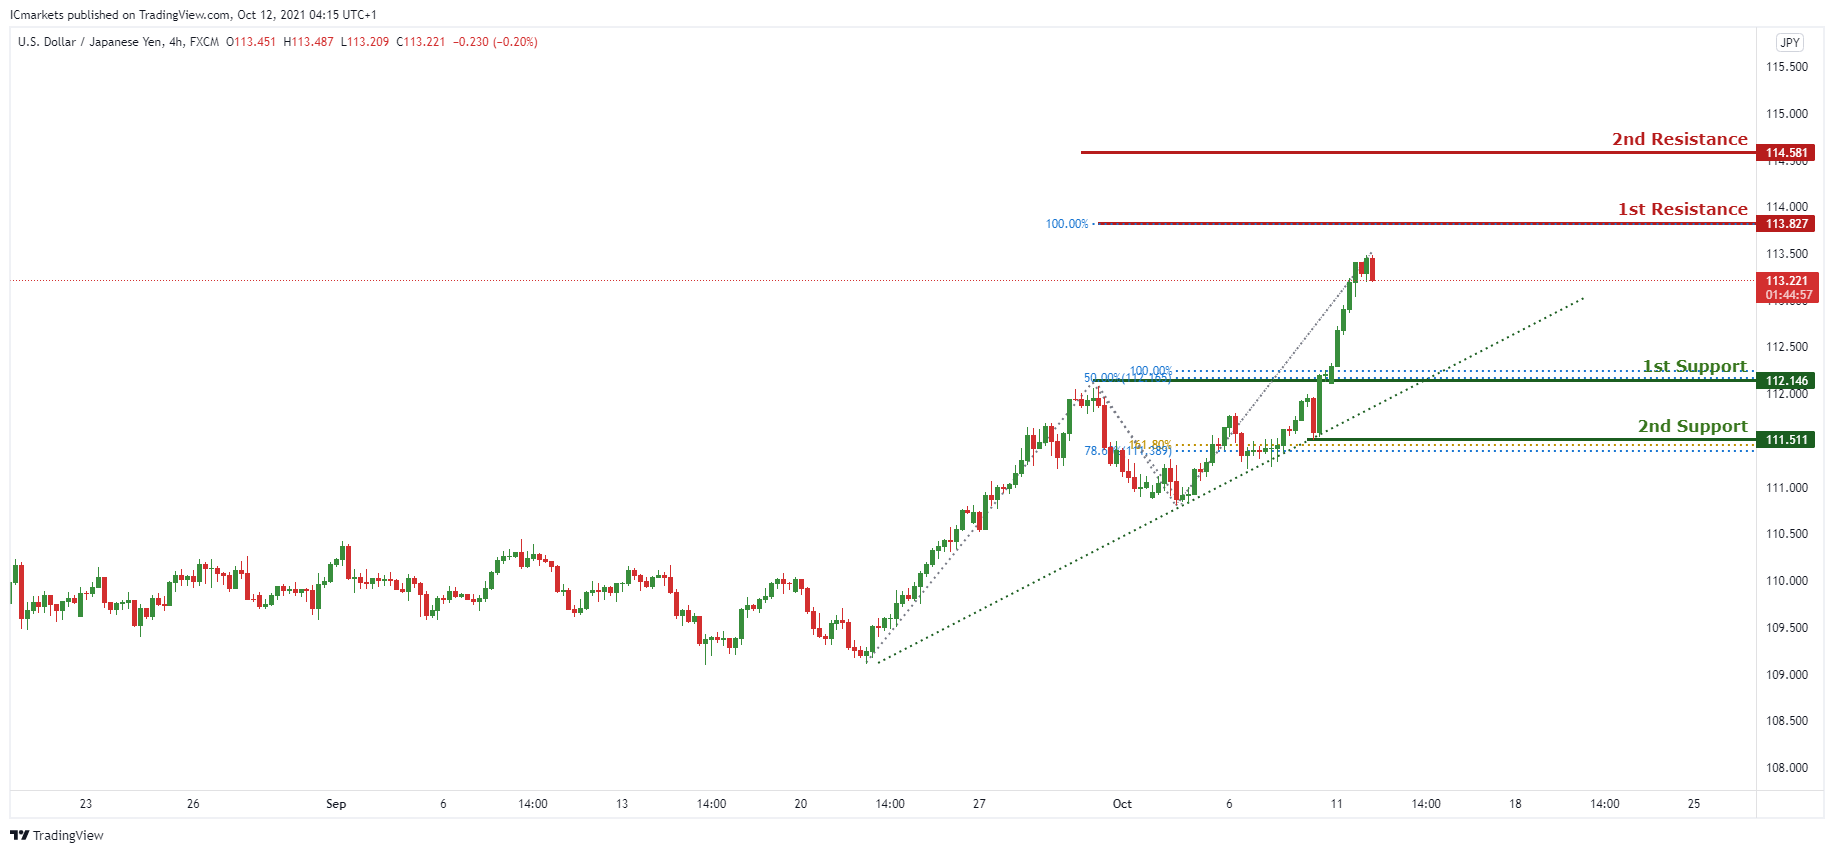
USD/JPY
On the H4 timeframe, we can see that price is abiding by the ascending trendline, we can expect price to push up to the 1st Resistance in line with 100% Projection and drop back down to the 1st Support level in line with 50% Fibonacci retracement and 100% Fibonacci projection. Price is currently waiting to push further up, advice to watch the important levels.
Areas of consideration:
- H4 1st resistance level 114.581
- H4 1st support level 112.146
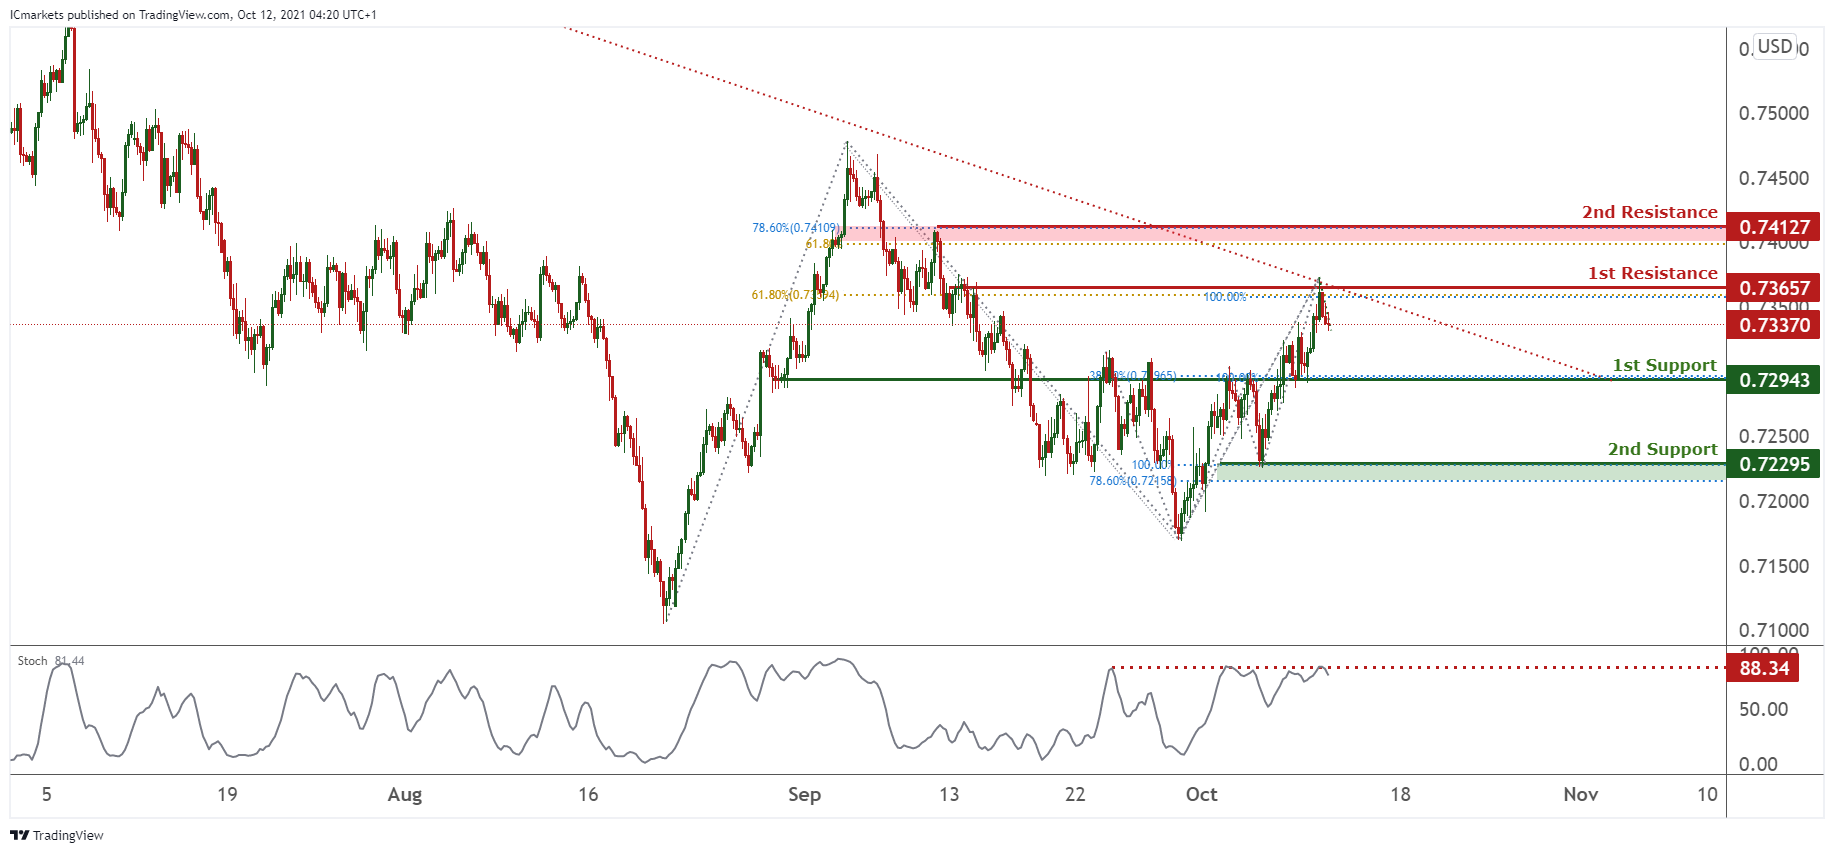
AUD/USD:
On the H4, price is seen to be holding below the descending trendline resistance, signifying a bearish momentum. Price is approaching the 1st resistance where price is in line with the descending trendline resistance, hence we can expect price to drop from 1st Resistance in line with 61.8% Fibonacci Retracement and 100% Fibonacci projection towards the 1st Support in line with 100% Fibonacci Projection and 38.2% Fibonacci Retracement. Our bearish bias is further supported by the stochastic indicator where the %K line is reaching the resistance level awaiting for a drop.
Areas of consideration:
- H4 1st resistance level 0.73454
- H4 1st support level 0.72943
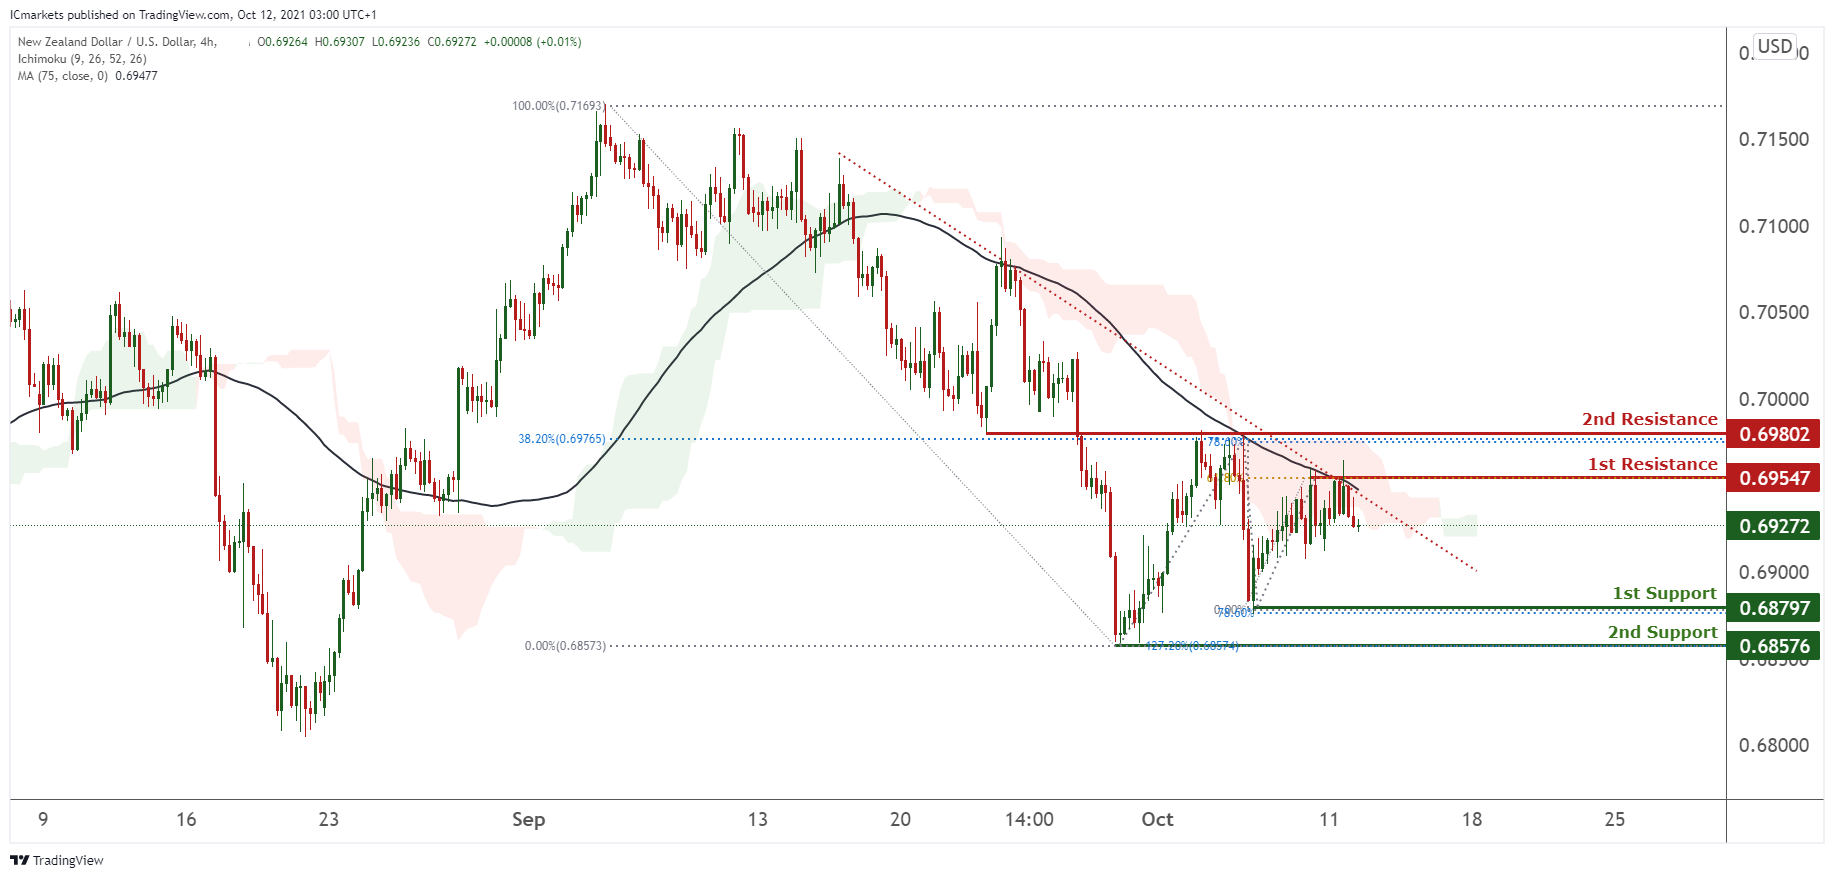
NZD/USD:
On the H4 timeframe, prices are on a bearish momentum. Prices have recently tested our bearish trendline several times and has the potential to bounce towards our 1st support at 0.68797 in line with 78.6% Fibonacci retracement and is a graphical swing low. Technical indicators are showing bearish momentum. Alternatively, if prices break our bearish trendline, it might climb towards our 2nd resistance at 0.68902 in line with 78.6% and 23.6% Fibonacci retracement.
Areas of consideration:
- H4 time frame, 2nd resistance at 69802
- H4 time frame, 1st support 0.68797
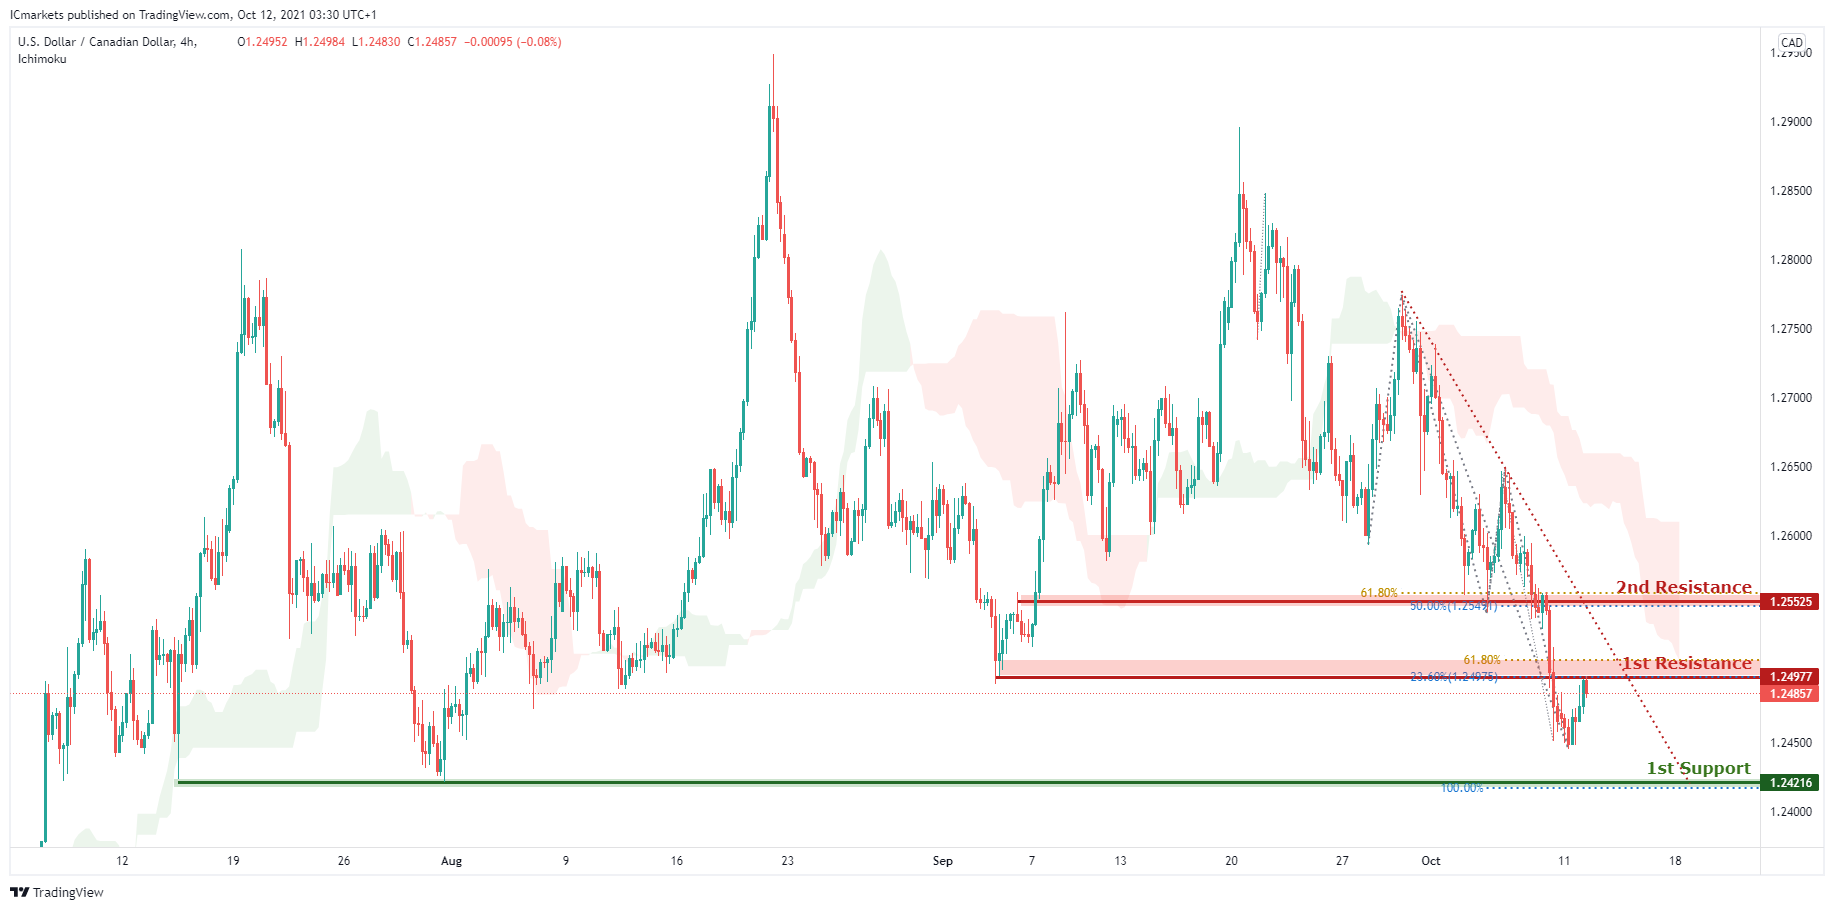
USD/CAD:
On the H4, current price is moving below the ichimoku cloud suggesting a continuation of its bearish movement. If current breaks structure at 1st resistance to the upside, price may possibly head back to 2nd resistance at 1.25525 in line with the 50% Fibonacci retracement which is closer to the existing descending trend line before making its fall back to 1st resistance at 1.24977 in line with the 23.6% Fibonacci retracement. Otherwise, we may see price fall straight to 1st support from here at 1.24216 in line with the 100% Fibonacci projection.
Areas of consideration:
- H4 time frame, support at 1.24216
- H4 time frame, resistance at 1.24977
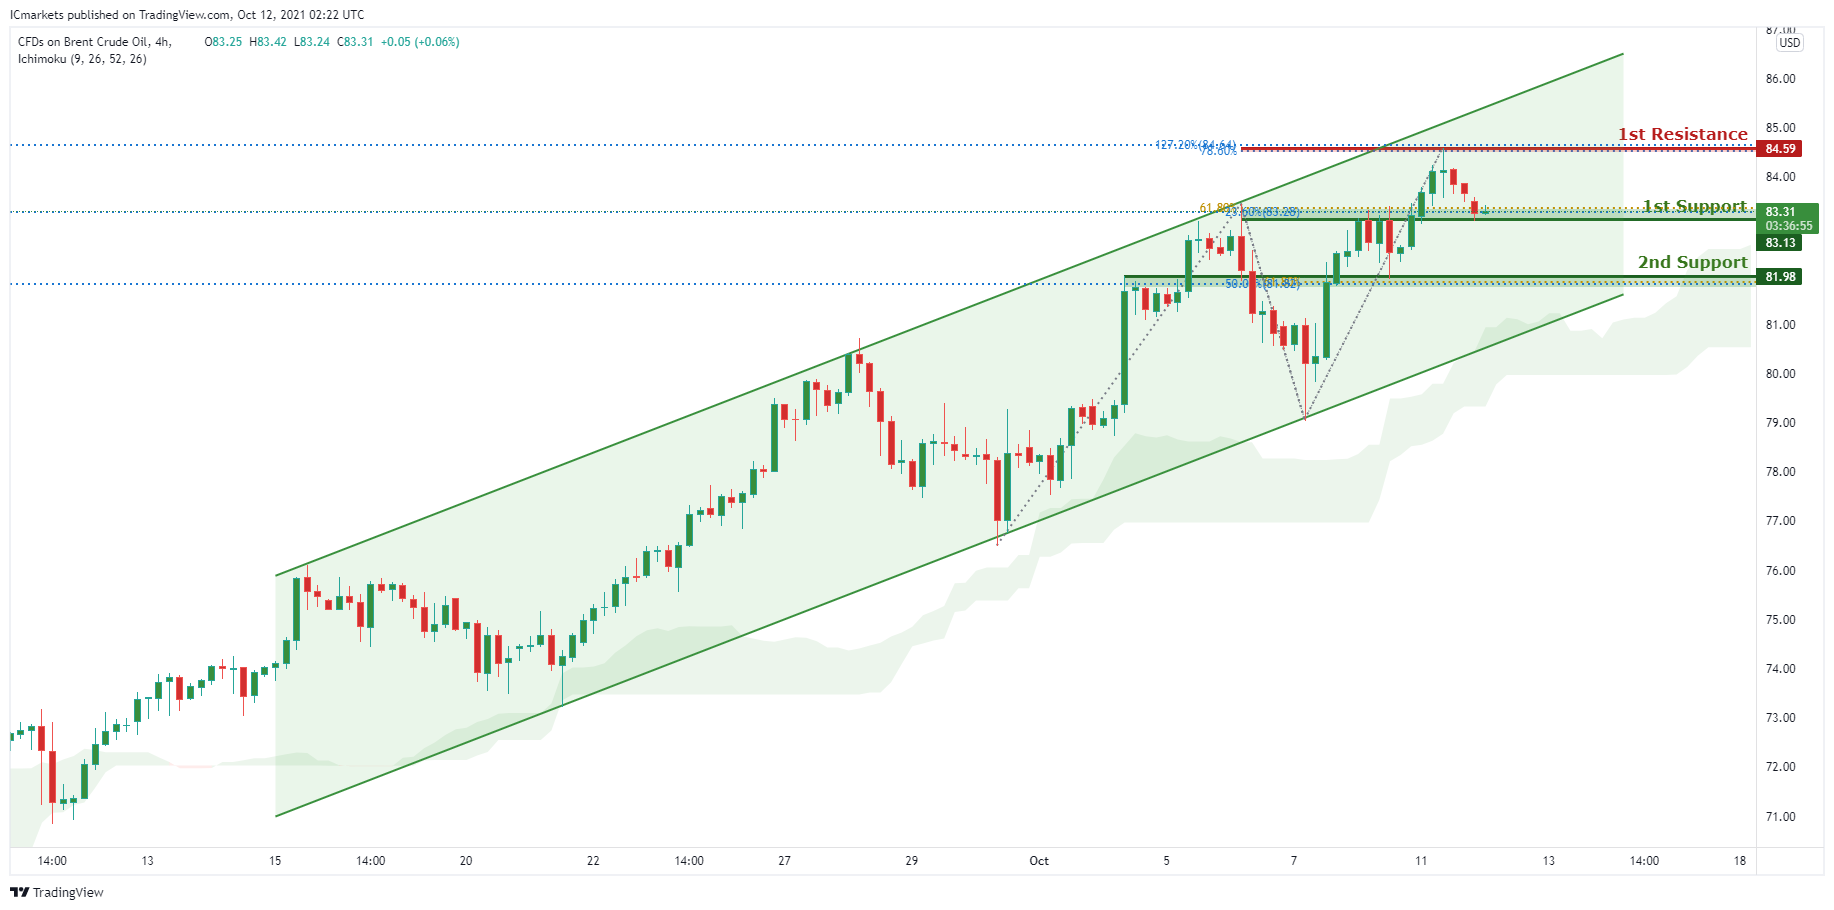
OIL:
On the H4 timeframe, price is at 1st support at the 83.13 area in line with 61.8% Fibonacci projection and if it breaks the 1st support structure, we may see price head for 2nd support at 81.98 in line with the 61.8% fibonacci retracement. Otherwise, price may head for 1st resistance in line with 84.59 in line with 78.6% Fibonacci projection. Although we have a bullish bias which is supported by the ichimoku indicator and the ascending channel, there may still be room for short term downwards movement as price is at the upper end of the channel.
Areas of consideration:
- H4 time frame, 1st resistance of 84.59
- H4 time frame, 1st support of 83.27
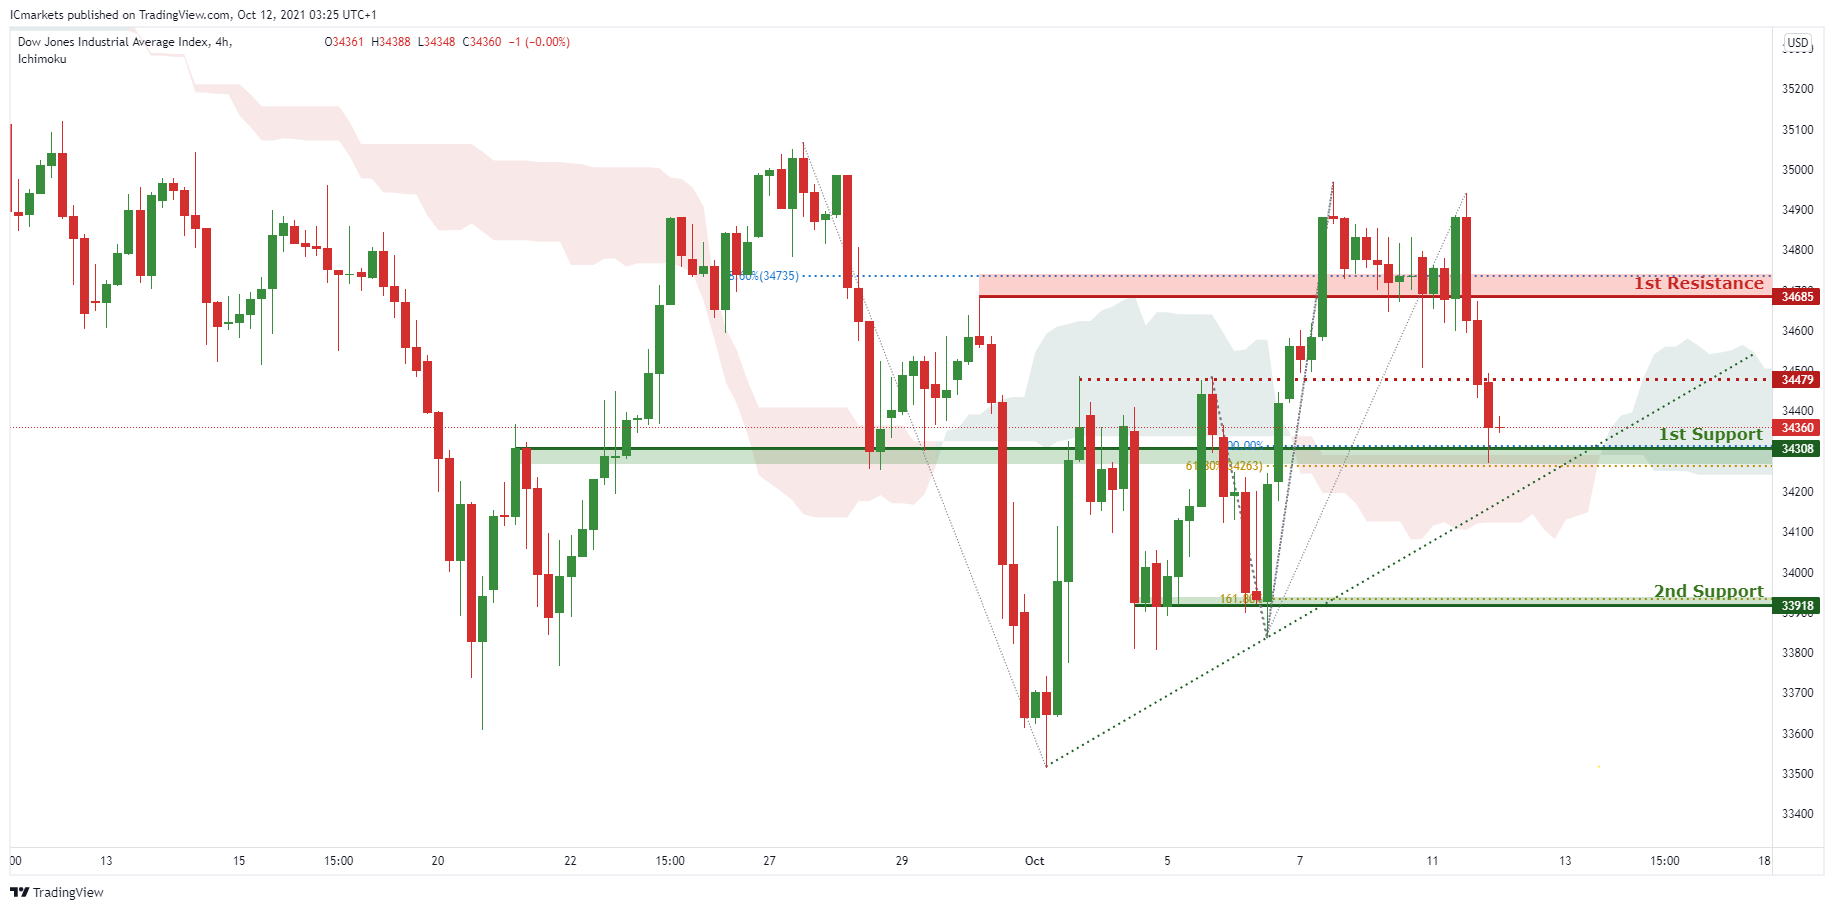
Dow Jones Industrial Average:
On the H4, with a bullish bias, we may expect to see price head to 1st resistance at 34685 in line with the 78.6% Fibonacci retracement. Otherwise if price breaks structure at 1st support at 34308 in line with the 61.8% Fibonacci retracement, we may see further bearish movements to 2nd support at 33918 in line with the 161.8% Fibonacci projection. Our bullish bias is supported by the ichimoku where price is moving above it along with the existing ascending trend line.
Areas of consideration:
- 4H resistance at 34685
- 4H support at 34308
The accuracy, completeness and timeliness of the information contained on this site cannot be guaranteed. IC Markets does not warranty, guarantee or make any representations, or assume any liability regarding financial results based on the use of the information in the site.
News, views, opinions, recommendations and other information obtained from sources outside of www.icmarkets.com.au, used in this site are believed to be reliable, but we cannot guarantee their accuracy or completeness. All such information is subject to change at any time without notice. IC Markets assumes no responsibility for the content of any linked site.
The fact that such links may exist does not indicate approval or endorsement of any material contained on any linked site. IC Markets is not liable for any harm caused by the transmission, through accessing the services or information on this site, of a computer virus, or other computer code or programming device that might be used to access, delete, damage, disable, disrupt or otherwise impede in any manner, the operation of the site or of any user’s software, hardware, data or property.


