
Key risk events:
UK Prelim GDP q/q; UK GDP m/m; UK Manufacturing Production m/m; ECB President Lagarde Speaks; Fed Chair Powell Testifies; BoE Gov Carney Speaks; MPC Member Haskel Speaks; FOMC Member Kashkari Speaks.
(Previous analysis as well as outside sources – italics).
EUR/USD:
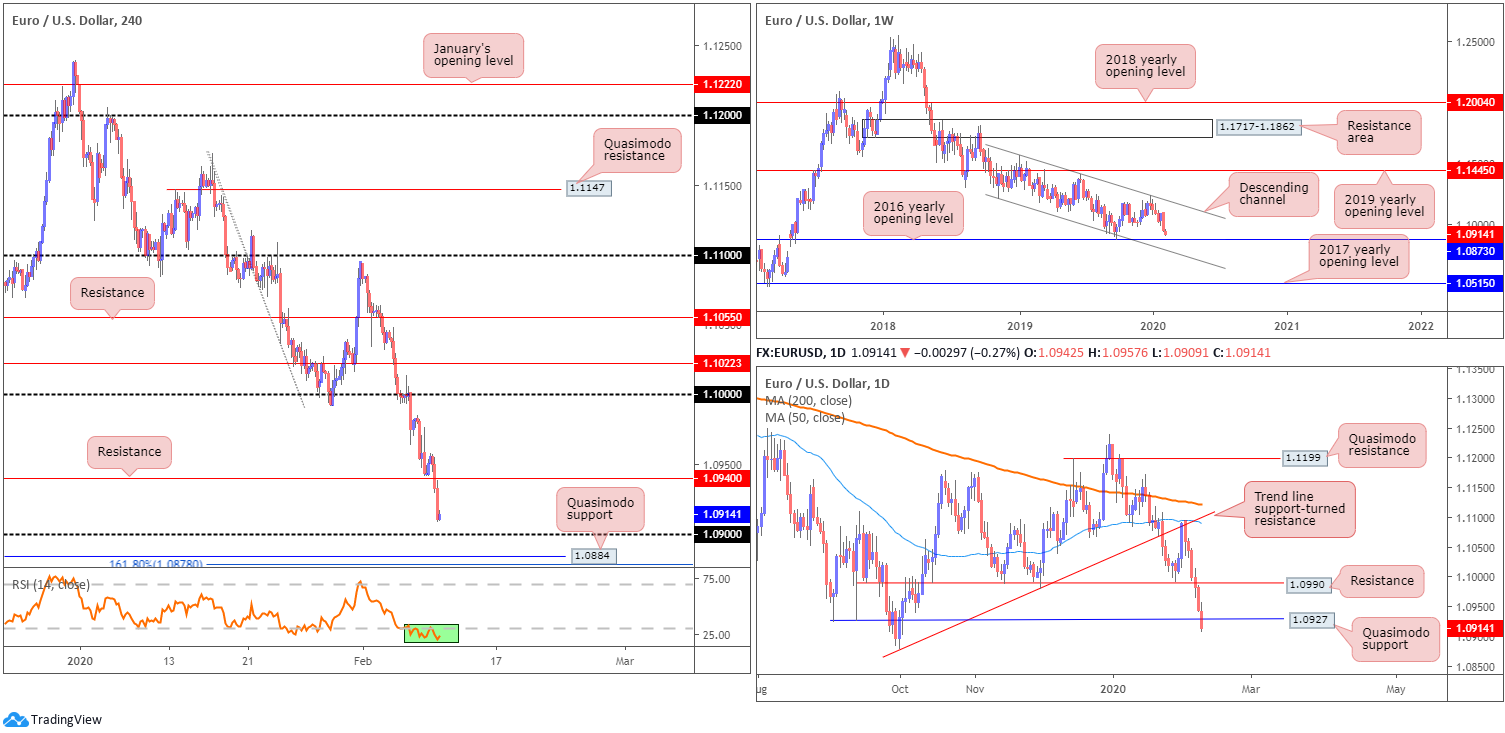
The euro fell victim to sustained USD strength Monday, with the US dollar index reaching highs of 98.88, poised to approach the 99.00 handle.
The weekly timeframe has price action nearing support, shaped in the form of a 2016 yearly opening level at 1.0873. Since November 2018, the pair has also been compressing within a descending channel formation, drawn from a high of 1.1569 and a low at 1.1109. Thus, further selling could still be in store.
The daily timeframe, in conjunction with weekly flow, reveals price action crossed Quasimodo support at 1.0927.
Note the Quasimodo support’s low 1.0879 is stationed a handful of points ahead of the 2016 yearly opening level mentioned above on the weekly timeframe at 1.0873.
Recent selling overthrew H4 support priced in at 1.0940 (now a serving resistance), likely paving the way to the 1.09 handle. South of 1.09 lies an interesting area of support between 1.0873/1.0884. Comprised of the weekly support (2016 opening level) at 1.0873, a H4 161.8% Fibonacci extension at 1.0878, a H4 Quasimodo support at 1.0884 and the relative strength index (RSI) continuing to explore oversold territory, this is likely an area worthy of the watchlist. In addition to this, sell-stop liquidity beneath the 1.09 handle (common location for orders to accumulate) provides orders to buy into; this is particularly attractive for larger traders.
Areas of consideration:
1.0873/1.0884 is in focus.
A test of this area followed by a close back above 1.09 will likely draw in buyers to 1.0927, the daily Quasimodo support, and a possible run back to H4 resistance at 1.0940, followed by daily resistance at 1.0990. Stop-loss placement, for conservative traders, is likely beyond 1.0873; others may prefer beneath the breakout candle’s (above 1.09) lower shadow.
GBP/USD:
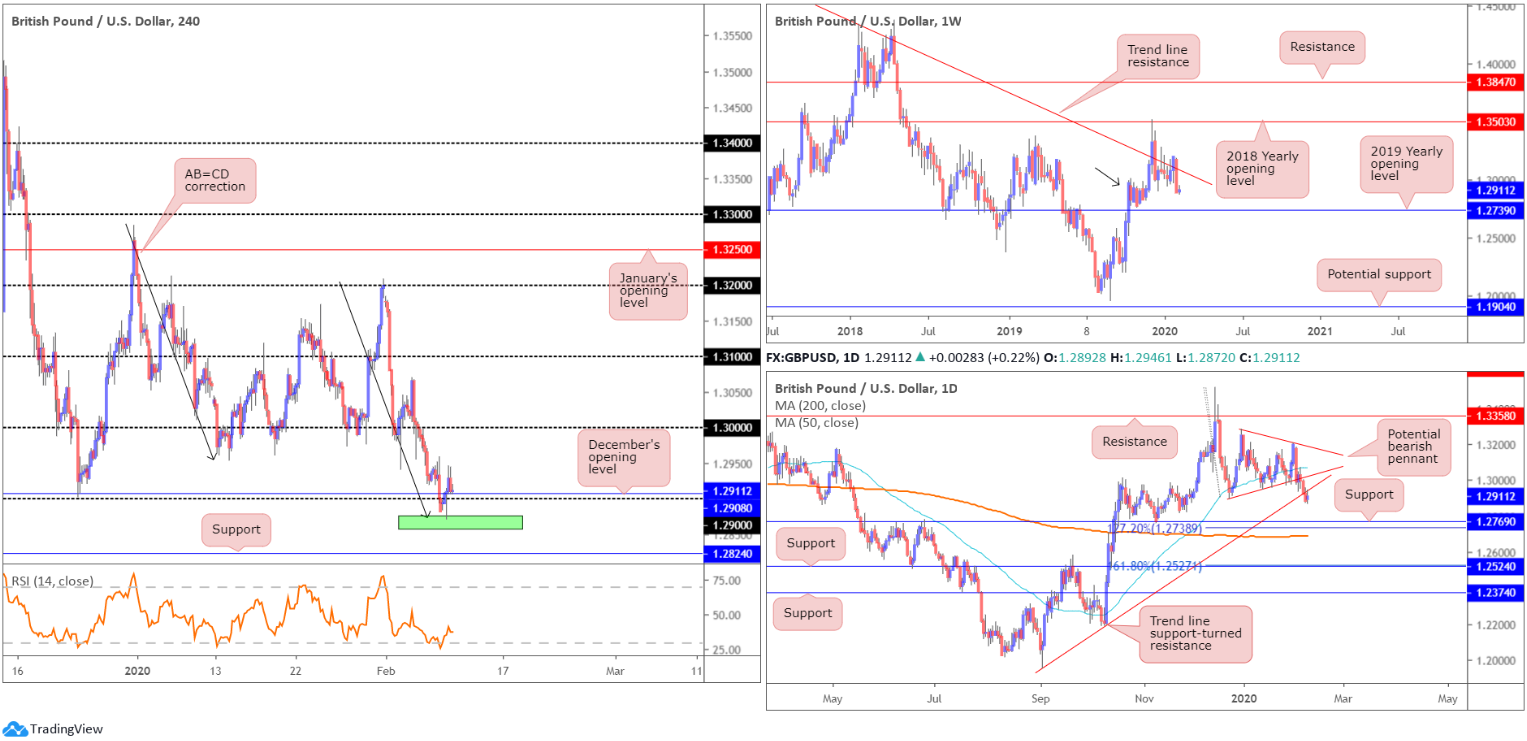
Snapping a three-day bearish phase, Monday had H4 price rebound from an AB=CD correction at 1.2873ish, break back through 1.29 and December’s opening level at 1.2908, and reach session highs of 1.2946. While H4 price is looking to retest 1.29 today, sellers likely have the upper hand in this market, according to the daily timeframe’s technical structure.
From the weekly timeframe:
Shedding more than 300 points over the course of last week, price action trades beneath long-standing trend line resistance, pencilled in from the high 1.5930, though demand around the 1.2939 region is also still in motion (black arrow). Continued downside this week may imply a break of the said demand, tripping sell stops and testing the 2019 yearly opening level at 1.2739.
From the daily timeframe:
Following last Wednesday’s retest at the underside of the 50-day SMA (blue – 1.3069), the unit overthrew the lower edge of a bearish pennant pattern, extended from a high of 1.3284 and a low of 1.2904. In addition, Friday’s follow-through selling violated trend line support, taken from the low 1.1958, possibly setting the stage for a run to support fixed at 1.2769, a 127.2% Fibonacci extension at 1.2738 and the 200-day SMA (1.2690). Note the said SMA has been flattening since mid-October 2019.
As evident from the daily timeframe, price action is retesting the underside of the recently broken trend line support, therefore, sellers may push for lower levels.
Areas of consideration:
A rotation lower from the underside of the daily trend line resistance likely confirms downside strength on the weekly timeframe, which may see a try for the 2019 yearly opening at 1.2739.
As a result, chart studies suggest a break back beneath 1.29 could occur, opening potential bearish scenarios to at least H4 support at 1.2824. Conservative traders, nonetheless, may look for a retest at 1.29 to occur before pulling the trigger.
AUD/USD:
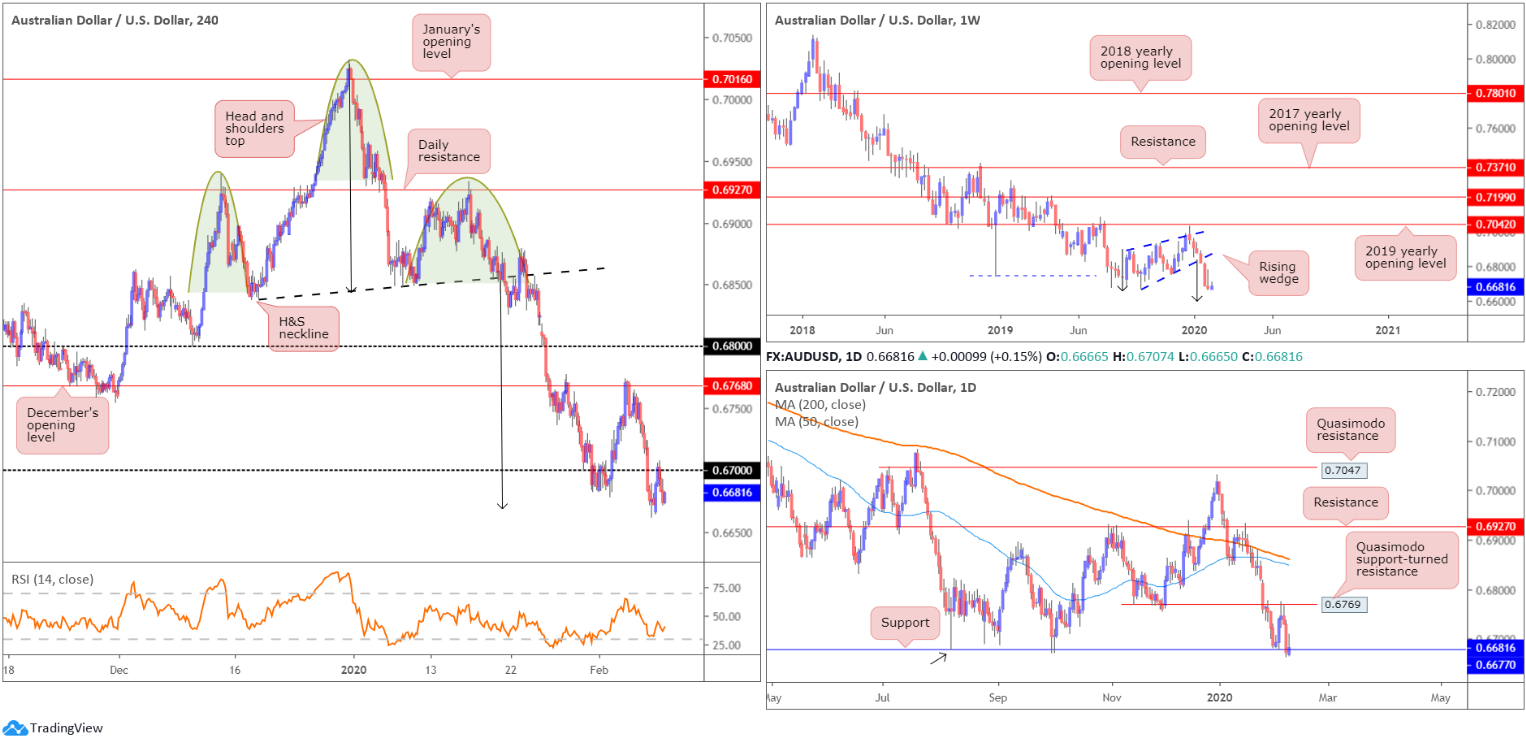
The H4 head and shoulders top in January finally hit the H&S take-profit target at 0.6668 (black arrows – calculated by taking the distance between the head and the neckline and adding it to the breakout point) last week. It took nearly three weeks to complete. Well done to any readers who held tight.
Going forward, the weekly timeframe portends further selling:
Since registering a bottom in late September at 0.6670 (2019), price carved out a rising wedge formation, typically considered a continuation pattern within a trending environment.
The past six weeks witnessed price decline back into the rising wedge and, thanks to recent selling, break and extend beyond the lower edge. With the primary downtrend having been in full force since topping at 0.8135, in early 2018, further downside is possible.
Assuming a close beneath the 0.6670 September 30th low, the rising wedge take-profit (black arrows – calculated by taking the height of the base and adding it the breakout point) is seen at 0.6599, followed by support at 0.6359 (not visible on the screen).
The story on the daily timeframe has the unit attempting to dethrone support from 0.6677, after respecting Quasimodo support-turned resistance at 0.6769 Wednesday. Note also that the current support level denotes a Quasimodo support base (black arrow). The next support target beyond 0.6677, in the event of further selling, falls in around 0.6508 (not visible on the screen). Traders may also want to note both the 200/50-day SMAs continue to point south. The 200-day SMA has traded south since April 2018.
A closer reading of price action on the H4 timeframe witnessed the pair revisit the underside of 0.67 Monday and turn lower. This follows Friday’s break to lows of 0.6662. Aside from the possibility of support developing out of 0.6650, the research team notes limited support on the H4 until reaching the 0.66 handle.
Areas of consideration:
Weekly price invites further selling, according to our chart studies. This – coupled with the H4 candles retesting the underside of 0.67 and daily support at 0.6677 reflecting a fragile tone at the moment – could be enough to encourage additional bearish sentiment.
0.66 represents an ideal downside target; the level converges almost to-the-point with the rising wedge take-profit target at 0.6599.
USD/JPY:
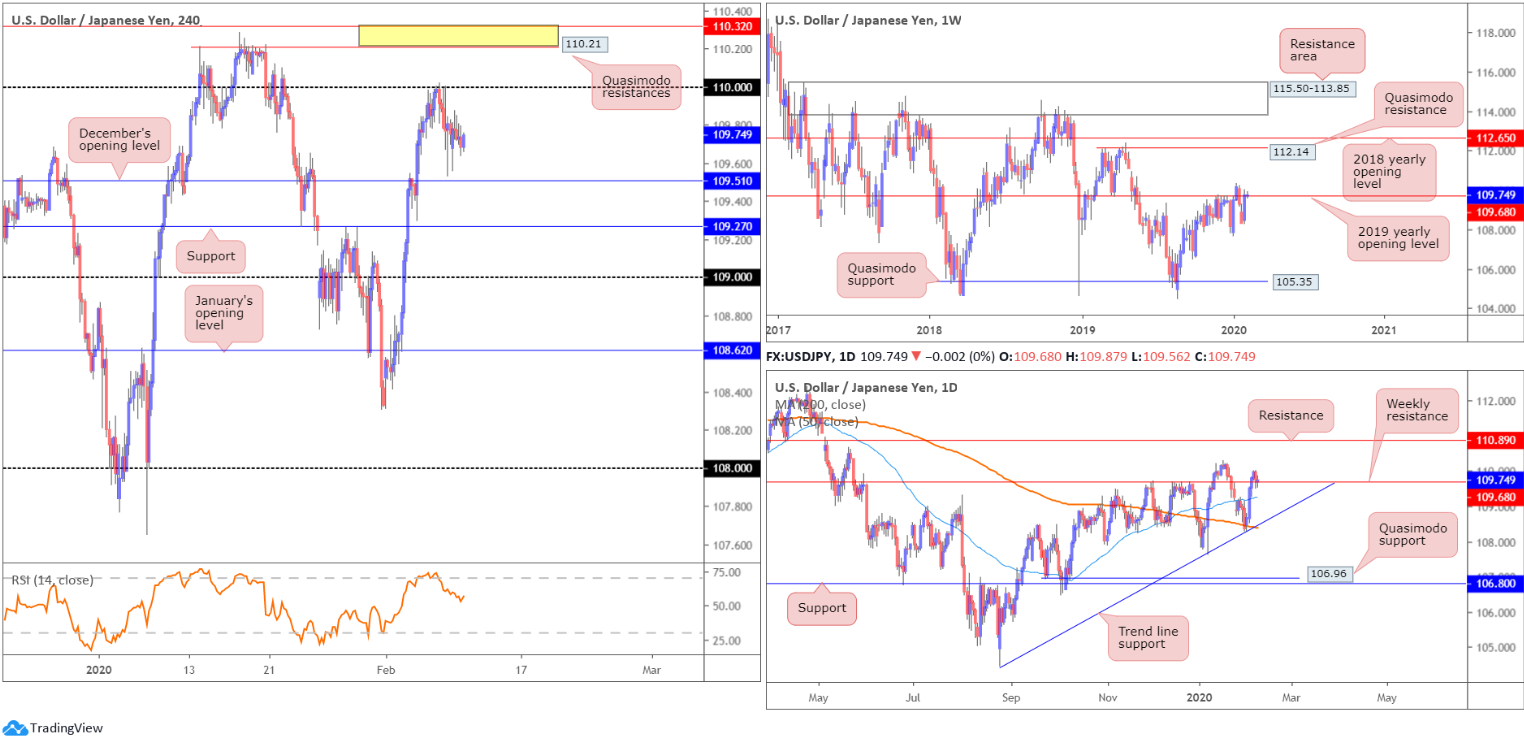
USD/JPY prices remain unchanged as we head into Asia Pac hours, ranging no more than 35 points Monday.
Given the lacklustre performance, the following analysis will echo much of what Monday’s technical briefing reported.
From the weekly timeframe:
After scoring a weekly low of 108.31, USD/JPY bulls entered a bullish phase, consequently reconnecting with the 2019 yearly opening level at 109.68. A decisive push above the said barrier underlines a possible approach towards Quasimodo resistance at 112.14, closely followed by the 2018 yearly opening level at 112.65, over the coming weeks. A rejection, however, could entice moves to the 107.65 January 6th low this week. Beneath the aforementioned low, limited support is evident until reaching the 106.48 September 30th low, followed by Quasimodo support coming in at 105.35.
Daily timeframe:
A closer examination of price action on the daily timeframe reveals the unit discovered a floor of support at the beginning of last week off the 200-day SMA (orange – 108.39), located a couple of points ahead of trend line support, extended from the low 105.59.
The pair caught a healthy bid last Tuesday, running through the 50-day SMA (blue – 109.25) and conquering weekly resistance on Wednesday. Note price retested weekly resistance as support at the tail end of the week, chalking up a mild correction.
As evident from the daily timeframe today, price remains buoyed by the said weekly level.
H4 timeframe:
Support on the H4 timeframe can be seen around December’s opening level at 109.51, with nearby resistance plotted off the 110 handle. Outside of these levels, we have another layer of support close by at 109.27, whereas above 110, two Quasimodo resistances are seen at 110.32 and 110.21.
Areas of consideration:
Based on the weekly timeframe’s structure, the 2019 yearly opening level at 109.68 remains a probable resistance. Last weeks close above the level by seven points is not a cause for concern on the weekly timeframe, and unlikely sufficient to excite breakout buying.
Daily price shows the unit retesting the weekly level as support, though has yet to pencil in anything of note to the upside.
This leaves H4 movement, which, as highlighted above, is fading 110 with support seen at 109.51.
Going on the above, sellers still appear to have the upper hand, and a H4 close beneath December’s opening level at 109.51 would help show this. However, to trade any moves south of this level requires a setup that offers a tight stop. Nearby H4 support rests at 109.27, converging closely with the 50-day SMA.
USD/CAD:
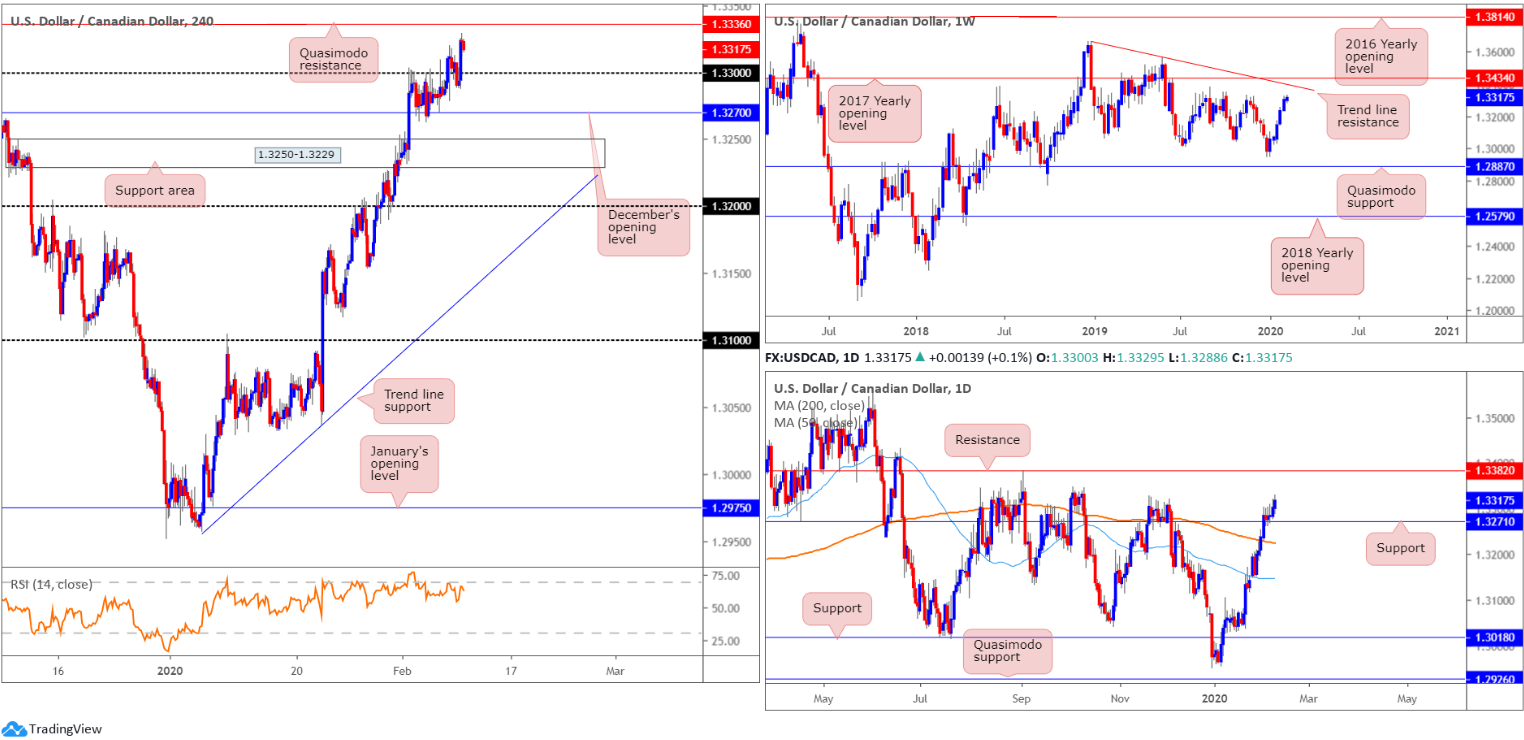
Broad-based USD buying, and weaker oil prices (typically weighs on the CAD), saw USD/CAD score four-month tops around the 1.3330ish region Monday.
Following an early dip to sub-1.33, H4 flow regained traction and reclaimed 1.33+ status in early US hours. In terms of resistance, the next port of call rests nearby in the shape of a Quasimodo resistance at 1.3336, closely followed by another layer of Quasimodo resistance at 1.3361 (not visible on the screen).
On a wider perspective, price action on the weekly timeframe trades nearby tops around 1.3340, with trend line resistance (1.3661) and the 2017 yearly opening level at 1.3434 also in sight.
Resistance-turned support on the daily timeframe at 1.3271 currently offers a ‘floor’ in this market. To the upside, the research team sees little in the way of active supply until reaching resistance at 1.3382. Beneath the said support level, however, the 200-day SMA (orange – 1.3224) appears to be flattening, sited just ahead of the 50-day SMA (blue – 1.3148), which also appears to be flattening out.
Areas of consideration:
Although USD/CAD registered its fifth consecutive session higher last week, the market appears to be overbought and due a correction. We have resistance close by on the weekly timeframe around the 1.3340 neighbourhood, and two layers of H4 Quasimodo resistances at 1.3361/1.3336. In addition, the relative strength index (RSI) on the H4 shows bearish divergence as the indicator languishes south of its overbought value. With this being the case, the area between the two H4 Quasimodo resistances may be a zone sellers inhabit.
On the other hand, though, daily price indicates room to press as far north as resistance at 1.3382. Therefore, a run higher is still certainly not out of the question.
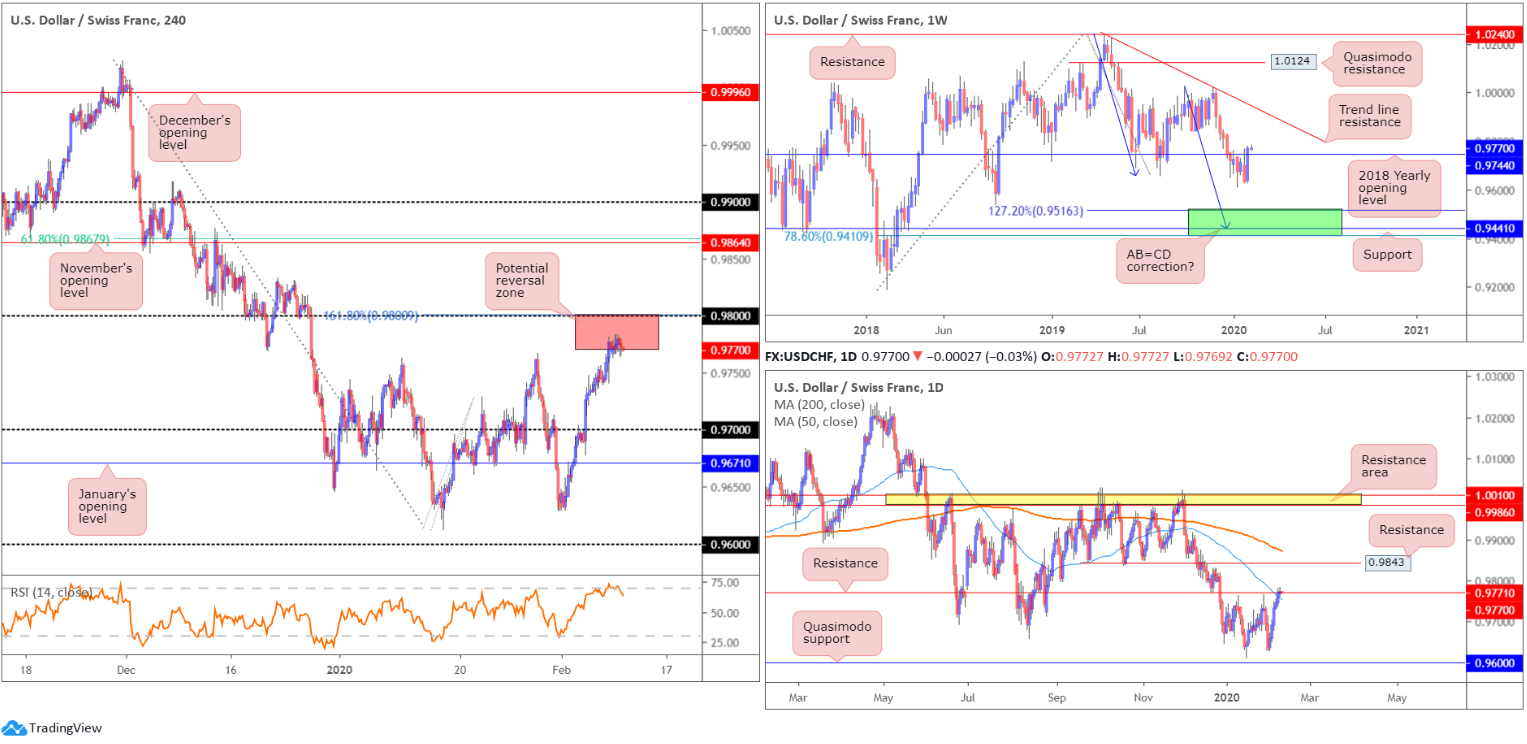
USD/CHF:
USD/CHF wrapped up Monday’s session unmoved, though did manage to eke out fresh highs at 0.9783. In light of yesterday’s lacklustre performance, a lot of the following analysis will reflect Monday’s technical briefing.
From the weekly timeframe:
A stronger-than-expected recovery emerged in recent trading, marginally brushing aside the 2018 yearly opening level at 0.9744 and reaching highs at 0.9781. At this stage, navigating higher is possible this week, perhaps targeting trend line resistance, etched from the high 1.0236. Despite recent buying, the next notable downside target sits within 0.9410/0.9516, comprised of a 78.6% Fibonacci retracement at 0.9410, support at 0.9441 and a 127.2% AB=CD bullish correction (black arrows]) at 0.9516 – green.
Daily timeframe:
Shaped by way of five consecutive bullish candles, USD/CHF crossed paths with resistance coming in at 0.9771 into last week’s close, a level that converges closely with the 50-day SMA (blue – 0.9752). Elbowing above the said resistance this week, in some respects, confirms buyer intent on the weekly timeframe. Daily resistance at 0.9843 is the next target in the firing range, with a break revealing the 200-day SMA (orange – 0.9877).
Turning lower from the current resistance level will, ultimately, draw attention to Quasimodo support at 0.9600.
H4 timeframe:
Broad-based USD bidding Friday elevated USD/CHF higher, overthrowing the 0.9766 January 29th high and registering a weekly gain of more than 135 points.
The break of the said high likely tripped buy stops, with upside appearing starved of resistance until reaching the 0.98 handle and converging 161.8% Fibonacci extension. What’s also interesting from a technical perspective is the relative strength index (RSI) is seen exiting overbought territory, following a peak of around 73.00.
Areas of consideration:
While weekly price suggests the possibility of additional buying this week, the combination of daily resistance at 0.9771/50-day SMA and the round number at 0.98/161.8% Fibonacci extension, as well as RSI confirmation, is likely enough to attract sellers (red zone on H4).
Conservative sellers threatened by the recent close on the weekly timeframe, nevertheless, may opt to wait for additional confirmation, though this is trader dependent.
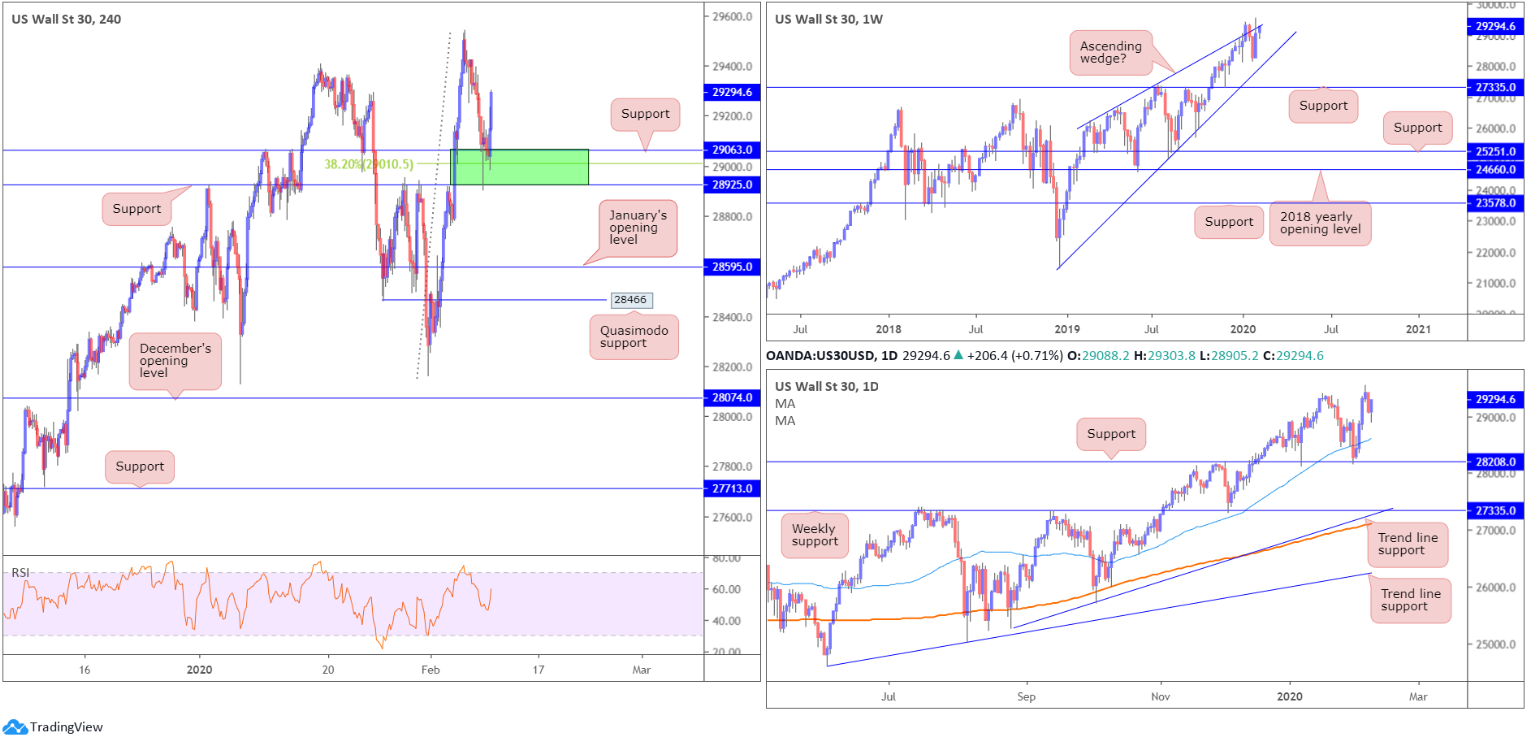
Dow Jones Industrial Average:
US stocks edged higher Monday, despite the coronavirus outbreak’s potential disruption to global supply chains. The Dow Jones Industrial Average gained 174.31 points, or 0.60%; the S&P 500 added 24.38 points, or 0.73% and the tech-heavy Nasdaq 100 ended higher by 115.74 points, or 1.23%.
For those who read Monday’s technical briefing you may recall the following:
The H4 area marked in green between 28925/29063 is particularly attractive as it holds a 38.2% Fibonacci value at 29010 within.
As evident from the H4 timeframe we can see price did indeed respond to 28925/29063, with the H4 candles currently trading around 29294. Well done to any readers who managed to jump aboard this area. As for the bigger picture, not much has changed since Monday’s report:
Weekly timeframe:
Despite clocking fresh all-time peaks at 29541 last week, the weekly timeframe shows the index has been compressing within an ascending wedge since the beginning of 2019 (21452/26668). Outside of the aforementioned wedge, support rests at 27335.
Daily timeframe:
Focus on the daily timeframe, with respect to support levels, remains around the 28208 region. However, traders may also find support draws off the 50-day SMA (blue – 28587).
Areas of consideration:
The reaction out of 28925/29063 appears strong enough to prompt an attack at fresh all-time highs recorded last week at 29541. Traders long this zone may consider reducing risk to breakeven at this point, targeting 29541 as the initial upside barrier. Beyond here, adopting a trailing stop is an option.
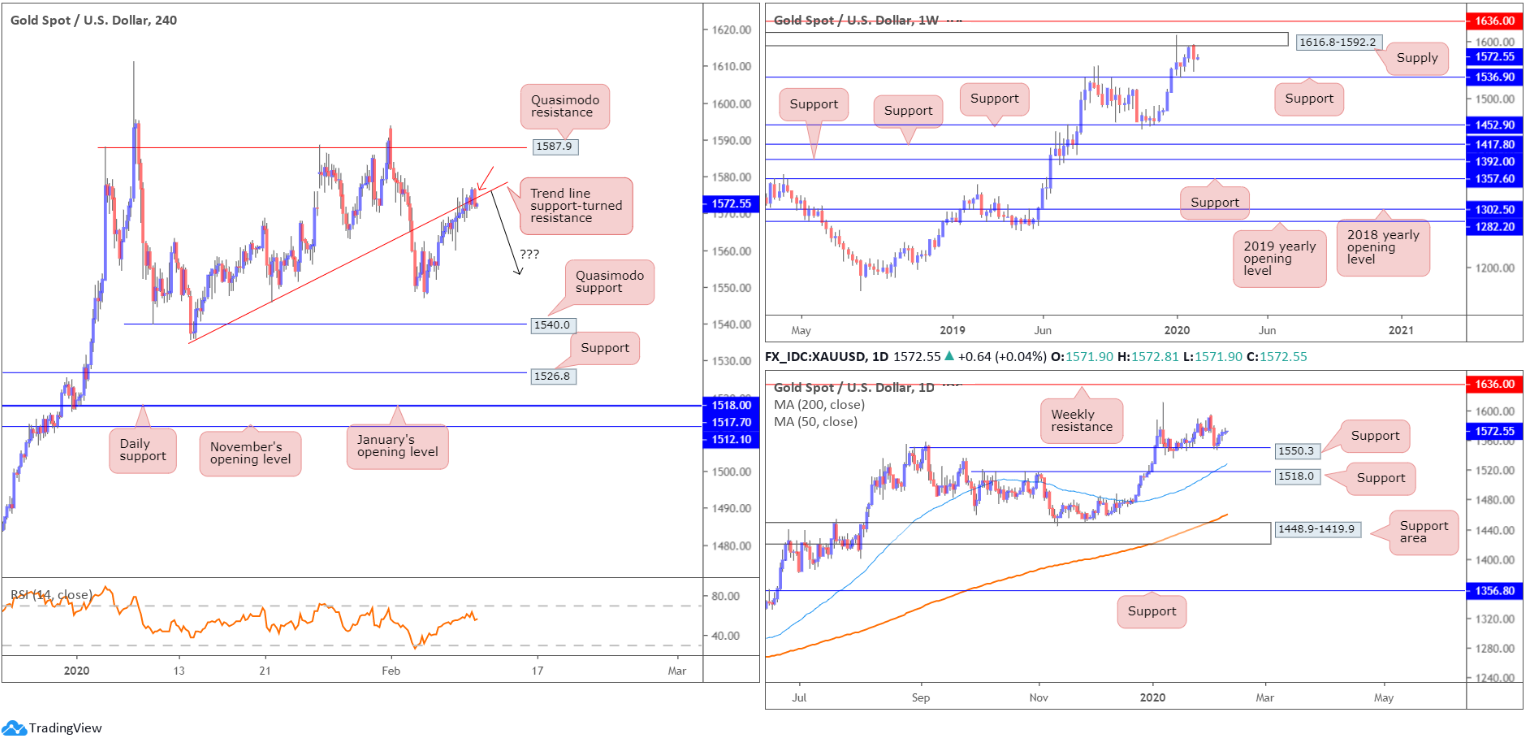
XAU/USD (GOLD):
XAU/USD, in $ terms, managed to eke out marginal gains Monday, though pared most of the days move off session highs at 1576.9. Overall, Monday’s outlook remains unchanged, given the lack of movement.
From the weekly timeframe:
Since the beginning of the year, longer-term candles have been confined to a range between supply drawn from 1616.8-1592.2 and support seen at 1536.9.
Areas outside of this area can be seen at resistance from 1636.0 and support fixed at 1452.9.
Daily timeframe:
A closer reading of price action on the daily timeframe has the unit rebounding from support at 1550.3, fixed north of another layer of support at 1518.0, which happens to merge closely with the 50-day SMA (blue – 1528.7). As you can see, weekly and daily structure have diverging views right now.
H4 timeframe:
Developments on the technical front has H4 stationed off trend line support-turned resistance, taken from the low 1536.2. Continued bidding from here invites an approach towards Quasimodo resistance coming in at 1587.9, whereas a rejection, aside from last Wednesday’s low at 1547.6, has Quasimodo support at 1540.0 to target.
Areas of consideration:
Although further recovery off daily support at 1550.3 may develop, the threat of further selling on the weekly timeframe to support at 1536.9 is certainly there. With higher timeframes usually taking precedence over lower timeframes, a turn lower at the current H4 trend line resistance is achievable. What’s also appealing here is the closing candle that produced a strong bearish H4 rotation candle (essentially a near-full-bodied bearish candle – red arrow). Not only does this help identify seller intent, it provides entry and risk levels to work with.
The accuracy, completeness and timeliness of the information contained on this site cannot be guaranteed. IC Markets does not warranty, guarantee or make any representations, or assume any liability regarding financial results based on the use of the information in the site.
News, views, opinions, recommendations and other information obtained from sources outside of www.icmarkets.com.au, used in this site are believed to be reliable, but we cannot guarantee their accuracy or completeness. All such information is subject to change at any time without notice. IC Markets assumes no responsibility for the content of any linked site.
The fact that such links may exist does not indicate approval or endorsement of any material contained on any linked site. IC Markets is not liable for any harm caused by the transmission, through accessing the services or information on this site, of a computer virus, or other computer code or programming device that might be used to access, delete, damage, disable, disrupt or otherwise impede in any manner, the operation of the site or of any user’s software, hardware, data or property.


