
Key risk events today:
Australia NAB Business Confidence; China CPI y/y; China PPI y/y; UK Average Earnings Index 3m/y; UK Claimant Count Change; UK Unemployment Rate.
EUR/USD:
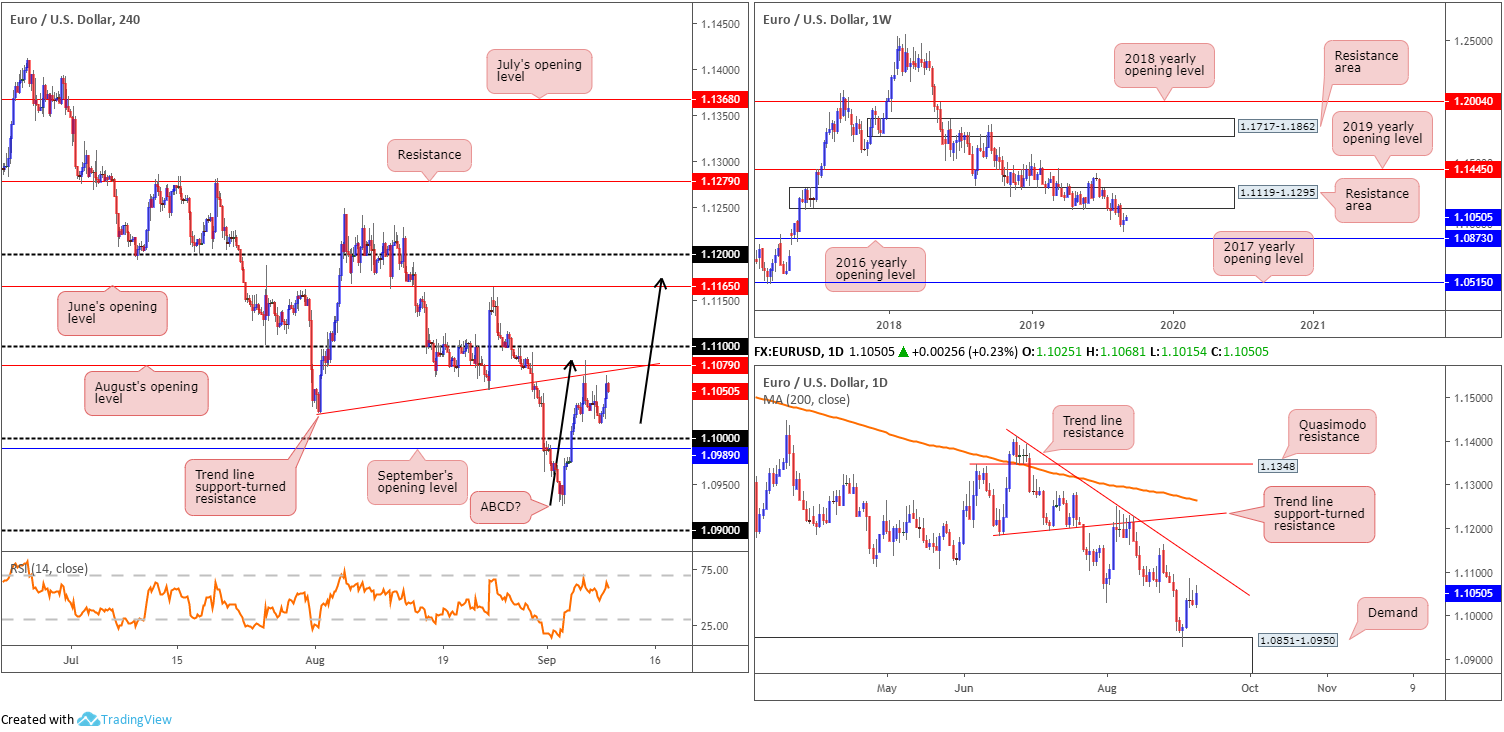
Europe’s single currency managed to eke out gains versus its US counterpart Monday, although movement was watered-down by the absence of macroeconomic data and a wait-and-see stance ahead of the European Central Bank’s monetary policy meeting later this week.
Technically, the EUR/USD is languishing south of 1.1119-1.1295 on the weekly timeframe, a demand-turned resistance area. Current action is leaning towards a retest of the zone, though a run to the 2016 yearly opening level at 1.0873 is also a possibility.
Elsewhere, daily flow remains buoyed by demand pencilled in at 1.0851-1.0950 – houses the 2016 yearly opening level within its lower limits – poised to approach trend line resistance taken from the high 1.1412. A closer reading of price action on the H4 timeframe, however, has the candles capped beneath August’s opening level at 1.1079 and a nearby trend line support-turned resistance (extended from the low 1.1026). Beyond here, the research team notes possible resistance emerging from 1.11 and June’s opening level at 1.1165, which also merges closely with an ABCD correction (black arrows) at 1.1173.
Areas of consideration:
According to the chart studies on all three timeframes, this is a sellers’ market right now. The problem is the number of H4 resistances available. A short from August’s opening level at 1.1079 and its intersecting trend line resistance may hold, for example, whereas we might press higher and attack the 1.11 handle and the closely converging daily trend line resistance, which may also hold, as might June’s opening level at 1.1165.
The best way to overcome this is wait and see how H4 action behaves at the said resistances. A bearish configuration from either barrier, for instance, helps identify seller intent and provides strict entry and risk levels to work with.
GBP/USD:
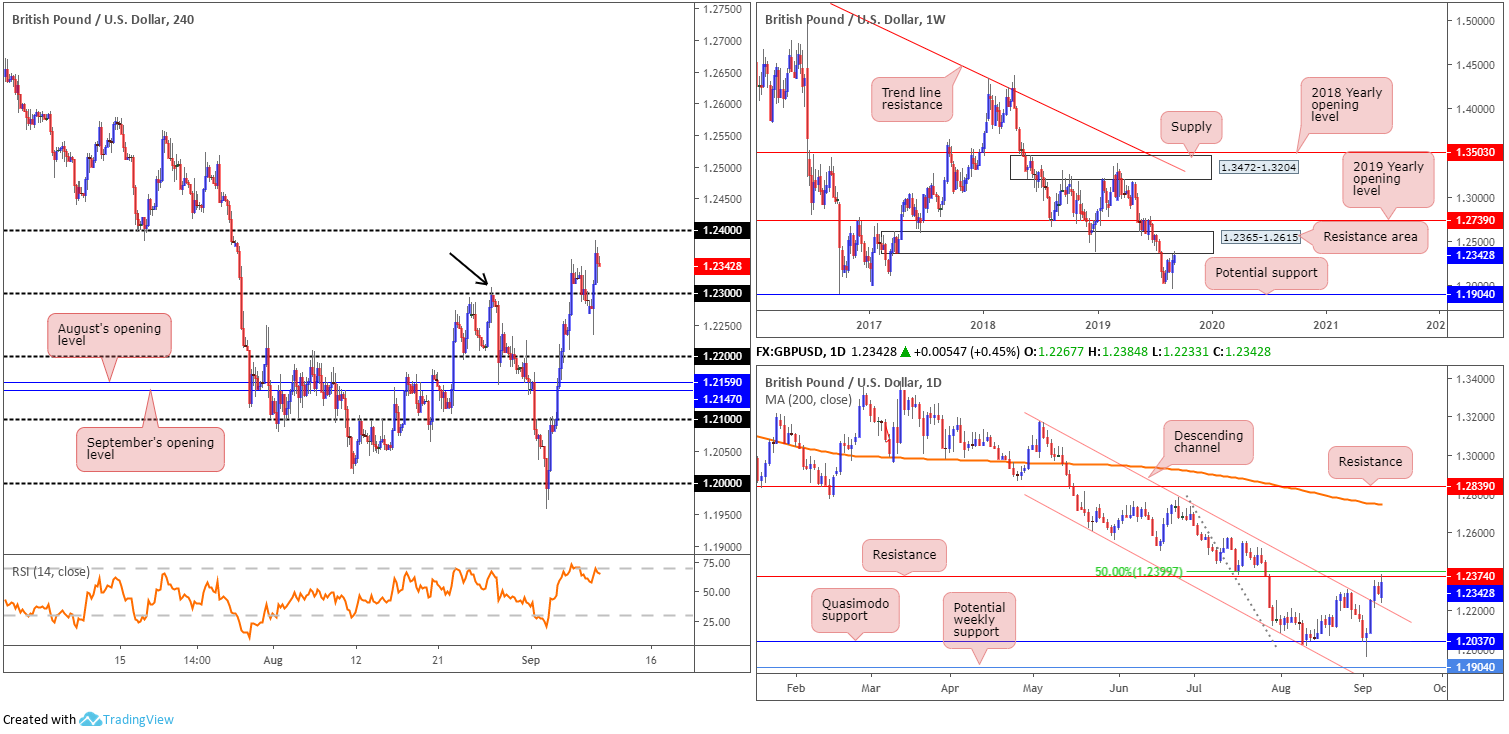
Formed in the shape of a bullish outside day, the British pound advanced against the dollar Monday. Despite this, price ran into headwinds ahead of 1.24 as UK House of Commons speaker Bercow announced if UK Parliament does not vote for a general election he will be standing down on October 31st. Bercow has widely been seen as a remainer.
From a technical perspective, having seen the notable high set at 1.2309 (black arrow) recently engulfed on the H4 scale, traders, particularly on the H4 timeframe and lower, are likely eyeing higher movement. However, this comes at a price. Higher-timeframe analysis has a weekly resistance area positioned at 1.2365-1.2615 in motion, and daily price, albeit in the form of a bullish outside day, tackling resistance at 1.2374, closely shadowed by the 50.0% resistance value at 1.2399.
Areas of consideration:
In light of the technical position on the higher timeframes, sellers are likely to make an appearance. Before pressing the sell button, though, traders are urged to let H4 price prove itself: reclaiming 1.23 to the downside and likely clearing the pathway to at least 1.22. A H4 close below 1.23 that’s followed up by a retest is an ideal sell signal (entry and risk can be determined on the back of the rejection candle).
AUD/USD:
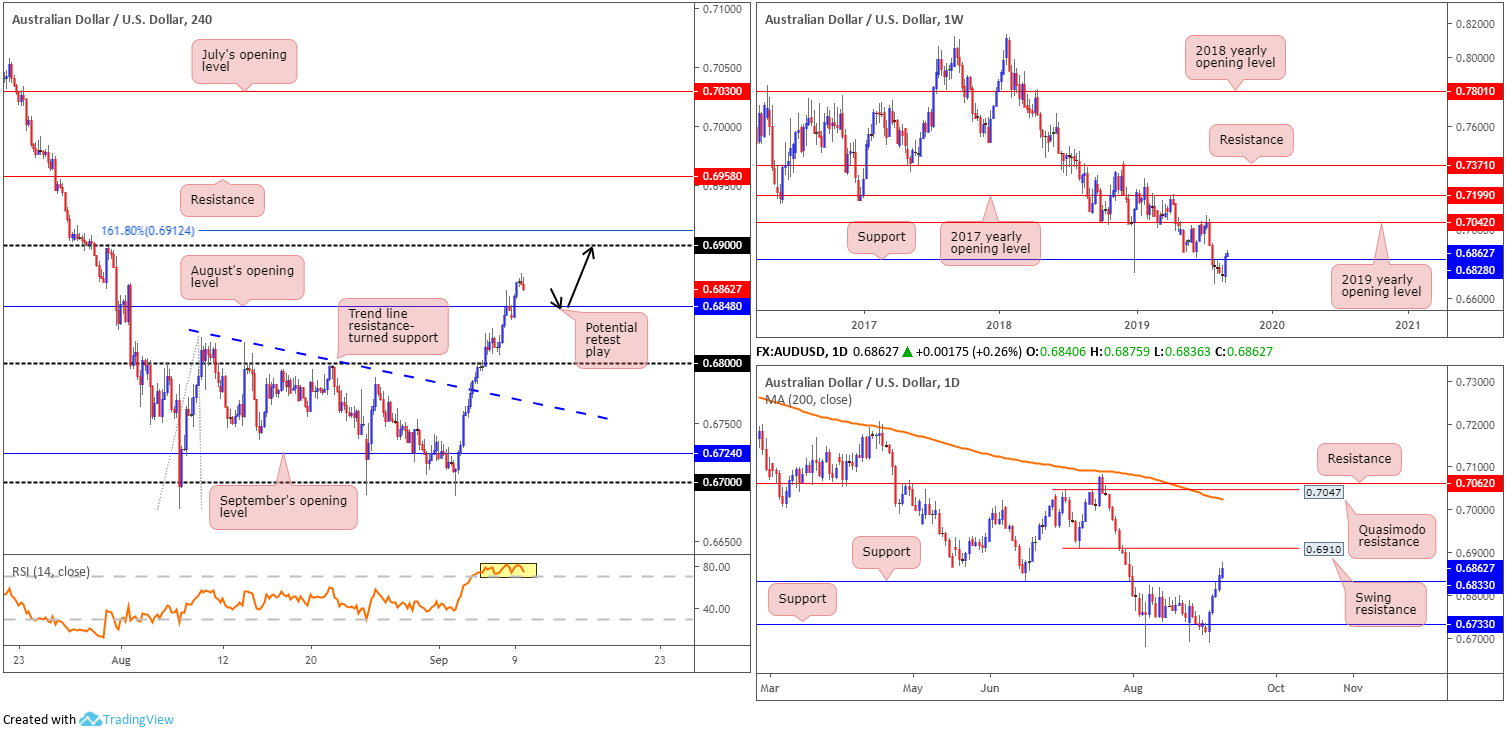
Kicking things off on the weekly timeframe this morning, we can see the pair staged a strong comeback last week. By way of a bullish outside day, the unit wrapped up the week north of support at 0.6828. If buyers remain in the driving seat, an approach towards the 2019 yearly opening level at 0.7042 is likely on the cards.
In conjunction with weekly structure, the daily timeframe also ended last week north of support at 0.6833. The next upside target on this scale, nonetheless, falls in at 0.6910, a swing resistance, though beyond here we have eyes on Quasimodo resistance at 0.7047 and resistance at 0.7062. It might also interest some traders to note the 200-day SMA lurks close by at 0.7023 (orange).
Across the page, H4 movement recently overthrew August’s opening level at 0.6848, potentially clearing the runway to 0.69, closely followed by a 161.8% Fibonacci ext. point at 0.6912. Indicator-based traders may also wish to acknowledge the RSI is set deeply within overbought territory (yellow).
Areas of consideration:
Considering the increasingly strong bullish theme on the higher timeframes, entering long based on a retest at August’s opening level drawn from 0.6848 on the H4, could be an option. A retest of this level in the shape of a H4 bullish candlestick signal will likely entice buyers into the market, with eyeballs on 0.69 as the initial upside target, which sits just beneath daily resistance at 0.6910 and the 161.8% H4 Fibonacci ext. point mentioned above at 0.6912.
USD/JPY:
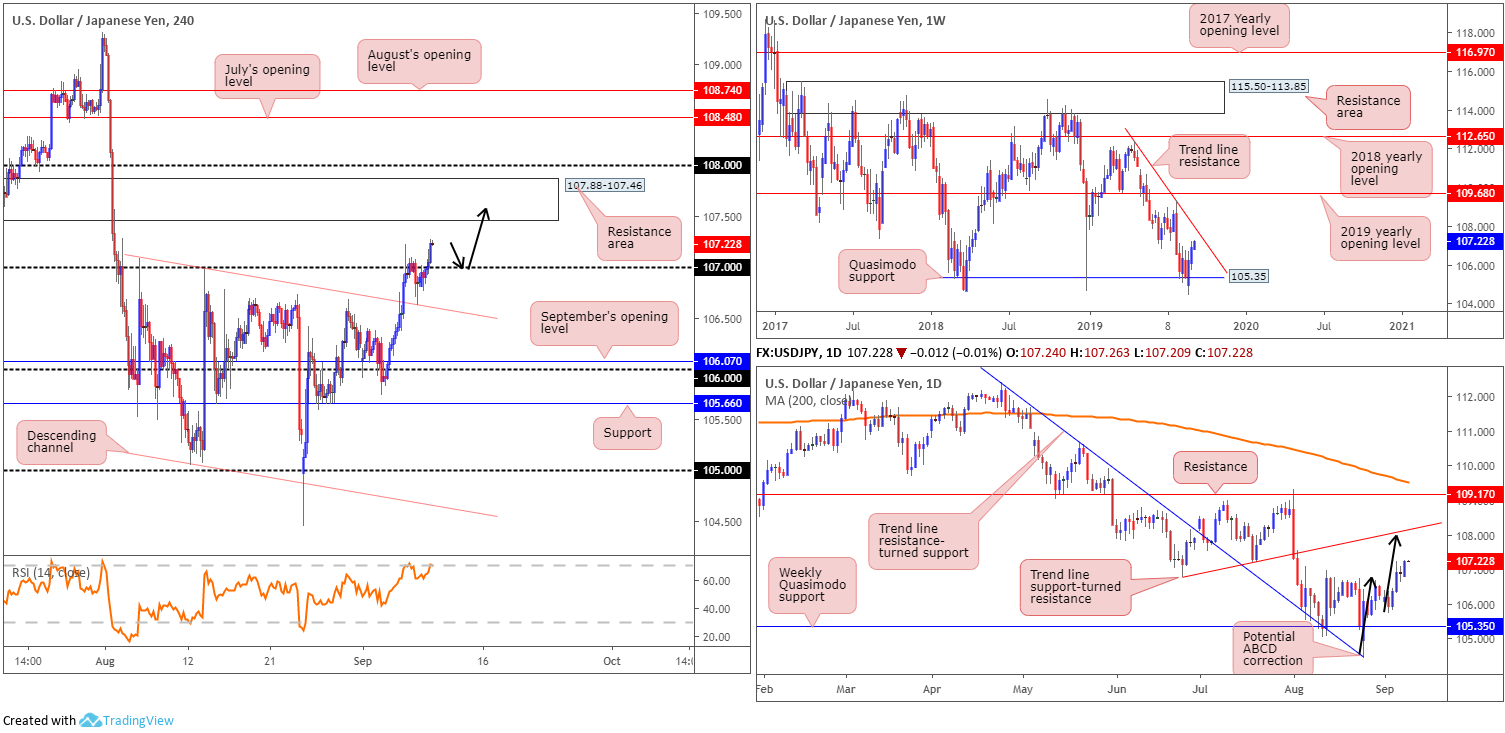
USD/JPY action kicked off the week on a strong footing, adding 0.32%. Following a crisp retest off channel resistance-turned support (extended from the high 107.09), as well as rising US Treasury yields/US equity markets, H4 flow dethroned 107 and appears on course to challenge a nearby resistance area at 107.88-107.46, closely trailed by the 108 handle. The said H4 resistance zone boasts a reasonably strong standing, therefore a response from within its walls is possible.
In terms of where we stand on the weekly timeframe, Quasimodo support at 105.35 has held form, prompting a possible revisit at trend line resistance (extended from the high 112.40). Note this trend line also happens to intersect with the H4 resistance area highlighted above at 107.88-107.46.
Looking at the daily timeframe, the technical picture emphasises further upside may be in store, targeting trend line support-turned resistance (extended from the low 106.78) in the shape of a potential ABCD correction point at 108.
Areas of consideration:
Although a response is expected from the H4 resistance area at 107.88-107.46, a fakeout through this area to orders sitting at 108 is also a possibility. Also note the current weekly trend line resistance intersects with the UPPER limit of the H4 resistance zone and the daily candles are on course to complete an ABCD correction at 108.
Based on the chart studies, everything points to a move towards 108 before sellers step in. Therefore, traders are urged to keep an eye out for a retest at 107 to form for possible buying opportunities, targeting 108. As round numbers are prone to whipsaws (stop runs), consider waiting for a H4 bullish candlestick pattern to form before pulling the trigger (entry/risk can be set according to this structure).
USD/CAD:
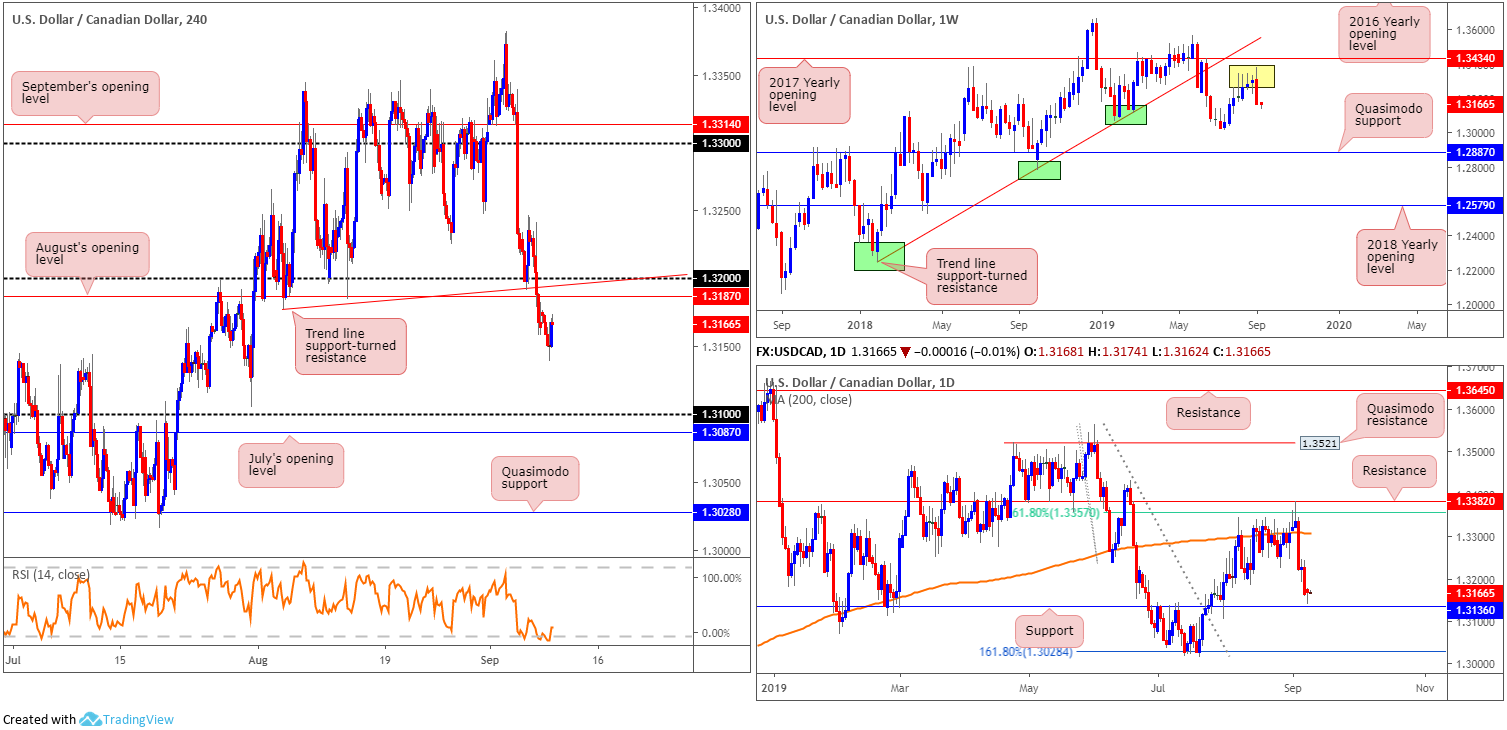
Over the course of Monday’s session, the USD/CAD market clocked lows not seen since late July at 1.3139, weighed by rising crude oil prices.
Leaving the 2017 yearly opening level at 1.3434 unchallenged on the weekly timeframe, last week’s movement wrapped up the week deeply within bearish territory. Down more than 1.00% and forming a clear-cut bearish outside day, traders’ focus will likely be on the 1.3016 July 15 low, followed by Quasimodo support at 1.2887. Contrary to weekly structure, however, daily price, after having found resistance at 1.3382, is within striking distance of a well-placed support at 1.3136.
Closer analysis on the H4 timeframe reveals a possible retest at August’s opening level coming in from 1.3187 may be seen.
Areas of consideration:
1.3187 is a notable level, as daily price has yet to connect with support at 1.3136 and we also have another layer of resistance supporting 1.3187 at 1.32 and a trend line support-turned resistance (taken from the low 1.3177). Therefore, a retest of 1.32/1.3187 today, preferably formed by way of a H4 bearish candlestick pattern (entry/risk can be determined according to this structure), is certainly an option with an initial downside objective set at 1.3136, the noted daily support level.
USD/CHF:
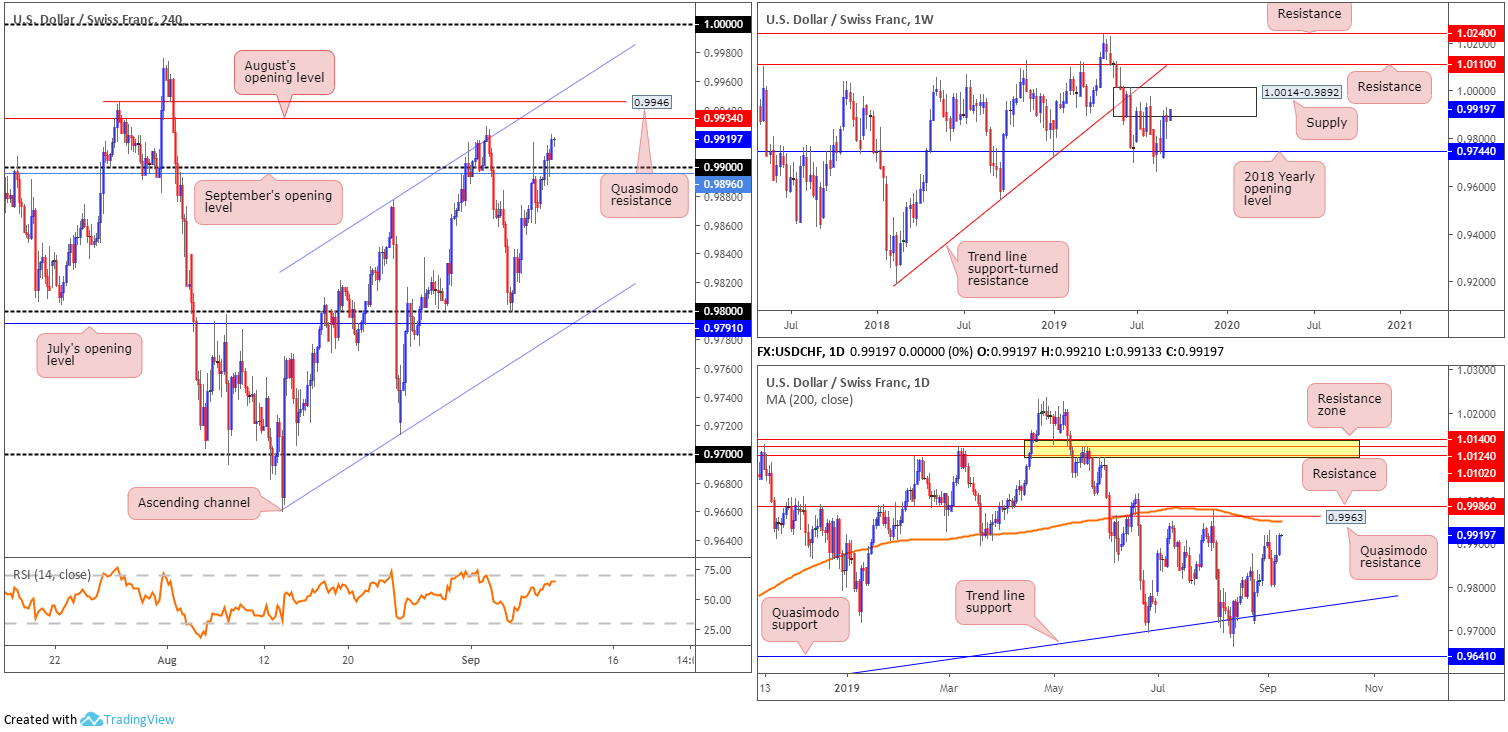
The US dollar swung into positive territory against the Swiss franc at the beginning of the week, consequently extending last week’s bid within the current H4 ascending channel formation (0.9659/0.9877). Recently making its way above 0.99 and retesting the barrier on two occasions, the next upside objective on the H4 timeframe falls in around August’s opening level at 0.9934, closely shadowed by Quasimodo resistance at 0.9946.
Higher-timeframe analysis has the weekly candles driving higher into the walls of a supply zone coming in at 1.0014-0.9892. In the event buyers brush aside the said supply (unlikely a straightforward feat), resistance at 1.0110 is in view, as is a long-term trend line support-turned resistance taken from the low 0.9187.
A closer interpretation of price action on the daily timeframe shows an impressive recovery off trend line support (etched from the low 0.9542), which since mid-August has seen the candles grinding higher. Areas of interest to the upside fall on Quasimodo resistance at 0.9963, a 200-day SMA (orange – 0.9953) and resistance coming in from 0.9986.
Areas of consideration:
With weekly players trading from supply at 1.0014-0.9892, the research team has eyes on the daily resistance area between 0.9986/0.9953 for possible shorting opportunities. A test of this area in the shape of a bearish candlestick signal (entry and risk to be set according to this structure), either on the H4 or daily timeframes, is considered a high-probability setup.
Dow Jones Industrial Average:
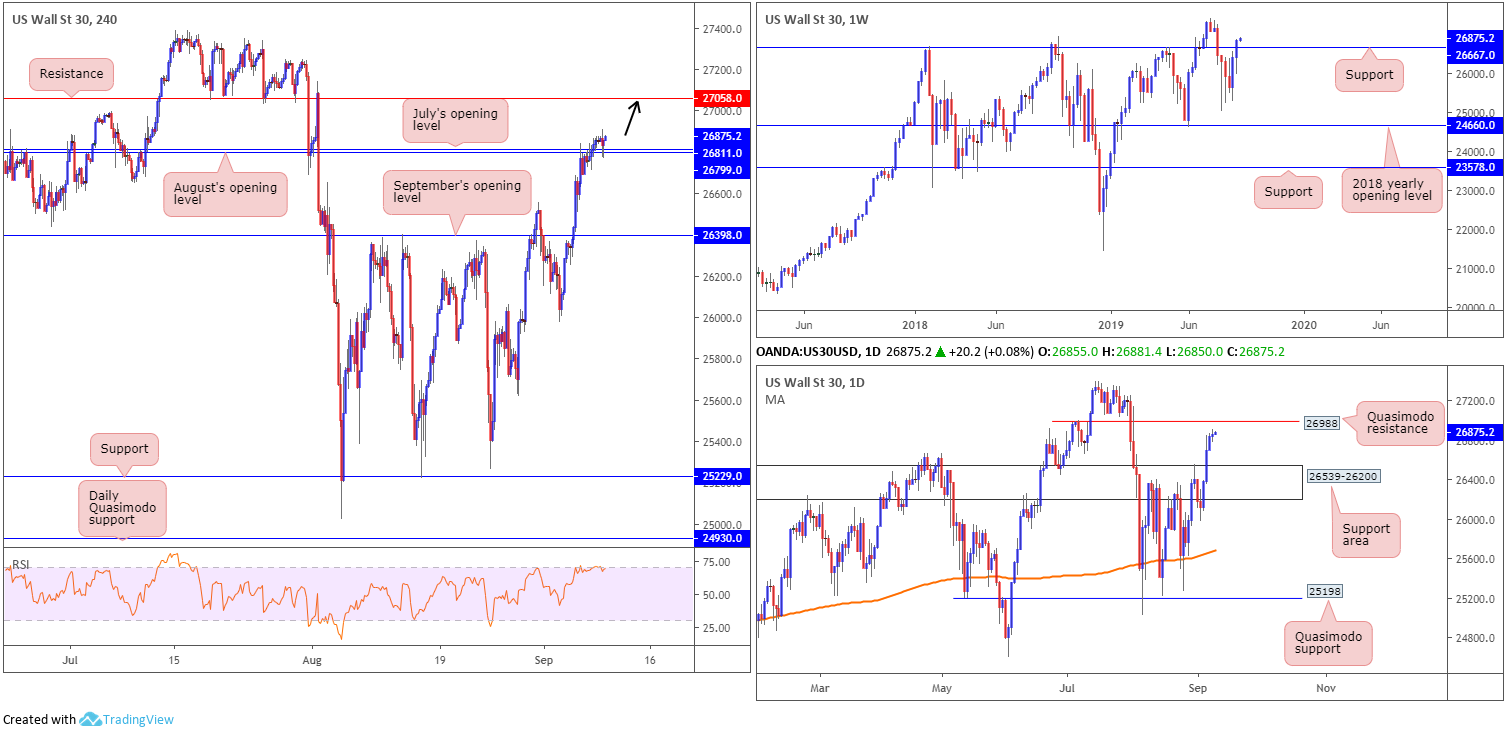
US equities wrapped up Monday mixed as investors weighed up signs of stimulus measures in major economies, alongside the latest Brexit developments. The Dow Jones Industrial Average added 38.05 points, or 0.14%; the S&P 500 lost 0.28 points, or 0.01% and the tech-heavy Nasdaq 100 declined 20.14 points, or 0.26%.
In view of the latest technical movement, H4 price retested August/July’s opening levels 26799/26811 in the form of a hammer pattern. This could entice buyers into the market today, targeting clear-cut resistance at 27058.
On a wider perspective, we have weekly price eyeing all-time highs at 27388 after crossing above resistance at 26667 (now acting support), and daily price poised to approach Quasimodo resistance at 26988.
Areas of consideration:
Keeping it simple this morning, based on the chart studies the research team feels a long at current price is valid with a protective stop-loss order positioned beneath 26799 (H4 structure), and an initial upside target set at the daily Quasimodo resistance taken from 26988.
XAU/USD (GOLD):
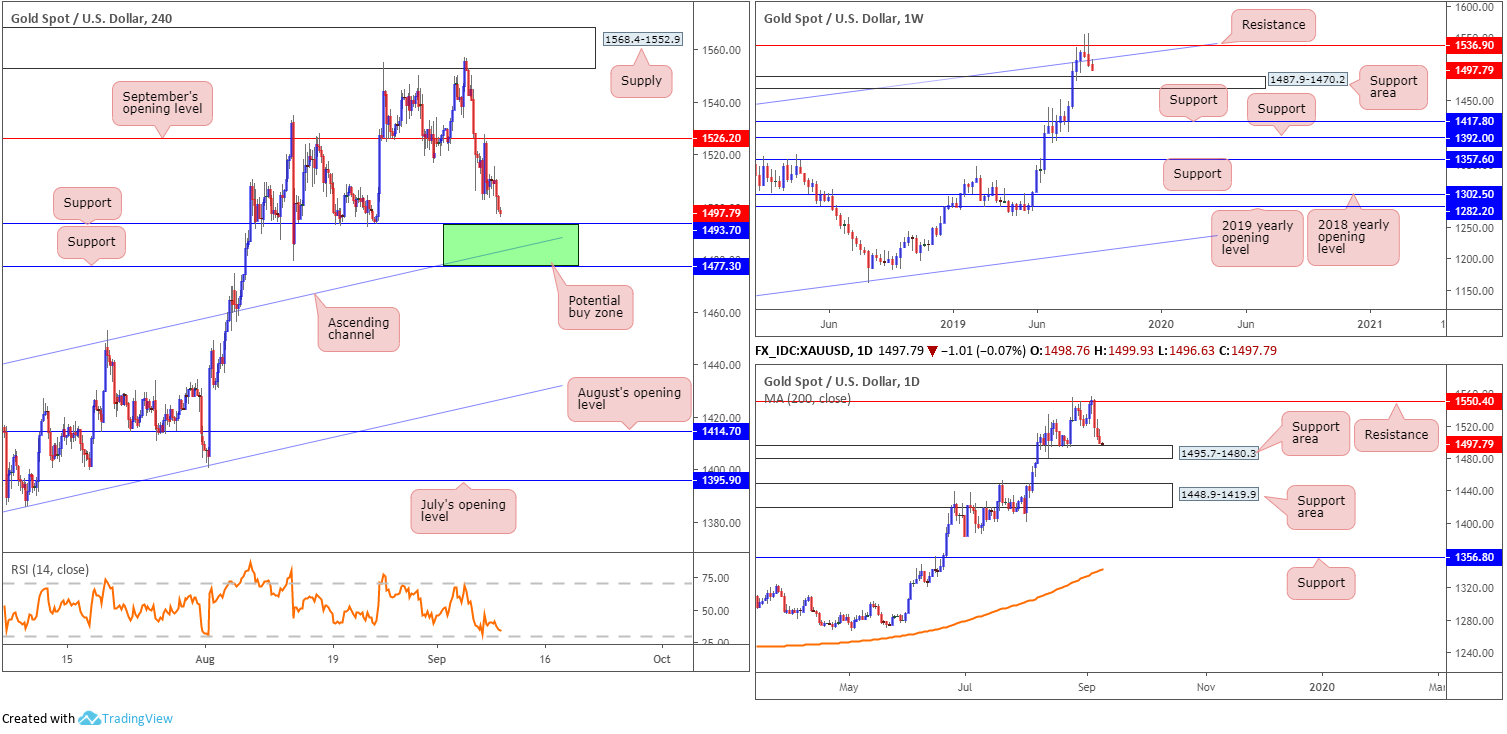
Coming in from the top this morning, bullion rotated lower from notable resistance priced in at 1536.9 (boasts strong historical significance – check late 2011 and early 2012) last week by way of a bearish outside formation (considered a bearish signal). As we also registered a close back beneath nearby channel resistance-turned support (taken from the high 1375.1), further downside towards a support area at 1487.9-1470.2 is likely in store.
As for the daily timeframe, thanks to recent selling, we are now within touching distance of a support area coming in at 1495.7-1480.3. A violation of this area has another support area in the firing range at 1448.9-1419.9.
As can be seen from the H4 timeframe this morning, the unit is within a few points of connecting with support at 1493.7. Note beyond here we also have another layer of support residing at 1477.3 and a channel resistance-turned support extended from the high 1437.7.
Areas of consideration:
The green area on the H4 timeframe between 1477.3/1493.7 is considered a notable buy zone. Not only does it hold H4 channel support within, it merges with a daily support area coming in at 1495.7-1480.3, and the top edge of the weekly support area at 1487.9. Entry can be found at 1493.7, with protective stop-loss orders positioned beneath 1477.3. For conservative desiring a little more confirmation, waiting for a H4 bullish candlestick formation to develop could be the way to go. Not only does this help confirm buyer intent, it also provides entry and risk levels to trade with.
The accuracy, completeness and timeliness of the information contained on this site cannot be guaranteed. IC Markets does not warranty, guarantee or make any representations, or assume any liability regarding financial results based on the use of the information in the site.
News, views, opinions, recommendations and other information obtained from sources outside of www.icmarkets.com.au, used in this site are believed to be reliable, but we cannot guarantee their accuracy or completeness. All such information is subject to change at any time without notice. IC Markets assumes no responsibility for the content of any linked site.
The fact that such links may exist does not indicate approval or endorsement of any material contained on any linked site. IC Markets is not liable for any harm caused by the transmission, through accessing the services or information on this site, of a computer virus, or other computer code or programming device that might be used to access, delete, damage, disable, disrupt or otherwise impede in any manner, the operation of the site or of any user’s software, hardware, data or property.


